Water usage statistics for US homes point one way: each person uses less water than a generation ago, while the bill keeps climbing. Most of the drop comes from better toilets, washers and faucets, not from new habits. What still swings with the weather is the water used outside the house.
This page gathers the latest numbers from federal agencies, the Water Research Foundation, state and city water utilities and the Bureau of Labor Statistics. It covers use per person and per home, indoor and outdoor use, fixtures and appliances, water waste, savings from efficient products, prices and the rules that shape all of it. Every figure is dated and linked to the page or file it came from.
For a plumbing shop, these numbers are job types. Fixture swaps, irrigation repairs and bathroom remodels all start with a homeowner who asks what the work will save. Having the facts ready makes the quote easier to explain. For what leaks waste, see the water leak numbers. For hot water, see the water heater numbers. For water quality, see the drinking water numbers. For the trade itself, see the plumbing industry numbers and the plumbing workforce numbers. Updated October 2026.
Key Takeaways
- The average person in the US used 82 gallons of water a day at home in 2015 (USGS Circular 1441, Jun 2018).
- Indoor use per person in single-family homes fell 44.4%, from 69.3 gallons a day in 1999 to 38.5 in 2026 (Water Research Foundation, Jun 2026).
- The average toilet flush fell to 1.84 gallons in 2026, which is 46.6% less than in 1999 (Water Research Foundation, Jun 2026).
- Showering accounts for nearly 17% of indoor water use (EPA WaterSense, Mar 2026).
- Per-person use from public supply ranged from 35 gallons a day in Connecticut to 186 in Idaho in 2015 (USGS Circular 1441, Jun 2018).
- Lawns cover about 128,000 square kilometers of the US (NASA Earth Observatory, Nov 2005).
- As much as 50% of the water used outdoors is lost to wind, evaporation and runoff (EPA WaterSense, Mar 2026).
- WaterSense and its partners helped Americans save a cumulative 11.2 trillion gallons of water through 2025 (EPA WaterSense, Sep 2026).
- The price index for water and sewerage maintenance rose from 504.402 in January 2016 to 767.041 in September 2026 (BLS CPI, Oct 2026).
- Average residential water and wastewater service cost $16.83 per 1,000 gallons combined in 2024 (EPA WaterSense, Feb 2026).
- 89.79 million of 123.53 million US homes had a dishwasher in 2020 (EIA RECS, Mar 2023).
- Southern Nevada cut per-person water use 58% between 2002 and 2025 while adding about 876,000 residents (SNWA, Oct 2026).
- 53% of Americans worry a great deal about the supply of fresh water for household needs (Gallup, Mar 2026).
- 40 of 50 state water managers expected water shortages in some part of their states within 10 years (GAO, May 2014).
Household Water Use per Person and per Home
Most homes get their water from a public system, and the national average hides a wide spread. The last full federal count is for 2015. It is still the base that newer studies are measured against.
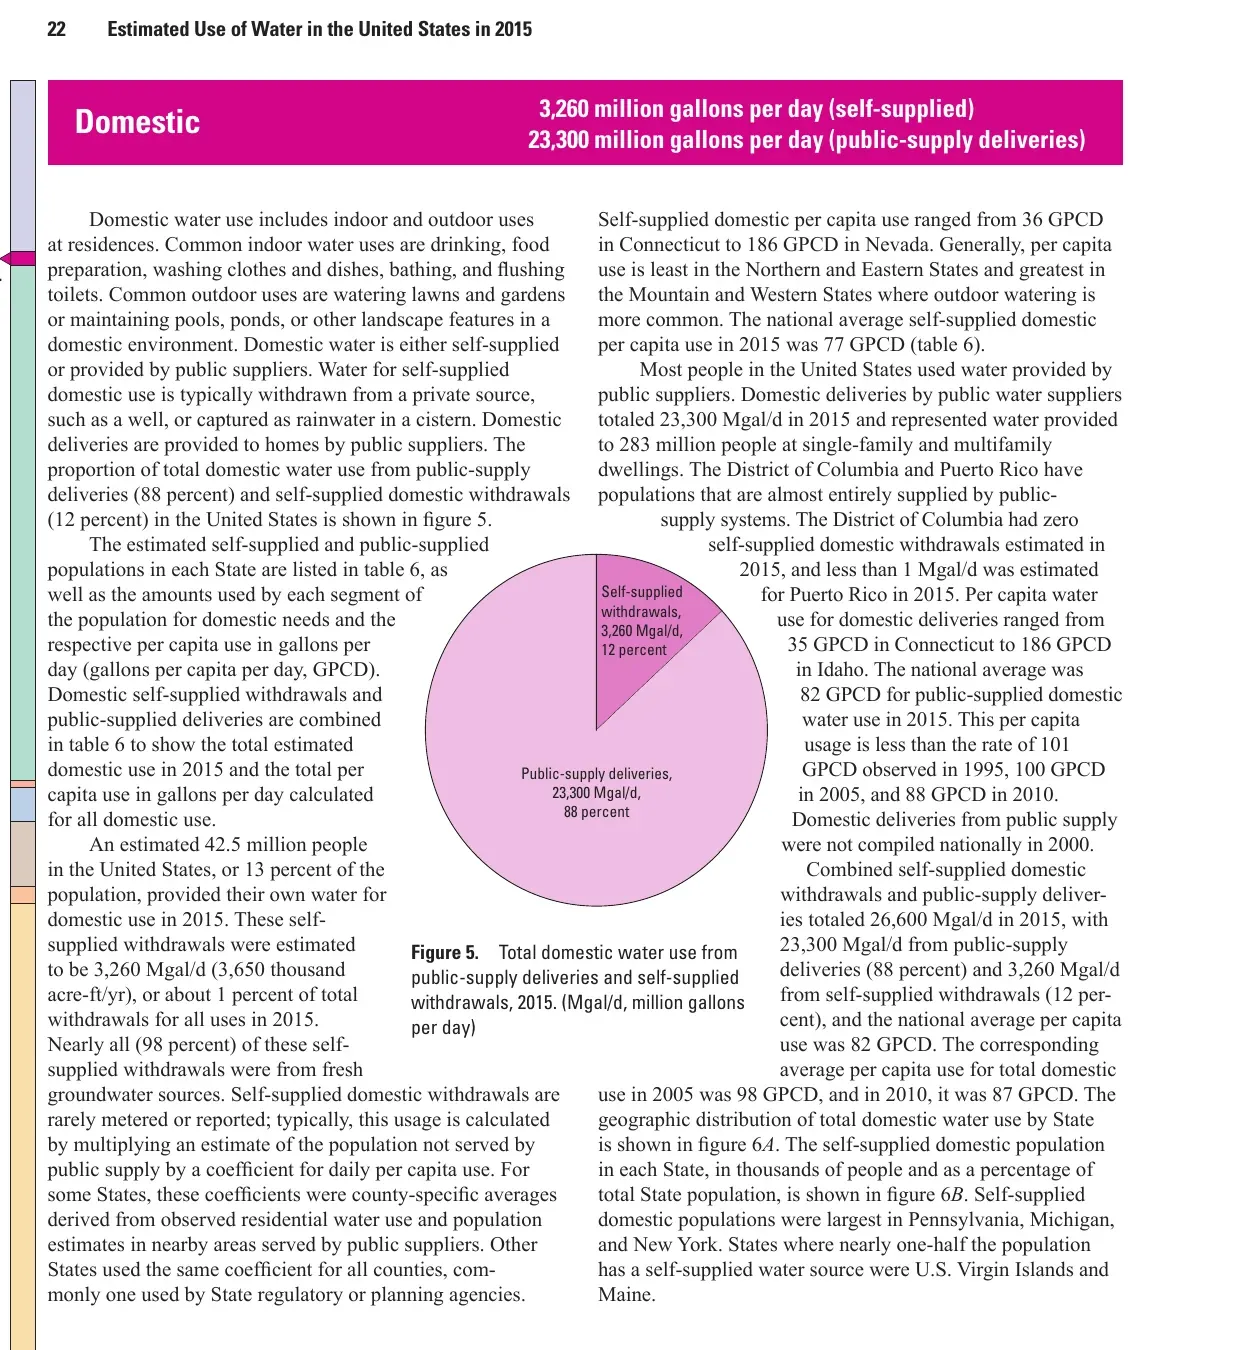 Figure 1: Almost nine of every ten gallons used at home arrive through a public water system, which is the water customers pay for by the gallon. Source: USGS, Estimated Use of Water in the United States in 2015, Circular 1441, Jun 2018. Screenshot of page 22 of the source report, captured 21 Oct 2026.
How much water does one person use at home each day?
- Public-supplied domestic use per person fell from 101 gallons a day in 1995 to 100 in 2005 and 88 in 2010 (USGS Circular 1441, Jun 2018).
- Total domestic use per person, counting wells and public supply together, was 98 gallons a day in 2005 and 87 in 2010 (USGS Circular 1441, Jun 2018).
- People on private wells and other self-supplied sources used 77 gallons a day each in 2015 (USGS Circular 1441, Jun 2018).
- The average American family uses more than 300 gallons of water per day at home (EPA WaterSense, Aug 2026).
- Roughly 70% of that family use happens indoors (EPA WaterSense, Aug 2026).
- US households use an estimated 29 billion gallons of water per day (EPA WaterSense, May 2026).
How much water do all US homes use together?
- Total domestic use was 26.6 billion gallons per day in 2015, down from 27.3 billion in 2010 (USGS Circular 1441, Jun 2018).
- Public suppliers delivered 23,300 million gallons per day to homes, which is 88% of domestic use (USGS Circular 1441, Jun 2018).
- Wells and other private sources supplied the other 12% of domestic water, equal to about 1% of all US water withdrawals (USGS Circular 1441, Jun 2018).
- Private domestic withdrawals were 8% lower in 2015 than in 2010 (USGS Circular 1441, Jun 2018).
- The US population grew 4% from 312.6 million in 2010 to 325.0 million in 2015, while public-supply withdrawals fell 7% to 39.0 billion gallons per day (USGS Circular 1441, Jun 2018).
How many people rely on a public water system?
- Public systems served 283 million people in 2015, about 87% of the US population (USGS Circular 1441, Jun 2018).
- An estimated 42.5 million people supplied their own water for home use in 2015 (USGS Circular 1441, Jun 2018).
- Nearly all private domestic withdrawals, 98%, came from fresh groundwater (USGS Circular 1441, Jun 2018).
- The self-supplied share of the population fell from about 18% in 1985 to 13% in 2015 (USGS Circular 1441, Jun 2018).
How many people share each home?
- The US had 39.7 million one-person households in 2025, or 29% of all households, up from 20% in 1975 (Census Bureau, Dec 2025).
Indoor Water Use per Person Over 30 Years
The largest change in this data is indoors. People did not start using water more carefully. The fixtures and appliances got better, and they were replaced one house at a time.
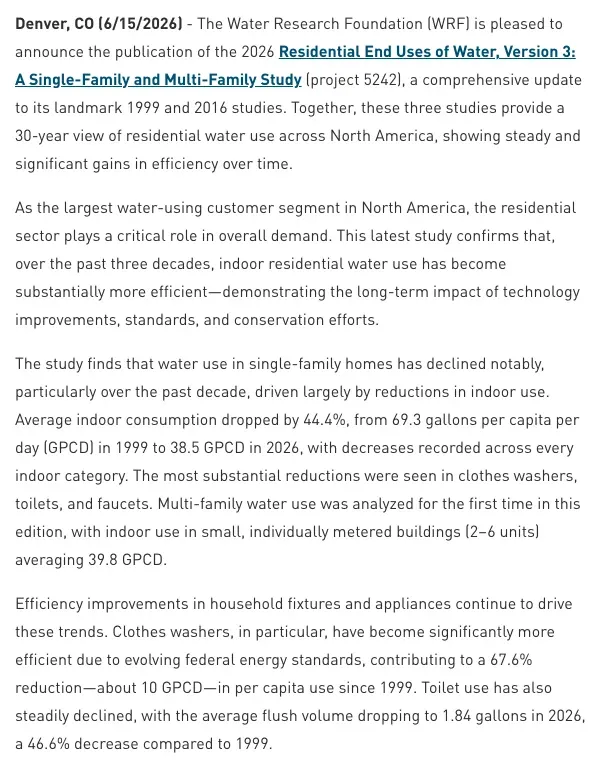 Figure 2: Three studies using comparable methods show indoor use per person falling in every category, with the biggest gains in clothes washers, toilets and faucets. Source: Water Research Foundation, Residential End Uses of Water, Version 3 news release, Jun 2026. Screenshot of the source page, captured 21 Oct 2026.
What does a person use indoors today?
- Indoor use in small, individually metered multi-family buildings of 2 to 6 units averaged 39.8 gallons per person per day, the first time the series measured multi-family homes (Water Research Foundation, Jun 2026).
- Decreases were recorded across every indoor category in single-family homes since 1999 (Water Research Foundation, Jun 2026).
- Clothes washers cut per-person use by 67.6%, about 10 gallons a day, since 1999 (Water Research Foundation, Jun 2026).
How was the 2026 study built?
- The study drew on 52 participating utilities across the US and Canada (Water Research Foundation, Jun 2026).
- It used billing data from over 4 million households (Water Research Foundation, Jun 2026).
- It is the third study in a series after the 1999 and 2016 editions, all with the same lead author (Water Research Foundation, Jun 2026).
Why did indoor use fall?
- The lead author says national plumbing codes and energy standards raised efficiency without much change in how people behave at home (Water Research Foundation, Jun 2026).
- USGS credits the 1992 energy policy act, which set efficiency standards for all toilets, faucets and showerheads, for part of the fall in domestic withdrawals (USGS Circular 1441, Jun 2018).
- WaterSense-labeled products are certified to use at least 20% less water than standard models (USGS Circular 1441, Jun 2018).
Showers, Toilets and Faucets: Flow Rates and Shares of Use
Toilets, showers and faucets drive a large part of the indoor bill. Federal flow limits have stood since 1994, and the label programs go further than the law.
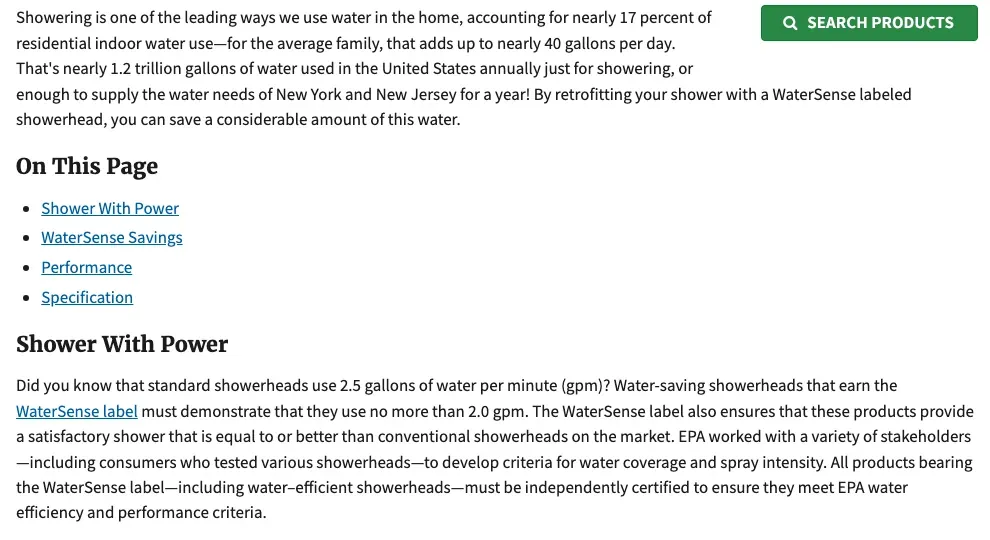 Figure 3: Showers use about a sixth of indoor water, and the label cuts the standard 2.5 gallons per minute to 2.0. Source: EPA WaterSense, Showerheads, Mar 2026. Screenshot of the source page, captured 21 Oct 2026.
How much of a home’s water goes to the bathroom?
- Bathrooms account for more than half of all indoor water use (EPA WaterSense, May 2026).
- Toilets account for nearly 30% of an average home’s indoor water use (EPA WaterSense, May 2026).
- For the average family, showers add up to nearly 40 gallons per day (EPA WaterSense, Mar 2026).
- Showering uses nearly 1.2 trillion gallons a year across the US (EPA WaterSense, Mar 2026).
How many bathrooms do US homes have, and how old are they?
- 56.85 million US homes had two full bathrooms in 2020, 50.32 million had one and 16.21 million had three or more (EIA RECS, Mar 2023).
- 20.26 million homes were built before 1950 (EIA RECS, Mar 2023).
- 18.34 million homes were built in the 1970s and 16.30 million in the 1980s, all before the 1994 federal flow limits (EIA RECS, Mar 2023).
- 17.16 million homes were built in the 1990s and 16.16 million in the 2000s (EIA RECS, Mar 2023).
What flow limits do federal rules set?
- Showerheads made after January 1, 1994 may use no more than 2.5 gallons per minute at 80 psi (eCFR, Oct 2026).
- Gravity-flush tank toilets may use no more than 1.6 gallons per flush (eCFR, Oct 2026).
- Blowout-bowl toilets may use 3.5 gallons per flush (eCFR, Oct 2026).
- Urinals may use 1.0 gallon per flush (eCFR, Oct 2026).
- Lavatory and kitchen faucets are capped at 2.2 gallons per minute (eCFR, Oct 2026).
- DOE repealed its regulatory definition of a showerhead in a rule effective May 15, 2025, so the definition in the federal statute now controls (Federal Register, Apr 2025).
- The repeal followed Executive Order 14264, signed April 9, 2025 (Federal Register, Apr 2025).
What do WaterSense labeled fixtures use?
- WaterSense labeled showerheads must use no more than 2.0 gallons per minute (EPA WaterSense, Mar 2026).
- WaterSense labeled toilets use 1.28 gallons per flush or less, which is 20% below the federal standard (EPA WaterSense, May 2026).
- Older, inefficient toilets can use as much as 6 gallons per flush (EPA WaterSense, May 2026).
- WaterSense labeled bathroom faucets and aerators use at most 1.5 gallons per minute, a cut of 30% or more from the standard 2.2 (EPA WaterSense, Jun 2026).
- EPA proposed in December 2024 to lower the labeled faucet limit to 1.2 gallons per minute, then paused that work in February 2025 (EPA WaterSense, Jun 2026).
- EPA released Version 2.0 of the tank-type toilet specification in May 2024 and has paused its effective date, so Version 1.2 stays in force (EPA WaterSense, May 2026).
Outdoor Water Use and Lawns
Outdoor use is the flexible part of the bill. It is also where a sprinkler repair or a new controller pays back fastest.
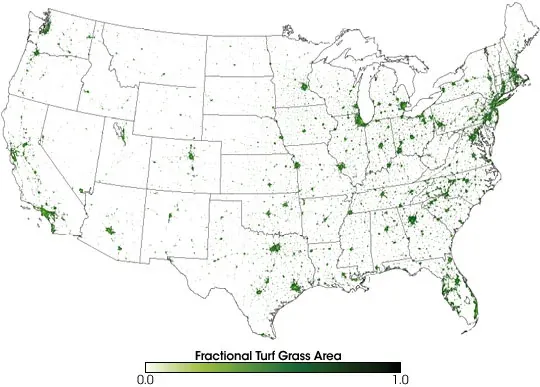 Figure 4: Lawns form a pattern around cities and suburbs, and NASA’s estimate says they could rank as the largest irrigated crop by area. Source: NASA Earth Observatory, Looking for Lawns, Nov 2005. Map published by the source, captured 21 Oct 2026.
How much household water is used outdoors?
- Outdoor use is 30% of household use nationally (EPA WaterSense, Aug 2026).
- In arid regions outdoor use can reach 60% of total household use (EPA WaterSense, Mar 2026).
- The average US household uses more water outdoors than for showering and washing clothes combined (EPA WaterSense, Jul 2026).
- About 60% of Southern Nevada’s water is used outdoors (SNWA, Oct 2026).
How big is the US lawn?
- NASA’s researcher estimated there are about three times more acres of lawn in the US than irrigated corn (NASA Earth Observatory, Nov 2005).
- Keeping every lawn in the lower 48 well watered would take 184 to 238 gallons per person per day (NASA Earth Observatory, Nov 2005).
- On a fixed 1 inch per week schedule, the NASA model showed Yuma, Arizona needing the full amount while Lincoln Park, Michigan needed no irrigation (NASA Earth Observatory, Nov 2005).
What do sprinkler systems, pools and hot tubs add?
- Homes with clock-timer irrigation systems use about 50% more water outdoors than homes without irrigation systems (EPA WaterSense, Mar 2026).
- Microirrigation can use 20% to 50% less water than conventional sprinkler systems (EPA WaterSense, May 2026).
- A pool cover can prevent up to 95% of pool water evaporation (EPA WaterSense, Mar 2026).
- 8.52 million US homes had a swimming pool in 2020 (EIA RECS, Mar 2023).
- 8.84 million US homes had a hot tub in 2020 (EIA RECS, Mar 2023).
- One skipped irrigation cycle can save 1,500 to 2,500 gallons, according to Tampa Bay Water (Tampa Bay Water, Oct 2026).
Household Water Use by State
Where a home sits changes its water use more than almost anything else. The dry Mountain West and the wet Northeast sit at opposite ends of the table.
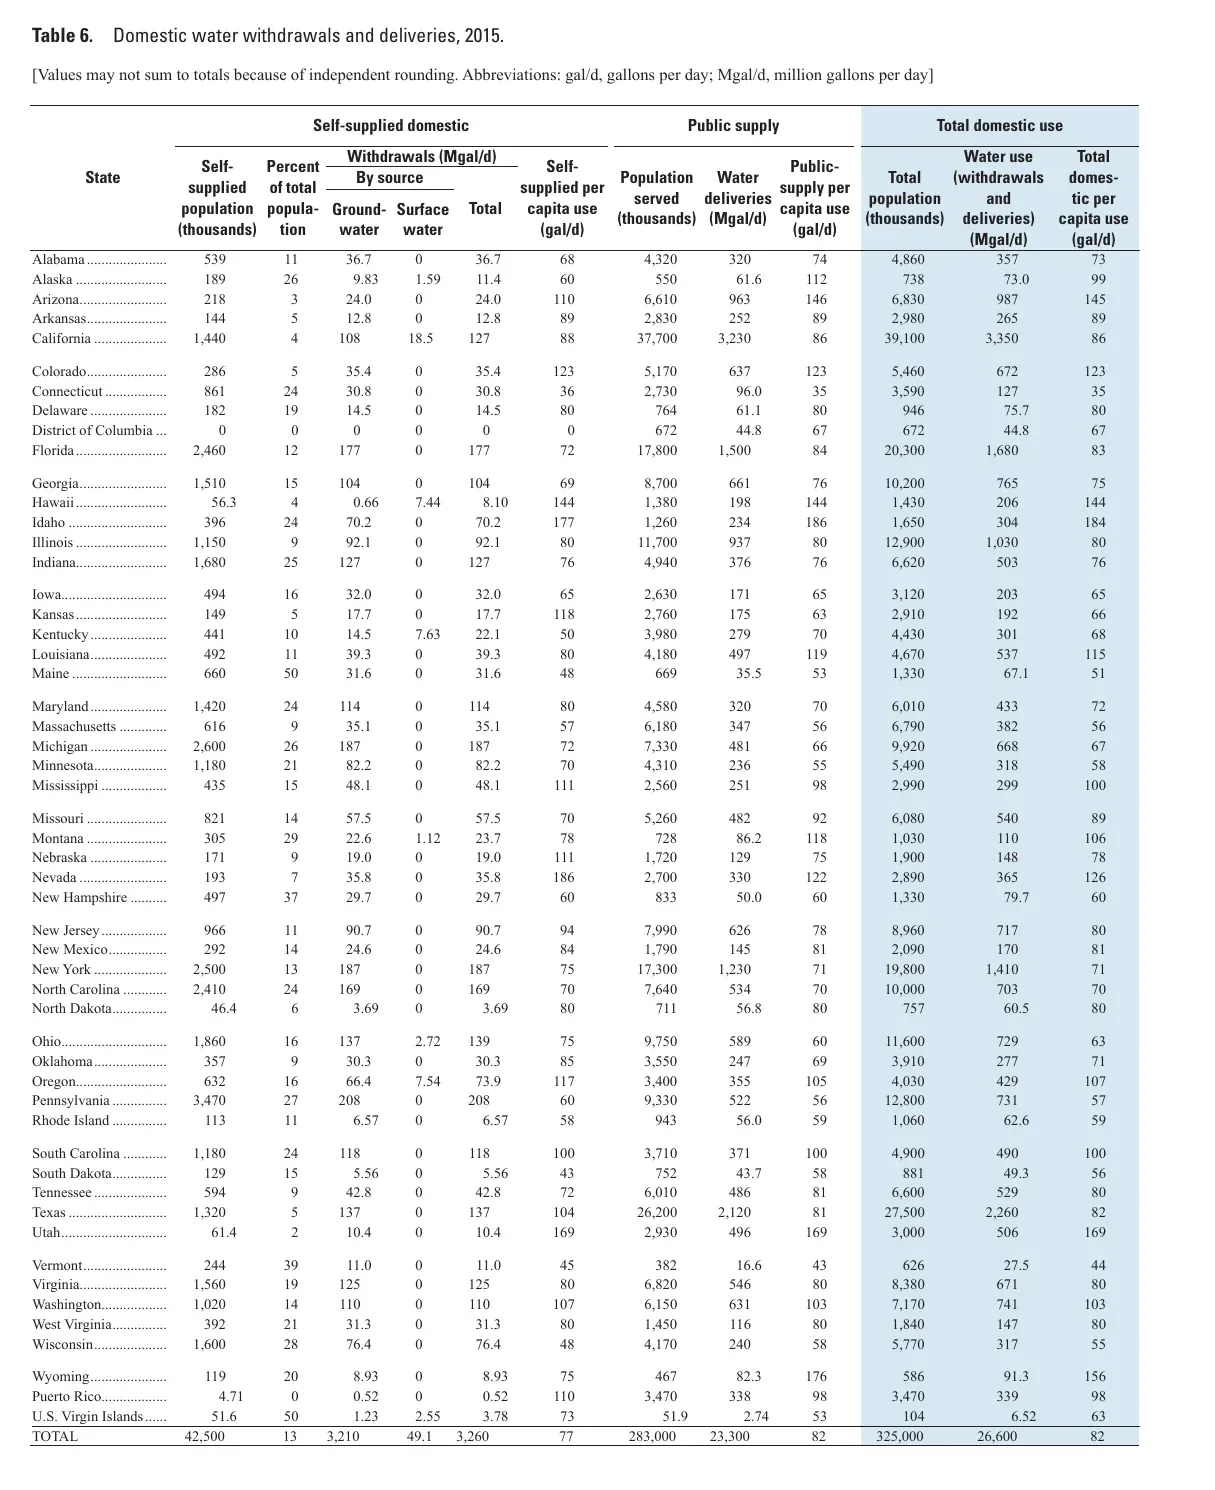 Figure 5: Total domestic use per person in 2015 ranged widely between states, from Connecticut at the low end to Idaho at the high end. Source: USGS, Estimated Use of Water in the United States in 2015, Table 6, Jun 2018. Screenshot of the source table, captured 21 Oct 2026.
Which states use the most water per person at home?
- Idaho had the highest total domestic use at 184 gallons per person per day (USGS Circular 1441, Jun 2018).
- Utah followed at 169 gallons per person per day (USGS Circular 1441, Jun 2018).
- Wyoming used 156 gallons per person per day (USGS Circular 1441, Jun 2018).
- Arizona used 145 gallons per person per day (USGS Circular 1441, Jun 2018).
- Self-supplied users in Nevada used the most of any state, 186 gallons per person per day (USGS Circular 1441, Jun 2018).
Which states use the least?
- Connecticut had the lowest total domestic use at 35 gallons per person per day (USGS Circular 1441, Jun 2018).
- Vermont used 44 gallons per person per day (USGS Circular 1441, Jun 2018).
- Wisconsin used 55 gallons per person per day (USGS Circular 1441, Jun 2018).
- USGS finds per-person use is lowest in the Northern and Eastern States and highest in the Mountain and Western States, where outdoor watering is more common (USGS Circular 1441, Jun 2018).
Which states use the most water in total?
- California used the most, 3,350 million gallons per day for domestic purposes (USGS Circular 1441, Jun 2018).
- Texas used 2,260 million gallons per day (USGS Circular 1441, Jun 2018).
- Florida used 1,680 million gallons per day (USGS Circular 1441, Jun 2018).
How did drought change use in California and Texas?
- California’s total domestic use fell 17% between 2010 and 2015, which was 91% of the national decrease (USGS Circular 1441, Jun 2018).
- Texas, also in drought in 2015, reported 2% less total domestic use than in 2010 (USGS Circular 1441, Jun 2018).
Where do homes rely on private wells?
- Pennsylvania had the largest self-supplied domestic population, 3.47 million people (USGS Circular 1441, Jun 2018).
- In Maine, 50% of the population had a self-supplied water source (USGS Circular 1441, Jun 2018).
Washers and Dishwashers in US Homes
Appliances are the second place efficiency standards show up in the data. Counting them shows how many homes still run older machines.
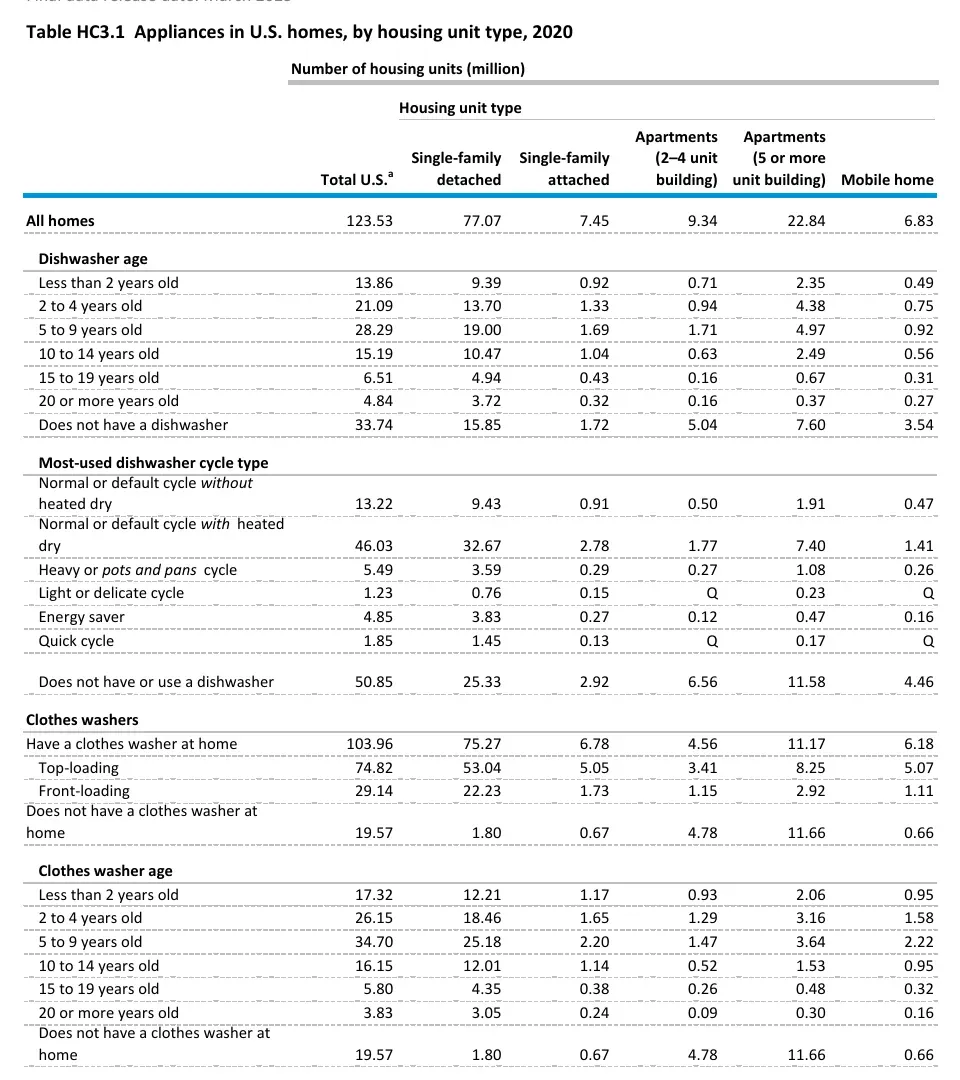 Figure 6: The age tables show how many dishwashers and clothes washers are still old enough to be replacement jobs. Source: EIA, Residential Energy Consumption Survey 2020, Table HC3.1, Mar 2023. Screenshot of the source table, captured 21 Oct 2026.
How many homes have a clothes washer or a dishwasher?
- 103.96 million US homes had a clothes washer at home in 2020 (EIA RECS, Mar 2023).
- 74.82 million of those washers were top-loading and 29.14 million were front-loading (EIA RECS, Mar 2023).
- 19.57 million homes had no clothes washer at home, and 11.66 million of those were in buildings with five or more units (EIA RECS, Mar 2023).
- 33.74 million homes had no dishwasher (EIA RECS, Mar 2023).
- 17.43 million renter-occupied homes had no dishwasher (EIA RECS, Mar 2023).
- 79.98 million owner-occupied homes had a clothes washer, against 23.98 million renter-occupied homes (EIA RECS, Mar 2023).
How old are the machines?
- 4.84 million dishwashers were 20 or more years old in 2020 (EIA RECS, Mar 2023).
- 3.83 million clothes washers were 20 or more years old (EIA RECS, Mar 2023).
- 13.86 million dishwashers and 17.32 million clothes washers were less than two years old (EIA RECS, Mar 2023).
How do households run them?
- 13.17 million homes ran a dishwasher seven or more times a week, while 17.11 million homes with a dishwasher ran it zero times a week (EIA RECS, Mar 2023).
- 70.32 million homes did one to four loads of laundry a week, and 0.88 million did more than 15 (EIA RECS, Mar 2023).
- Warm was the usual wash temperature in 53.11 million homes, cold in 42.13 million and hot in 8.72 million (EIA RECS, Mar 2023).
- The average American family washes about 300 loads of laundry each year (ENERGY STAR, Oct 2026).
What do efficient machines use?
- ENERGY STAR full-size clothes washers use 14 gallons of water per load, against 20 gallons for a standard machine (ENERGY STAR, Oct 2026).
- The federal limit for a standard-size dishwasher is 5.0 gallons per cycle, and 3.5 for a compact one (eCFR, Oct 2026).
- ENERGY STAR dishwashers must use 3.2 gallons or less per cycle (EPA WaterSense, May 2026).
- A standard-size ENERGY STAR dishwasher saves about 5,800 gallons of water over its lifetime (ENERGY STAR, Oct 2026).
Water Waste Statistics: Where Homes Lose Water
Most household waste is not dramatic. It is a sprinkler that sprays the street, a tap left running, a dishwasher run half full. Each one is small, and together they are large.
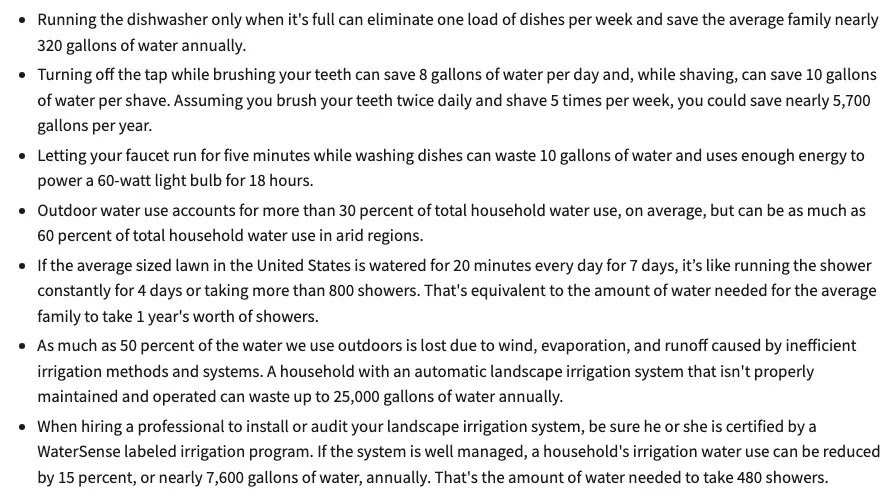 Figure 7: EPA’s own list pairs small indoor habits with much larger outdoor losses, which is why overwatering is the first place to look. Source: EPA WaterSense, Statistics and Facts, Mar 2026. Screenshot of the source page, captured 21 Oct 2026.
How much outdoor water is wasted?
- Cracked pipes and broken sprinkler heads can cost a home up to $280 in lost water over a six-month irrigation season (EPA WaterSense, Mar 2026).
- Watering the average-sized US lawn 20 minutes a day for 7 days is like taking more than 800 showers (EPA WaterSense, Mar 2026).
- A well-managed irrigation system can cut a household’s irrigation use by 15%, or nearly 7,600 gallons a year (EPA WaterSense, Mar 2026).
How much water do daily habits waste?
- Letting a faucet run for five minutes while washing dishes wastes 10 gallons (EPA WaterSense, Mar 2026).
- Turning off the tap while brushing teeth saves 8 gallons a day, and while shaving it saves 10 gallons per shave (EPA WaterSense, Mar 2026).
- Running the dishwasher only when it is full saves the average family nearly 320 gallons a year (EPA WaterSense, Mar 2026).
- Washing dishes in a new ENERGY STAR dishwasher instead of by hand can cut utility bills by about $220 a year (ENERGY STAR, Oct 2026).
What do water waste rules look like?
- Southern Nevada water providers can charge waste fees from $40 up to $5,000 for repeat violations (SNWA, Oct 2026).
- Using sprinklers from 11 a.m. to 7 p.m. between May 1 and August 31 counts as water waste in Southern Nevada (SNWA, Oct 2026).
- Failing to repair an irrigation or supply-line malfunction within 48 hours counts as water waste there (SNWA, Oct 2026).
Water Conservation Statistics: What Efficient Products Save
Efficiency programs now have a long record. The numbers below show what the label has saved in total and what one family can expect from each swap.
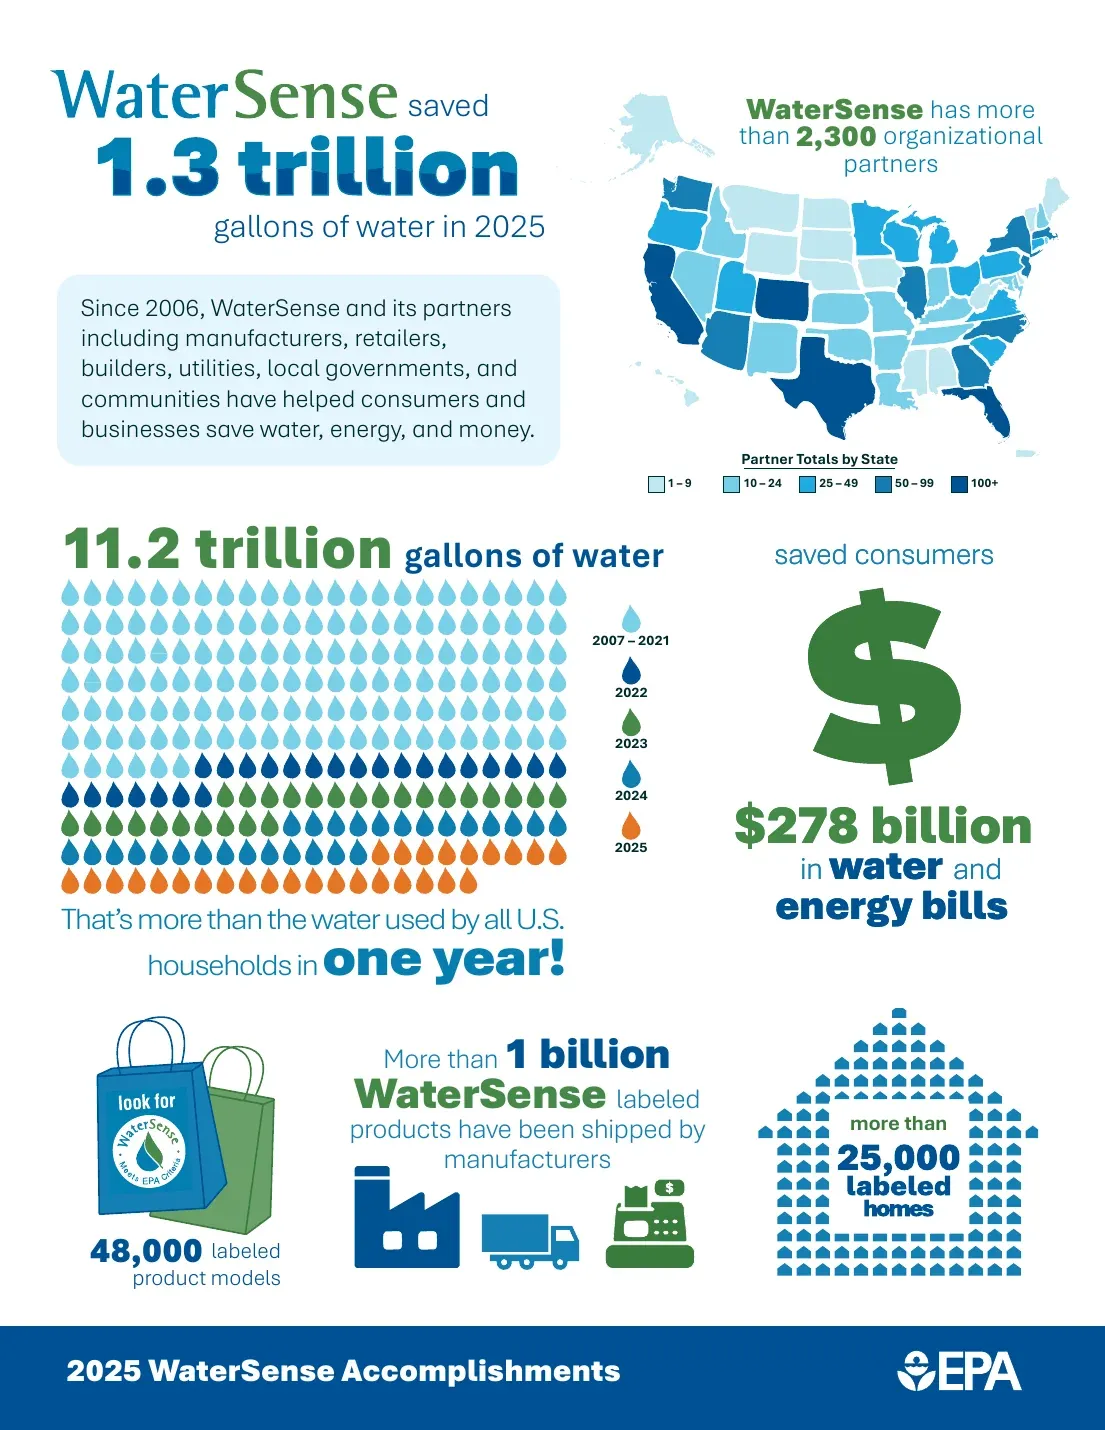 Figure 8: WaterSense reports 1.3 trillion gallons saved in 2025 alone, on top of the totals from earlier years. Source: EPA WaterSense, 2025 WaterSense Accomplishments, Sep 2026. Page of the source’s own infographic, captured 21 Oct 2026.
How much has the WaterSense program saved?
- WaterSense and its partners saved consumers $278 billion in water and energy bills through 2025 (EPA WaterSense, Sep 2026).
- The program saved 1.3 trillion gallons of water in 2025 alone (EPA WaterSense, Sep 2026).
- 48,000 labeled product models are on the market (EPA WaterSense, Sep 2026).
- Manufacturers have shipped more than 1 billion WaterSense labeled products (EPA WaterSense, Sep 2026).
- More than 25,000 WaterSense labeled homes have been certified (EPA WaterSense, Sep 2026).
What can one family save?
- The average family can save more than $380 a year by retrofitting with WaterSense labeled fixtures and ENERGY STAR certified appliances (EPA WaterSense, Mar 2026).
- Replacing old toilets with labeled models cuts toilet water use by 20% to 60%, which is nearly 13,000 gallons a year (EPA WaterSense, May 2026).
- Replacing showerheads with labeled models saves the average family 2,700 gallons a year (EPA WaterSense, Mar 2026).
- Replacing old bathroom faucets and aerators saves the average family 700 gallons a year (EPA WaterSense, Jun 2026).
- A bathroom remodel with labeled fixtures can save nearly 10,000 gallons a year (EPA WaterSense, Mar 2026).
- That main-bathroom makeover can pay for itself in as little as one year (EPA WaterSense, Mar 2026).
- Swapping a clock-based irrigation controller for a labeled one can cut an average home’s irrigation water use by up to 30% (EPA WaterSense, Mar 2026).
- That swap can save an average home up to 15,000 gallons a year (EPA WaterSense, Mar 2026).
- A WaterSense labeled home saves a family an average of 50,000 gallons of water or more a year (EPA WaterSense, May 2026).
- Labeled homes must be at least 30% more water-efficient than typical new construction (EPA WaterSense, Jun 2026).
What would wider adoption save?
- If every US home installed labeled showerheads, the country would save more than 260 billion gallons and $2.9 billion in water bills a year (EPA WaterSense, Mar 2026).
- Replacing every old toilet with a labeled model would save more than 260 billion gallons a year, about what flows over Niagara Falls in five days (EPA WaterSense, May 2026).
- Labeled faucets and aerators in every home would save 71 billion gallons of water and nearly $1.6 billion in water and energy costs a year (EPA WaterSense, Jun 2026).
- If one in ten homes upgraded a full bathroom, the country would save about 93 billion gallons a year (EPA WaterSense, Mar 2026).
- If every home with an automatic sprinkler system ran a labeled controller, the country would save up to 390 billion gallons and $4.5 billion in water costs a year (EPA WaterSense, Mar 2026).
- Kennesaw State University saved more than 650,000 gallons in six months after switching dorm showerheads to labeled models (EPA WaterSense, Nov 2025).
- San Antonio Water System says its programs and rebates have saved customers more than 1 trillion gallons (San Antonio Water System, Oct 2026).
Water Prices and Household Water Bills
People use fewer gallons, but each gallon costs more. Water prices have climbed faster than prices in general.
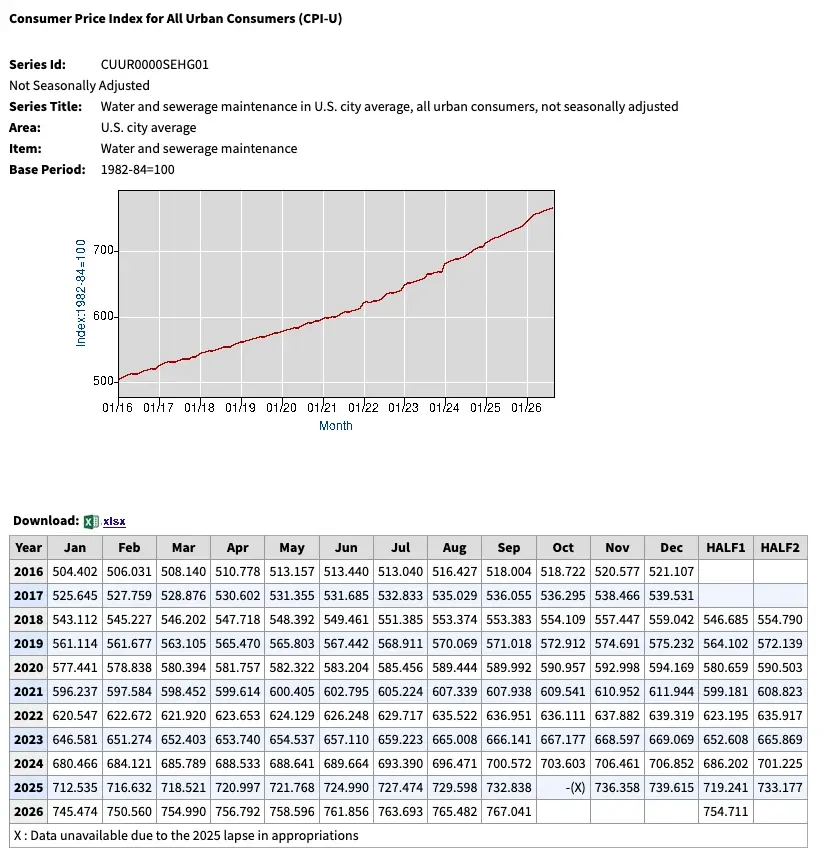 Figure 9: The water and sewerage price index climbed in a nearly straight line over ten years. Source: Bureau of Labor Statistics, CPI series CUUR0000SEHG01, Oct 2026. Screenshot of the source page, captured 21 Oct 2026.
What do water and sewer service cost per 1,000 gallons?
- EPA’s 2024 estimate for average residential water service was $7.74 per 1,000 gallons (EPA WaterSense, Feb 2026).
- Average residential wastewater service was $9.09 per 1,000 gallons (EPA WaterSense, Feb 2026).
- Commercial customers paid $13.36 per 1,000 gallons combined (EPA WaterSense, Feb 2026).
How fast are water prices rising?
- The water and sewerage maintenance index rose 4.7% from September 2025 to September 2026, calculated from published readings of 732.838 and 767.041 (BLS CPI, Oct 2026).
- The all-items CPI rose 3.7% over the same year, calculated from readings of 324.800 and 336.940 (BLS CPI, Oct 2026).
- The all-items index rose about 42% from January 2016 to September 2026, calculated from readings of 236.916 and 336.940, against the larger rise in the water index shown in the figure (BLS CPI, Oct 2026).
- BLS published no October 2025 reading because of a lapse in appropriations (BLS CPI, Oct 2026).
Is this a long-run trend?
- Berkeley Lab researchers found that water and wastewater prices in their sample of utilities rose consistently between 2000 and 2014 and have outpaced CPI growth since 2006 (Berkeley Lab, Oct 2017).
- The same paper called water and wastewater treatment and delivery the most capital-intensive of all utility services (Berkeley Lab, Oct 2017).
Conservation Rules, Rebates and Local Programs
Rules now reach into the house. States set per-person targets, cities pay for turf removal, and some water agencies train and vouch for plumbers. Southern Nevada is the clearest example, and its numbers moved the wrong way this year.
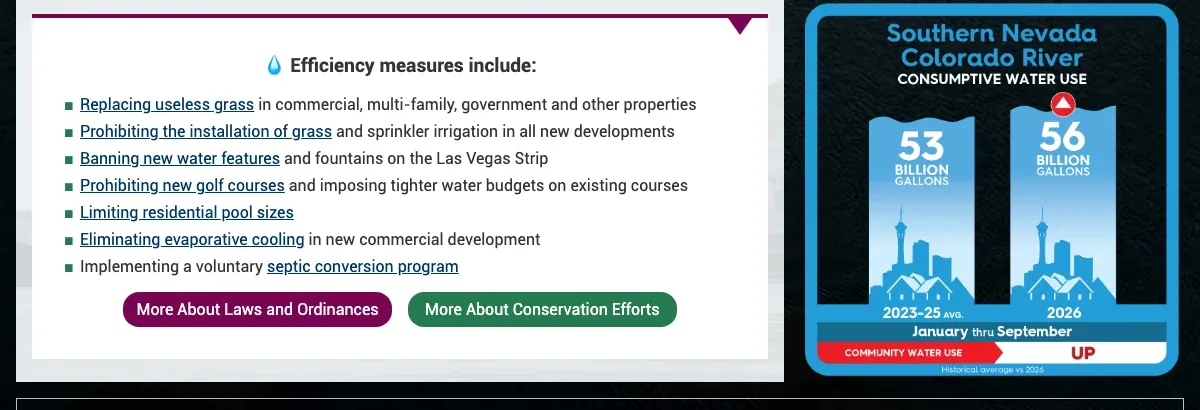 Figure 10: Even after a 58% cut in per-person use, community water use in Southern Nevada ran above its recent average in the first nine months of 2026. Source: Southern Nevada Water Authority home page, Oct 2026. Screenshot of the source page, captured 21 Oct 2026.
What has Southern Nevada done?
- Southern Nevada’s Colorado River consumptive use was 56 billion gallons from January through September 2026, against a 53 billion gallon average for 2023 to 2025 (SNWA, Oct 2026).
- Lake Mead has dropped approximately 160 feet since 2000 (SNWA, Oct 2026).
- A 2021 Nevada law bars Colorado River water delivered by Water Authority member agencies from irrigating nonfunctional grass at business, multi-family and government properties starting in 2027, but it does not apply to single-family yards (SNWA, Oct 2026).
- About 1,000 acres of nonfunctional turf remain at residential properties, mostly front-yard grass (SNWA, Oct 2026).
- SNWA pays residential customers $5 per square foot of grass replaced, plus a $100 bonus for every new tree (SNWA, Oct 2026).
What do plumbers have to do with local programs?
- To join the Water Smart Plumber program, contractors must complete at least six hours of SNWA water-efficiency training and two hours of refresher training each year (SNWA, Oct 2026).
- Program plumbers must give a written bid based on an hourly rate, not a flat project rate (SNWA, Oct 2026).
- SNWA offers a leak detection voucher of up to $250 toward diagnostic services or the first two hours of repair work (SNWA, Oct 2026).
What do states require?
- California law set the indoor residential standard at 55 gallons per person per day until January 1, 2025, then 47 until 2030 (California Water Code, Jan 2023).
- From January 1, 2030 the California indoor standard falls to 42 gallons per person per day (California Water Code, Jan 2023).
- California’s supplier-level urban water use objectives took effect January 1, 2025, and apply to utilities, not to individual households (California State Water Board, Jan 2025).
- Texas’s 2022 State Water Plan counts on 1,026,000 acre-feet of supply from conservation and rainwater harvesting by 2070, which is 13.4% of all recommended strategies (Texas Water Development Board, Oct 2026).
- Municipal conservation makes up 977,000 acre-feet of that, or 12.7% of recommended strategies (Texas Water Development Board, Oct 2026).
Water Supply Worries and the Outlook
Water saved at home matters because supply is the open question. State managers and the public both expect trouble.
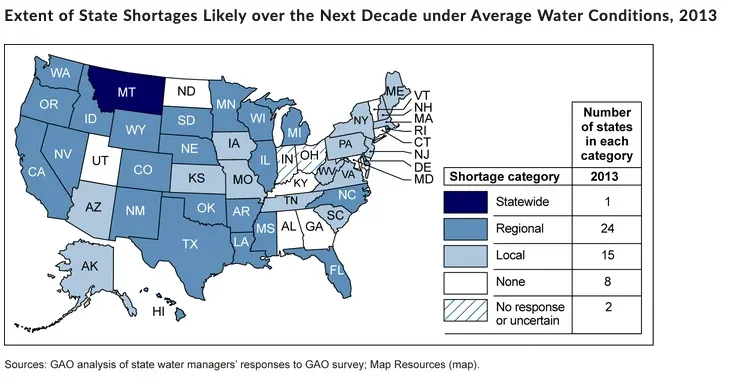 Figure 11: Only 8 states told GAO they expected no shortage in any part of the state under average conditions, while 24 expected regional shortages. Source: GAO, Freshwater: Supply Concerns Continue, and Uncertainties Complicate Planning (GAO-14-430), May 2014. Chart published by the source, captured 21 Oct 2026.
What do state water managers expect?
- 24 states expected regional shortages, 15 expected local shortages and 1 expected a statewide shortage (GAO, May 2014).
- GAO found that concerns about population growth straining supplies stayed largely unchanged since 2003, while the effects of climate change and extreme weather gained prominence (GAO, May 2014).
Why is supply limited?
- Less than 1% of the Earth’s water is available for human use (EPA WaterSense, Aug 2026).
What does the public think?
- A further 26% of Americans worry a fair amount about the supply of fresh water for household needs (Gallup, Mar 2026).
- The share worried a great deal was 46% when Gallup last asked in March 2011 (Gallup, Mar 2011).
Methodology and Sources
Every statistic comes from the agency, regulator, research body or utility that produced it, and every number was read from the source page or file during October 2026. Aggregators and roundups are not used. Where a source page carries no publication date, the citation shows the month it was read. Three figures marked as calculated were worked out by this page from published readings, and the readings are shown beside them. EPA pages give slightly different dollar savings for the same retrofit in places, so this page uses one page per measure. The page is reviewed and refreshed monthly.
Glossary
- Self-supplied: water a household draws itself, usually from a private well.
- Public supply: water delivered to homes by a city, county or private water company.
- Domestic use: water used for indoor and outdoor household purposes.
- psi: pounds per square inch, the unit for water pressure.
- WaterSense: the EPA label for products and homes that use at least 20% less water than standard models.
- ENERGY STAR: the EPA and Department of Energy label for efficient appliances.
- CPI: the Consumer Price Index from the Bureau of Labor Statistics.
- RECS: the Residential Energy Consumption Survey from the Energy Information Administration.
- USGS, EPA, DOE, GAO, BLS, EIA: the US Geological Survey, Environmental Protection Agency, Department of Energy, Government Accountability Office, Bureau of Labor Statistics and Energy Information Administration.
- WRF and SNWA: the Water Research Foundation and the Southern Nevada Water Authority.
Sources
- USGS, Estimated Use of Water in the United States in 2015 (Circular 1441)
- Water Research Foundation, Landmark Update to Residential End Use Study (news release)
- EPA WaterSense, Showerheads
- NASA Earth Observatory, Looking for Lawns
- EPA WaterSense, Statistics and Facts
- EPA WaterSense, Accomplishments and History
- Bureau of Labor Statistics, CPI Water and Sewerage Maintenance (CUUR0000SEHG01)
- EPA WaterSense, Data and Information Used by WaterSense
- EIA, Residential Energy Consumption Survey 2020, Table HC3.1
- Southern Nevada Water Authority, home page
- Gallup, Environment (In Depth: Topics A to Z)
- GAO, Freshwater: Supply Concerns Continue, and Uncertainties Complicate Planning (GAO-14-430)
- EPA WaterSense, How We Use Water
- EPA WaterSense, Start Saving
- Census Bureau, New Estimates on America’s Families and Living Arrangements
- Water Research Foundation, Residential End Uses of Water, Version 3 (project 5242)
- EPA WaterSense, Residential Toilets
- EIA, Residential Energy Consumption Survey 2020, Table HC2.1
- eCFR, 10 CFR 430.32 Energy and water conservation standards
- Federal Register, Repeal of the Definition of Showerhead (DOE)
- Federal Register, Executive Order 14264, Maintaining Acceptable Water Pressure in Showerheads
- EPA WaterSense, Bathroom Faucets
- EPA WaterSense, Outdoors
- Southern Nevada Water Authority, Water Waste
- EPA WaterSense, Sprinkler Spruce-Up
- EPA WaterSense, Other Water-Efficient Products
- EPA WaterSense, Pool Water Efficiency
- Tampa Bay Water, home page
- EIA, Residential Energy Consumption Survey 2020, Table HC3.2
- ENERGY STAR, Clothes Washers
- ENERGY STAR, Dishwashers
- EPA WaterSense, 2025 WaterSense Accomplishments (PDF)
- EPA WaterSense, Your Better Bathroom
- EPA WaterSense, WaterSense Labeled Irrigation Controllers
- EPA WaterSense, Homes
- EPA WaterSense, The WaterSense Label
- EPA WaterSense, Shower Better
- San Antonio Water System, Conservation
- Bureau of Labor Statistics, CPI All Items (CUUR0000SA0)
- Berkeley Lab, Keeping Pace with Water and Wastewater Rates
- Southern Nevada Water Authority, Laws and Ordinances
- Southern Nevada Water Authority, Find a Water Smart Plumber
- Southern Nevada Water Authority, Find and Fix Leaks
- California Water Code, Section 10609.4
- California State Water Board, Making Conservation a California Way of Life
- Texas Water Development Board, Water Conservation