Toilet paper usage statistics are easy to ask for and hard to find. Governments count the tonnes of household paper a country makes and ships. Almost nobody counts sheets per person, so the best per-person figures come from dividing tonnes by population or from a brand’s own claim. This page labels which is which.
It covers who makes the paper and what it costs, what it takes from forests, how far bidet seats have spread, and where toilets and drains fail. The data comes from the UN, the US Census Bureau, company filings, a Japanese Cabinet Office survey, peer-reviewed studies and plumbing test labs.
If you run a plumbing shop, the last two sections are for you. A stopped-up toilet is part of the job for most plumbing shops, and the paper going into the drain has been tested more than most people expect.
Updated October 2026. We refresh the page every month.
Key Takeaways
- World production of household and sanitary paper reached 40 million tonnes in 2024, up 6% from 2020. (FAO, Global Forest Products Facts and Figures 2024, Dec 2025)
- The average person in the US gets through about 21.6 kg of household and sanitary paper a year, against a world average of about 4.9 kg (our calculation). (FAO FAOSTAT, Apr 2026)
- US sanitary paper product factories shipped $14.1 billion of goods in 2022 from 135 plants. (Census Bureau, 2022 Economic Census, Dec 2024)
- The US imported 230.2 million kg of toilet paper worth $509.7 million in 2024. (UN Comtrade, Oct 2026)
- US toilet paper imports jumped to 290.7 million kg in 2020 from 194.0 million kg in 2019. (UN Comtrade, Oct 2026)
- Charmin holds more than 25% of the North American toilet paper market and Bounty nearly 40% of paper towels. (Procter & Gamble, 10-K, Aug 2026)
- Toilet paper made from 100% forest fiber has nearly double the climate impact of toilet paper made from 100% recycled content. (NRDC, Issue with Tissue Seventh Edition, Dec 2025)
- 82.5% of Japanese households with two or more people own a warm-water bidet toilet seat. (Cabinet Office of Japan, Apr 2026)
- 3.4 billion people still lacked safely managed sanitation in 2024, and 354 million practised open defecation. (WHO/UNICEF JMP, Aug 2025)
- About 1.76 million US homes had every toilet out of order for six hours or more at least once in a 3-month window (our calculation). (Census Bureau, American Housing Survey 2023, Jan 2025)
- In a 135-foot test drain, weak single-ply paper alone travelled three times as far as strong double-ply paper. (PERC, Phase One Report, Nov 2012)
- Roto-Rooter booked $231.8 million of drain cleaning revenue in 2025, and 4.5% fewer drain jobs than in 2024. (Chemed, 10-K, Feb 2026)
How Much Toilet Paper Does Each Person Go Through?
Nobody measures this at the till or the toilet, so every answer is an estimate. The sturdiest one divides tonnes by people. It puts the US at the top of the large producers, level with Italy and well above Japan, Germany and China.
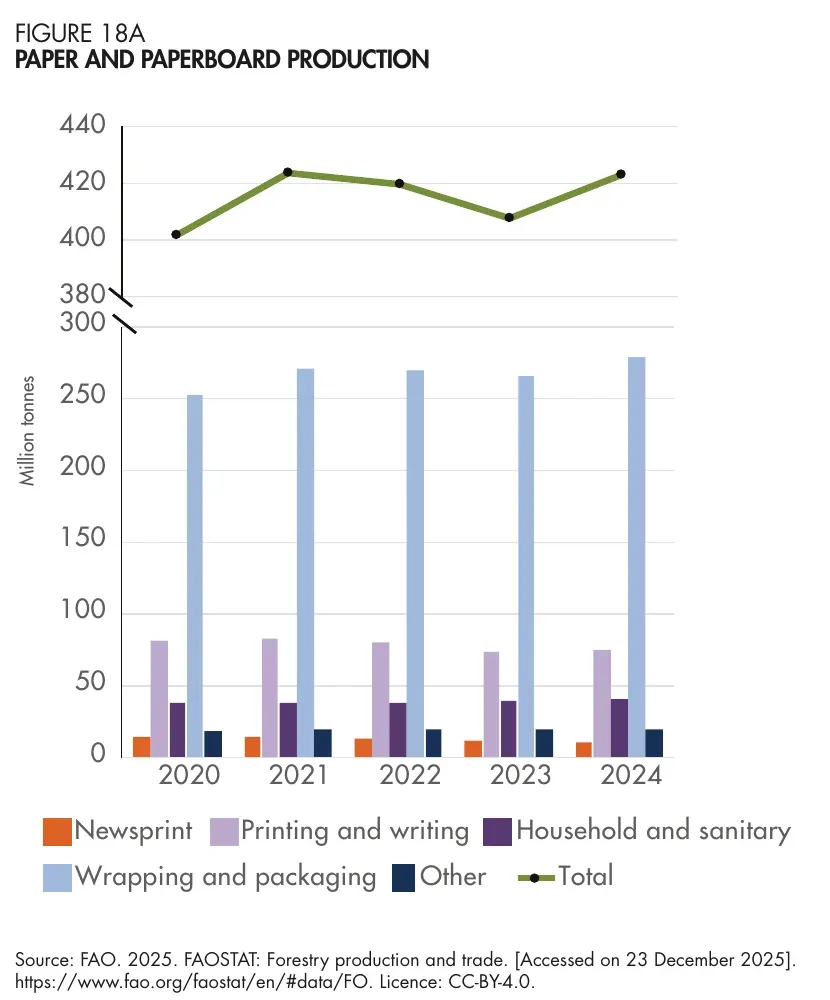 Figure 1: Household and sanitary paper, the group that holds toilet paper, is small beside packaging paper by weight, yet it grew 6% between 2020 and 2024. Source: FAO, Global Forest Products Facts and Figures 2024, Figure 18A, Dec 2025. Chart published by the source, cropped from the PDF page, captured 21 Oct 2026.
How much paper is made per person around the world?
The UN’s food and agriculture body counts household and sanitary paper by country. That group covers toilet paper, towels, tissues and napkins, so each figure here is an upper limit for toilet paper alone. The per-person numbers add imports and take away exports, then divide by population. They are our calculation from the two sources named in each line.
- Household and sanitary paper was 9% of all paper and paperboard made worldwide in 2024 (FAO, Global Forest Products Facts and Figures 2024, Dec 2025).
- Output was 20.8 million tonnes in 2000, which means it roughly doubled in 24 years (FAO FAOSTAT, Apr 2026).
- The world average is about 4.9 kg of household and sanitary paper per person, using 40.2 million tonnes made in 2024 and a population of 8.14 billion (World Bank, Oct 2026).
- The US is about 21.6 kg per person: 7.14 million tonnes made, 428 thousand imported, 211 thousand exported, and 340 million people (FAO FAOSTAT, Apr 2026).
- Italy is close behind at about 21.8 kg, and Spain is about 18.1 kg (FAO FAOSTAT, Apr 2026).
- Germany is about 17.3 kg and Japan about 15.1 kg (FAO FAOSTAT, Apr 2026).
- Mexico is about 10.1 kg, China about 8.7 kg and Brazil about 6.5 kg (FAO FAOSTAT, Apr 2026).
- Italy is a large exporter, which is why its figure is lower than its output suggests: it sent 389 thousand tonnes abroad in 2024 (FAO FAOSTAT, Apr 2026).
Which countries make the most?
China leads by a wide margin, the US is second, and every other country is far behind.
- China made 12.6 million tonnes in 2024 (FAO FAOSTAT, Apr 2026).
- The US made 7.14 million tonnes in 2024, up from 6.27 million in 2000 (FAO FAOSTAT, Apr 2026).
- Japan made 1.87 million tonnes and Italy 1.63 million (FAO FAOSTAT, Apr 2026).
- Brazil made 1.43 million tonnes, Germany 1.37 million and Mexico 1.32 million (FAO FAOSTAT, Apr 2026).
What do the brands say one person uses?
Kimberly-Clark’s Cottonelle site gives the only sheet counts we could find from a named company. It does not publish how it got them, so treat them as marketing figures.
- Cottonelle says the average person uses nearly 7 sheets per wipe (Kimberly-Clark Cottonelle, Jun 2025).
- It puts a year of use at about 85 rolls of 150 sheets, or nearly 13,000 sheets (Kimberly-Clark Cottonelle, Jun 2025).
- It says the average household flushes around 80,000 sheets a year (Kimberly-Clark Cottonelle, Jun 2025).
Who Makes and Ships Toilet Paper in the US?
The US makes almost all of its own household paper, yet it still buys a large amount of toilet paper abroad. Canada is the top supplier by a clear margin.
 Figure 2: The US customs record for toilet paper imports, which shows both the weight and the dollar value for the year. Source: UN Comtrade, US imports of HS 481810 toilet paper, 2024 data retrieved Oct 2026. Screenshot of the source page, captured 21 Oct 2026.
How big is the US sanitary paper industry?
The Census Bureau’s industry code covers facial tissue, napkins, toilet paper and towels, and it also covers disposable diapers and sanitary napkins. Read it as the whole converted-tissue sector, not toilet paper alone.
- The industry had 100 firms and 135 establishments in 2022 (Census Bureau, 2022 Economic Census, Dec 2024).
- It employed 18,442 people and paid $1.23 billion in wages and salaries (Census Bureau, 2022 Economic Census, Dec 2024).
- It spent $7.72 billion on materials and supplies and added $6.50 billion in value (Census Bureau, 2022 Economic Census, Dec 2024).
- Factories invested $656.6 million in buildings and equipment and bought $172.1 million of electricity (Census Bureau, 2022 Economic Census, Dec 2024).
- Wisconsin is the biggest state, with 24 establishments and $2.92 billion in shipments (Census Bureau, 2022 Economic Census, Dec 2024).
- Texas had 8 establishments and $1.41 billion, and Pennsylvania had 15 and $1.38 billion (Census Bureau, 2022 Economic Census, Dec 2024).
Where does imported toilet paper come from?
Customs data gives a clean split by country of origin for 2024.
- Canada supplied 112.8 million kg worth $328.2 million (UN Comtrade, Oct 2026).
- Mexico supplied 43.1 million kg (UN Comtrade, Oct 2026).
- China supplied 33.0 million kg (UN Comtrade, Oct 2026).
- Indonesia supplied 20.8 million kg (UN Comtrade, Oct 2026).
- Vietnam supplied 10.1 million kg (UN Comtrade, Oct 2026).
How have imports and exports moved?
Imports dipped after the 2020 spike, then rose again. Exports have held near 70 million kg.
- Imports were 192.9 million kg in 2021 (UN Comtrade, Oct 2026).
- They fell to 163.8 million kg in 2022 (UN Comtrade, Oct 2026).
- They recovered to 186.3 million kg in 2023 (UN Comtrade, Oct 2026).
- Exports were 72.2 million kg in 2023 (UN Comtrade, Oct 2026).
- Exports were 68.8 million kg worth $220.0 million in 2024, so imports ran at more than three times exports by weight (UN Comtrade, Oct 2026).
What Do Prices, Brands and Shortages Say About Demand?
Toilet paper is a steady product with a few big sellers. The 2020 shortage showed how fast demand can swing when people stay home, and how little the factory price moved when it did.
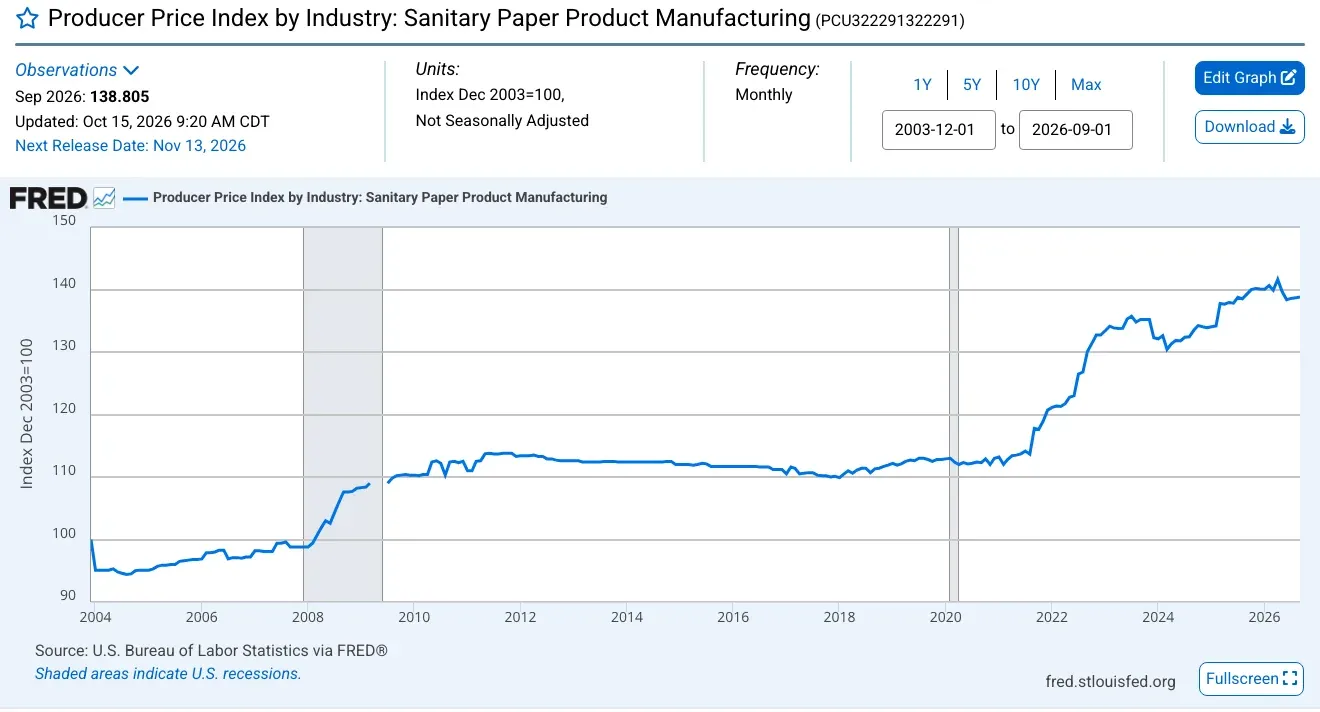 Figure 3: Factory prices for sanitary paper stayed flat for a decade, did not react to the March 2020 buying frenzy, and then climbed through 2021 and 2022. Source: U.S. Bureau of Labor Statistics, Producer Price Index by Industry: Sanitary Paper Product Manufacturing, retrieved from FRED, Oct 2026. Screenshot of the source page, captured 21 Oct 2026.
How much have factory prices moved?
The index sets December 2003 at 100. It measures what producers charge, not what shoppers pay.
- The index stood at 138.8 in September 2026 (U.S. Bureau of Labor Statistics via FRED, Oct 2026).
- It peaked at 141.6 in April 2026 (U.S. Bureau of Labor Statistics via FRED, Oct 2026).
- It was 112.8 in December 2019, 112.4 in March 2020 and 113.0 in December 2020 (U.S. Bureau of Labor Statistics via FRED, Oct 2026).
- It reached 120.7 in December 2021 and 132.7 in December 2022 (U.S. Bureau of Labor Statistics via FRED, Oct 2026).
Who sells the most?
Two companies show up in every filing. A third big maker of private-label rolls sold its tissue plants in 2024.
- Procter & Gamble’s Family Care business, which sells Charmin, Bounty and Puffs, was 8% of net sales in fiscal 2026, down from 9% in fiscal 2025 (Procter & Gamble, 10-K, Aug 2026).
- P&G calls Family Care a business that is predominantly North American (Procter & Gamble, 10-K, Aug 2026).
- Family Care sales fell by a low single-digit percentage in fiscal 2026, on lower pricing and lower unit volume, and North America’s share of the category fell 0.7 points (Procter & Gamble, 10-K, Aug 2026).
- Kimberly-Clark’s Family Care sales were $4.06 billion in 2025, $3.93 billion in 2024 and $4.02 billion in 2023 (Kimberly-Clark, 10-K, Feb 2026).
- Kimberly-Clark says it faces more pressure from private-label makers in Family Care, because store brands sell at lower prices (Kimberly-Clark, 10-K, Feb 2026).
- Walmart bought about 16% of Kimberly-Clark’s net sales in 2025 and 2024 (Kimberly-Clark, 10-K, Feb 2026).
- Suzano agreed to buy 51% of Kimberly-Clark’s international family care and professional business for about $1.7 billion (Kimberly-Clark, 10-K, Feb 2026).
- Clearwater Paper sold its private-label tissue business to Sofidel America for $1.06 billion in cash, before adjustments, on November 1, 2024 (Clearwater Paper, 10-K, Feb 2025).
- That business had net sales of $1.02 billion in 2023 and $870 million in its last ten months (Clearwater Paper, 10-K, Feb 2025).
- In 2023 its retail tissue volumes rose because shoppers moved from branded to private-label rolls (Clearwater Paper, 10-K, Feb 2025).
What happened to demand in the 2020 shortage?
Home use rose, away-from-home use fell, and stockpiling added to the swing.
- Kimberly-Clark’s consumer tissue sales rose to $6.72 billion in 2020 from $5.99 billion in 2019, and its operating profit rose 44% (Kimberly-Clark, 10-K, Feb 2021).
- In North America its consumer sales rose 17% on 14% higher volume, which it linked to the pandemic and working from home (Kimberly-Clark, 10-K, Feb 2021).
- Its professional business, which sells to workplaces, saw North American volume fall 10% (Kimberly-Clark, 10-K, Feb 2021).
- Kimberly-Clark said demand rose most in March 2020, as people built up home stocks, and then eased as they used them (Kimberly-Clark, 10-K, Feb 2021).
- A survey of 996 people in 22 countries found that those who felt more threatened by Covid-19 stockpiled more toilet paper (PLOS ONE, Jun 2020).
- In the same survey, Americans stockpiled more than Europeans and shopped less often, which the authors tie to larger packs in the US, up to 36 rolls against 8 to 16 in Europe (PLOS ONE, Jun 2020).
What Does Toilet Paper Cost Forests and the Climate?
The fight is about fibre. Environmental groups say too much toilet paper comes from natural forest, and the industry says it uses leftovers from lumber and a lot of recycled paper. Both sides publish numbers, and both are attributed here.
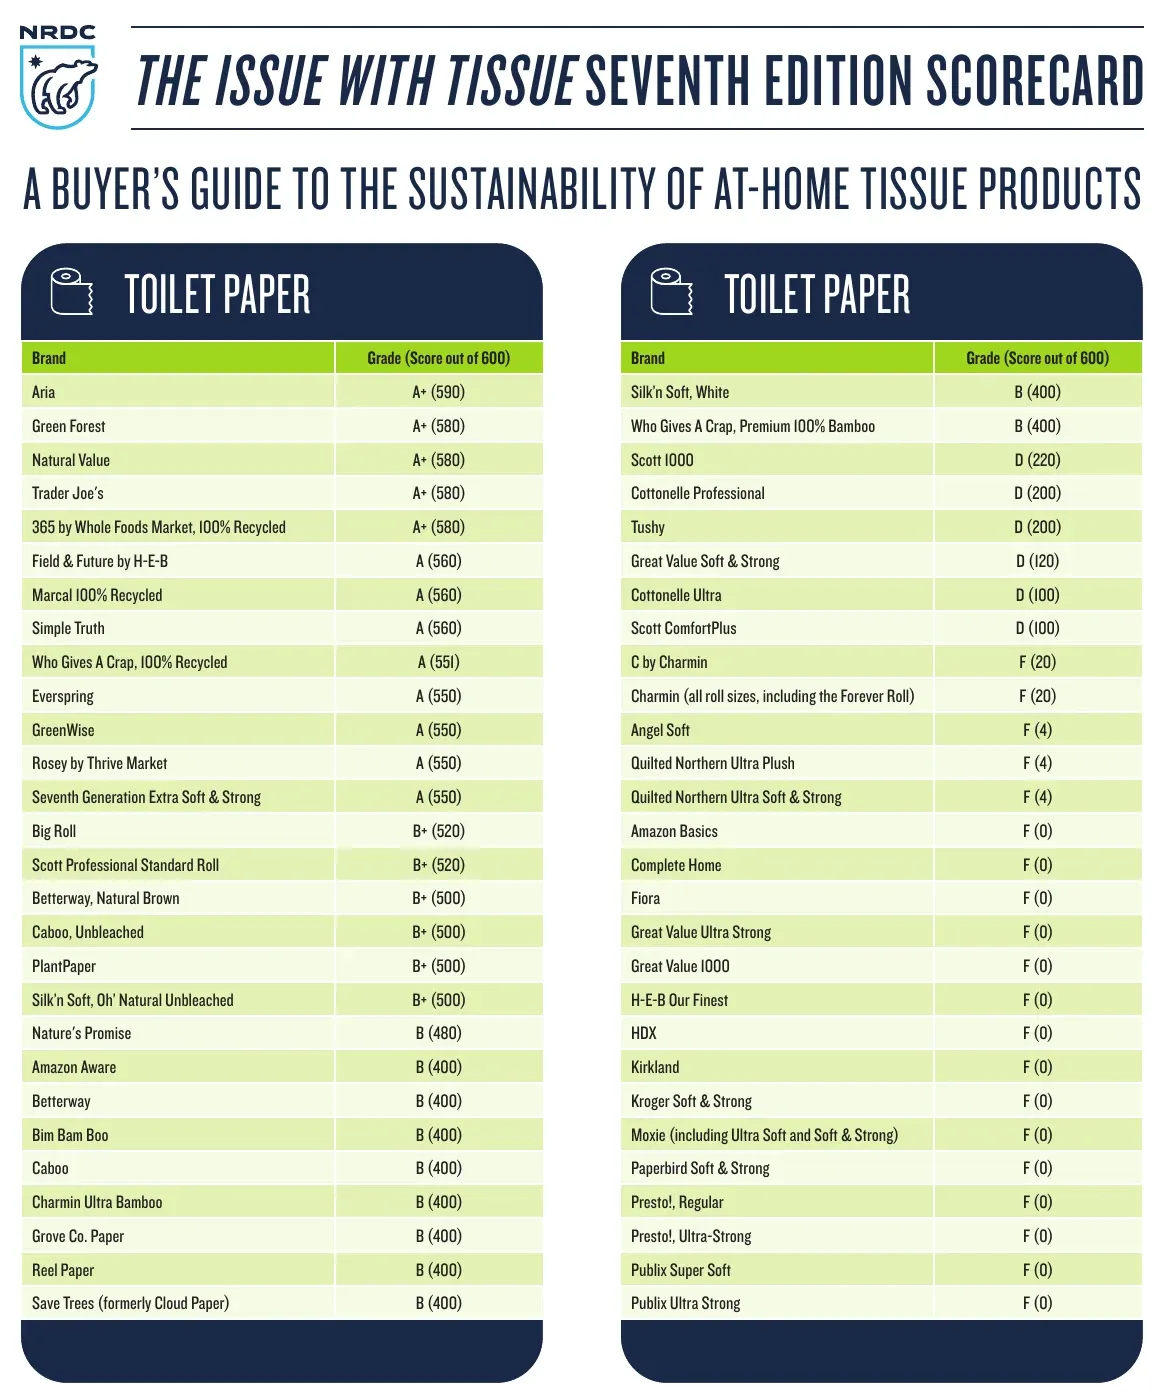 Figure 4: NRDC grades dozens of toilet paper brands on one page, and the biggest national brands sit at the bottom while recycled-content brands take the top. Source: NRDC, The Issue with Tissue Seventh Edition Scorecard, Dec 2025. Screenshot of the source PDF page, captured 21 Oct 2026.
How big is the gap between forest fibre and recycled paper?
These are NRDC’s figures, and NRDC is an advocacy group. Its scorecard methodology is public.
- If every American swapped one forest-fibre roll for a recycled-content roll, NRDC says it would save more than 1 billion gallons of water and 1.6 million trees (NRDC, Issue with Tissue Seventh Edition, Dec 2025).
- It adds nearly 800 million pounds of avoided climate pollution, the same as taking more than 72,000 cars off the road for a year (NRDC, Issue with Tissue Seventh Edition, Dec 2025).
- For paper towels and facial tissue, forest fibre has more than two and a half times the climate impact and uses about 90% more water (NRDC, Issue with Tissue Seventh Edition, Dec 2025).
- Using the Environmental Paper Network calculator, NRDC puts one short ton of forest-fibre tissue pulp at 23,800 pounds of greenhouse gas and 40,700 gallons of water (NRDC, Issue with Tissue Sixth Edition, Sep 2024).
- The same calculator gives 7,370 pounds of greenhouse gas and 21,400 gallons of water for recycled pulp (NRDC, Issue with Tissue Sixth Edition, Sep 2024).
- NRDC puts the water to make one 0.33-pound forest-fibre roll at 6.1 gallons (NRDC, Issue with Tissue Sixth Edition, Sep 2024).
What does a peer-reviewed life cycle study find?
A North Carolina State University team measured premium and ultra bath tissue made in the United States, from forest to finished roll.
- One metric ton of eucalyptus pulp carried 388 kg of carbon dioxide equivalent (BioResources, Apr 2023).
- One metric ton of northern softwood pulp carried 448 to 596 kg, depending on how emissions are shared (BioResources, Apr 2023).
- One finished metric ton of tissue carried 1,392 to 3,075 kg, depending on mill location, power source and machine (BioResources, Apr 2023).
- These two pulps made up 62% of the total fibre furnish for hygiene tissue, according to Fisher International data the authors cite (BioResources, Apr 2023).
- The authors note that northern softwood chips are a by-product of sawmill operations, which is the industry’s main defence (BioResources, Apr 2023).
What does the industry say?
The American Forest and Paper Association speaks for the US paper industry, so these are industry claims.
- AF&PA says 90% of US tissue manufacturers use recycled paper (AF&PA, Oct 2026).
- It says tissue producers used about 3.7 million tons of recycled paper in 2025 (AF&PA, Aug 2024).
- It says using only recycled paper for all US paper products would use up the supply in about 7 months (AF&PA, Aug 2024).
- It says one third of the US is forested, nearly 766 million acres (AF&PA, Oct 2026).
- It says more than 1 billion trees are planted in the US each year (AF&PA, Aug 2024).
What is happening in the Canadian boreal forest?
Much of the northern softwood pulp in American tissue comes from Canada. NRDC ties its campaign to that region.
- More than 28 million acres of Canadian boreal forest were logged between 1996 and 2015, and more than 90% of it by clearcutting (NRDC, The Issue with Tissue, Feb 2019).
- The boreal holds at least 12% of the world’s carbon stores in its plants and soils (NRDC, The Issue with Tissue, Feb 2019).
- NRDC says the Canadian boreal removes carbon dioxide equal to the yearly emissions of 24 million passenger vehicles (NRDC, The Issue with Tissue, Feb 2019).
- In Ontario, an average of 44% of pulp comes from whole logs rather than scraps, according to NRDC’s estimate based on Stand Research Group data (NRDC, hemp, bidets and bamboo fact sheet, Sep 2019).
How do the big brands score?
NRDC grades each brand out of 600 points.
- Charmin, in all roll sizes, scored F (20 points), and Angel Soft and Quilted Northern scored F (4 points) (NRDC, Issue with Tissue Seventh Edition, Dec 2025).
- Charmin Ultra Bamboo scored B (400), the first P&G brand to leave the F grade (NRDC, The Issue with Tissue, Dec 2025).
- Cottonelle Ultra and Scott ComfortPlus scored D (100 points each) (NRDC, Issue with Tissue Seventh Edition, Dec 2025).
- Aria, which Georgia-Pacific relaunched as 100% recycled in 2024, scored A+ (590 points) (NRDC, The Issue with Tissue, Dec 2025).
- Kimberly-Clark became the first major US tissue maker to set firm commitments against deforestation in 2024 (NRDC, The Issue with Tissue, Dec 2025).
- The sixth edition scored 145 products: 16 got A+, 22 got A, 28 got B or B+, and 79 got D or F (NRDC, Issue with Tissue Sixth Edition, Sep 2024).
Bidet Toilet Paper Usage Reduction Statistics: Who Owns a Bidet Seat?
Japan is the one large country that counts bidet seats, and four in five homes there have one. The US has no equivalent count that we could open, and nobody has published a measured saving in paper per person.
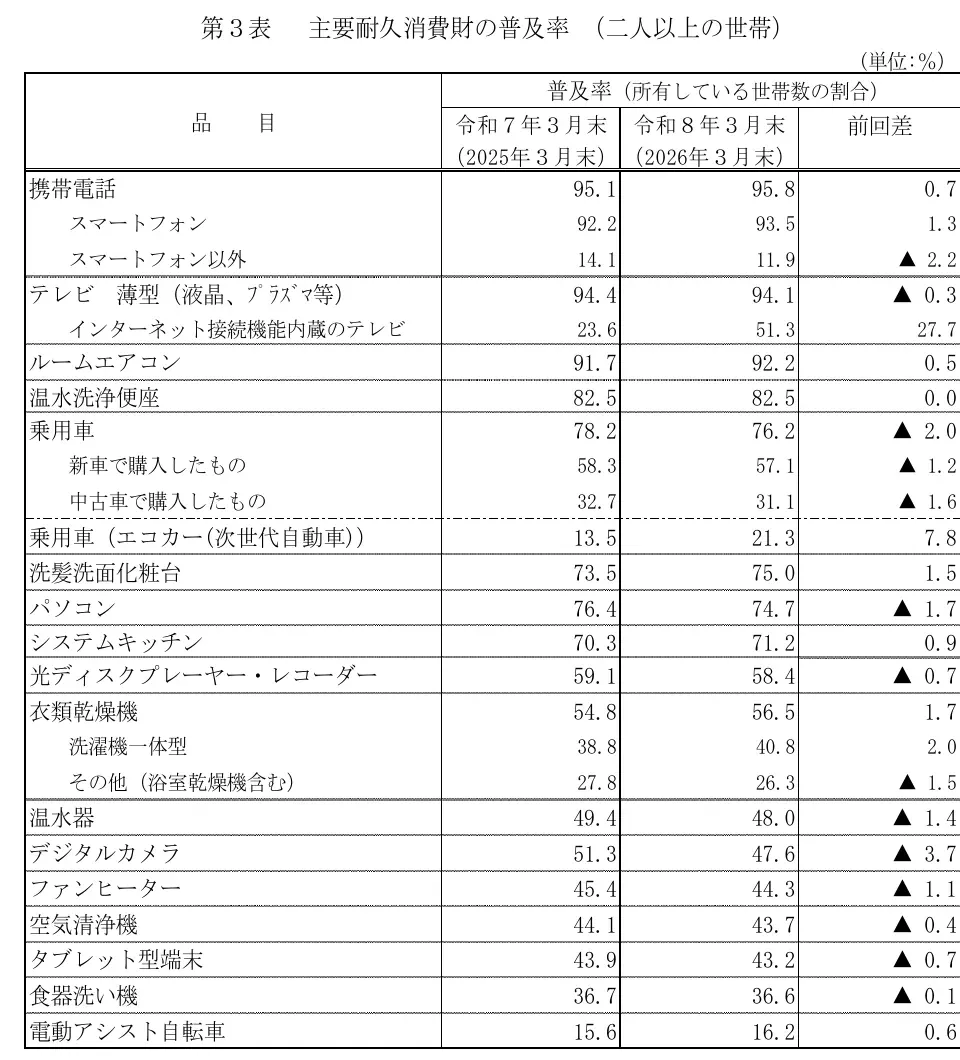 Figure 5: The Cabinet Office’s yearly survey lists warm-water cleaning toilet seats (the row after room air conditioners) at 82.5% of households of two or more people, level with the year before. Source: Cabinet Office of Japan, Consumer Confidence Survey March 2026, Table 3, Apr 2026. Screenshot of the source PDF page, captured 21 Oct 2026.
How common are bidet seats in Japanese homes?
Ownership has stopped rising because it is already near saturation.
- Households owned 117.4 warm-water toilet seats per 100 households in March 2026, so many homes have more than one (Cabinet Office of Japan, Apr 2026).
- The count was 117.7 per 100 households in 2025 and 116.3 in 2024 (Cabinet Office of Japan, Apr 2025).
- Household ownership was 82.0% in March 2024, so it rose half a point and then held (Cabinet Office of Japan, Apr 2025).
- In a survey of 4,963 people in one Japanese city, 55% used a bidet before or after using the toilet, and more than 80% said they had one at home (Environmental Health and Preventive Medicine, Oct 2016).
- At least 30% of those users also washed before using the toilet, partly to help a bowel movement (Environmental Health and Preventive Medicine, Oct 2016).
- That survey drew on patients, students and employees in one city, many of them medical staff, so it does not stand for all of Japan (Environmental Health and Preventive Medicine, Oct 2016).
Do bidets reduce how much paper people use?
The sources we could open do not measure it. The only figure comes from bidet makers, as relayed by NRDC.
- NRDC reports that bidet makers claim a bidet cuts toilet paper use by around 75% on average (NRDC, Issue with Tissue Sixth Edition, Sep 2024).
- NRDC puts the water for the paper at about 0.29 gallons per toilet visit, from 6.1 gallons per roll and 21 visits per roll (NRDC, Issue with Tissue Sixth Edition, Sep 2024).
- Bidet makers put their water use at one eighth to one sixth of a gallon per use, which is 0.13 to 0.17 gallons (NRDC, Issue with Tissue Sixth Edition, Sep 2024).
- In a test with 32 nursing students, volunteers used four layers of toilet paper to wipe even when a bidet was available (Journal of Water and Health, Jan 2022).
- Microbe counts on gloves averaged 39,499 colony-forming units without a bidet and 4,147 with one (Journal of Water and Health, Jan 2022).
Are there health findings that matter to buyers?
Customers ask about this, so here is the largest follow-up study we found.
- A web survey followed 7,637 people in Japan over a year and found that habitual bidet use did not cause hemorrhoids or most urogenital infections (Preventive Medicine Reports, Feb 2017).
- The one exception was bacterial vaginitis, where the adjusted odds ratio was 2.662, but the authors call it inconclusive because the cases were few (Preventive Medicine Reports, Feb 2017).
Toilet Statistics: How Many People and Homes Have a Working Toilet?
Worldwide, billions of people still lack a toilet that safely contains waste. In the US the picture is the reverse: nearly everyone has one, and the questions are how many a home has and how often they fail.
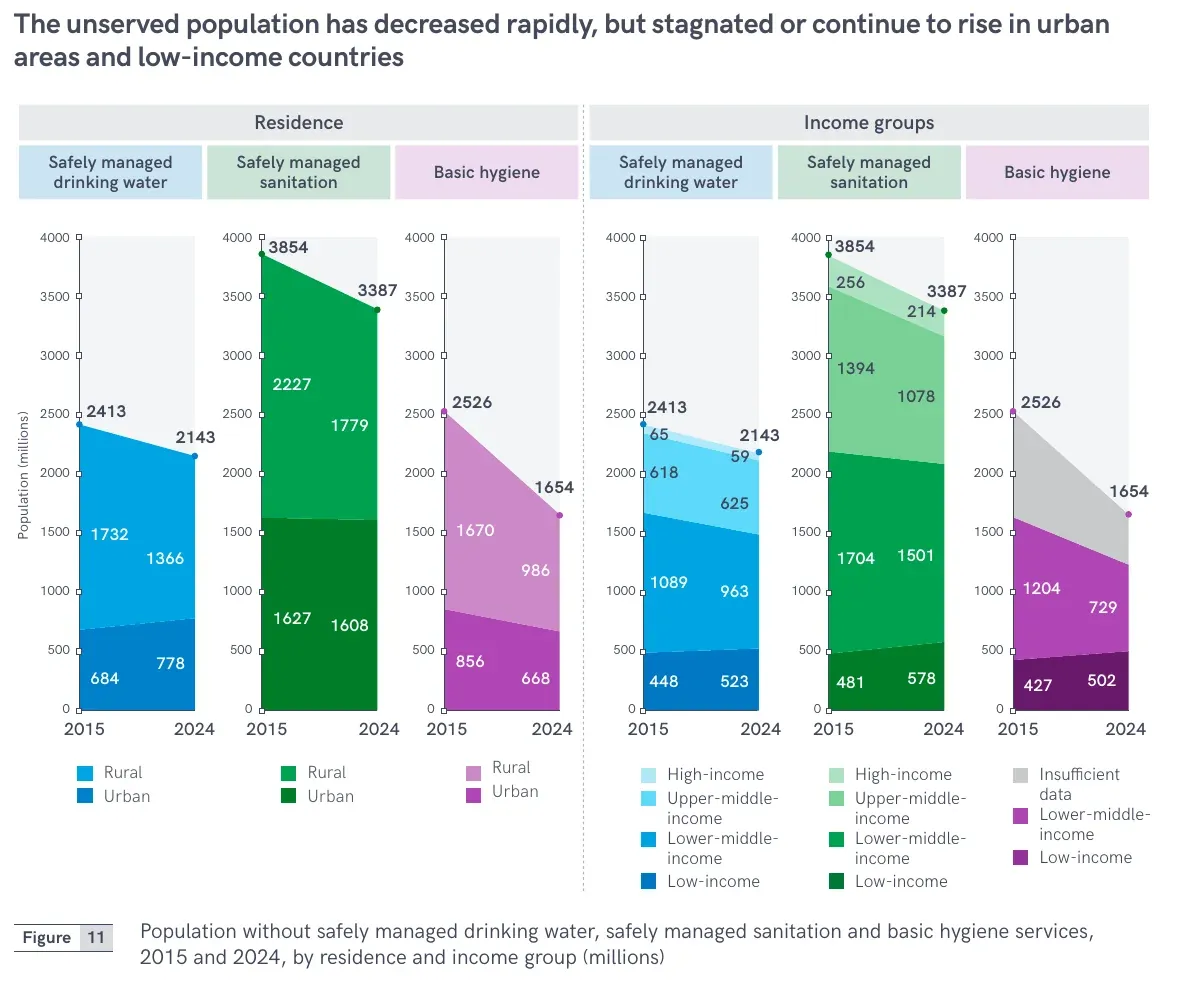 Figure 6: The number of people without a safely managed toilet fell by under half a billion in nine years, and it rose in low-income countries. Source: WHO/UNICEF Joint Monitoring Programme, Progress on household drinking water, sanitation and hygiene 2000-2024, Figure 11, Aug 2025. Chart published by the source, cropped from the PDF page, captured 21 Oct 2026.
How many people lack a safely managed toilet?
The count is the 3.4 billion in the takeaways, and the report breaks it down by service level. Global shares and the gains since 2015 are on the water consumption statistics page.
- Of those 3.4 billion, 1.9 billion had a basic service, 560 million a limited one and 555 million an unimproved one (WHO/UNICEF JMP, Aug 2025).
- The number practising open defecation fell by 429 million between 2015 and 2024 (WHO/UNICEF JMP, Aug 2025).
- Open defecation has been eliminated in urban areas, where it is under 1% (WHO/UNICEF JMP, Aug 2025).
- 1,779 million rural residents and 1,608 million urban residents lacked safely managed sanitation in 2024 (WHO/UNICEF JMP, Aug 2025).
- Low-income countries had 578 million people without it, up from 481 million in 2015 (WHO/UNICEF JMP, Aug 2025).
- 64 countries had already reached basic sanitation for more than 99% of people, and 9 had reached safely managed services for more than 99% (WHO/UNICEF JMP, Aug 2025).
- 611 million people had no handwashing facility at all, among 1.7 billion without basic hygiene services (WHO/UNICEF JMP, Aug 2025).
How many bathrooms do US homes have?
Counts come from the Census Bureau’s public microdata for the 2023 American Housing Survey. The figures below are our weighted calculation of the occupied homes in that file, which total 133.1 million.
- 40.3 million occupied homes, 30.3%, have one full bathroom (Census Bureau, American Housing Survey 2023, Jan 2025).
- 42.6 million homes, 32.0%, have two full bathrooms (Census Bureau, American Housing Survey 2023, Jan 2025).
- 13.9 million have one and a half and 18.2 million have two and a half (Census Bureau, American Housing Survey 2023, Jan 2025).
- 14.9 million have three full bathrooms and 3.2 million have more than three (Census Bureau, American Housing Survey 2023, Jan 2025).
- 58.0% of rented homes have a single full bathroom, against 15.9% of owner-occupied homes (Census Bureau, American Housing Survey 2023, Jan 2025).
How often do all the toilets in a home go down?
The survey asks whether every toilet in the home was broken, stopped up or otherwise not working at the same time in the past three months. About 2.3 million homes said yes, a figure the water usage statistics page already reports. The rest of the answers are below.
- 3.07% of renter households said yes, against 1.02% of owner households (Census Bureau, American Housing Survey 2023, Jan 2025).
- Another 522 thousand homes had every toilet down at least once, but never for as long as six hours (Census Bureau, American Housing Survey 2023, Jan 2025).
- About 179 thousand homes had it happen eight or more times in three months (Census Bureau, American Housing Survey 2023, Jan 2025).
How many toilets and bidets does the US import?
Customs codes group toilet bowls, bidets, sinks and urinals. The numbers cover all of them, so they overstate toilets alone.
- The US imported 38.4 million porcelain sanitary fixtures worth $1.56 billion in 2024 (UN Comtrade, Oct 2026).
- Imports were 25.3 million items worth $903.4 million in 2020 (UN Comtrade, Oct 2026).
- Plastic toilet seats and covers came to 31.3 million kg and $210.0 million in 2024 (UN Comtrade, Oct 2026).
Why Do Toilets Clog, and What Do Plumbers Fix?
Most clogs come down to two things: how well the paper breaks up in water, and whether the drain has enough water and slope to carry it. Flush volume matters less than people think, until it gets very low. For plumber pay, demand and licensing, see the plumbing statistics page, and for the wider trade see the plumbing industry statistics pillar. Wipes, towels and grease are covered on the wet wipes and sewer blockages page, and flush volumes and toilet leaks are on the water usage and water leak pages.
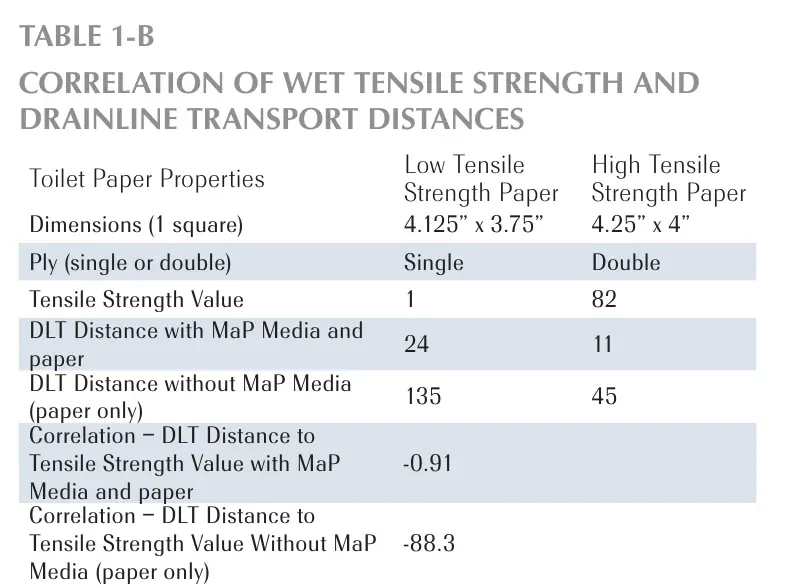 Figure 7: In a long test drain, the paper that is weak when wet travelled furthest, and the paper that is strong when wet stopped sooner and is the likelier clog. Source: Plumbing Efficiency Research Coalition, Phase One Report, Table 1-B, Nov 2012. Screenshot of the source PDF page, captured 21 Oct 2026.
Does the kind of paper change how far it travels in a drain?
Yes, and by a lot. The coalition built a 135-foot pipe with two bends and flushed 100 times per run.
- The weak paper failed after 1 washer in the wet strength test, while the strong paper held 82 (Plumbing Efficiency Research Coalition, Nov 2012).
- Paper alone travelled 135 for the weak single-ply and 45 for the strong double-ply, in the report’s distance units (Plumbing Efficiency Research Coalition, Nov 2012).
- With soybean paste added to the paper, the distances were 24 and 11 (Plumbing Efficiency Research Coalition, Nov 2012).
- The tests used 48 sheets of the single-ply and 24 of the double-ply to match the amount of paper (Plumbing Efficiency Research Coalition, Nov 2012).
- Pipe slope, paper and flush volume all had a significant effect, while percent trailing water and flush rate did not (Plumbing Efficiency Research Coalition, Nov 2012).
- At 0.8 gallons per flush, waste compressed into plugs in 5 of 16 runs, while 1.28 and 1.6 gallon flushes moved waste in an orderly way (Plumbing Efficiency Research Coalition, Nov 2012).
- The coalition suggests a simple wet strength test for buildings with chronic drain blockages, to find a replacement paper that is weaker when wet (Plumbing Efficiency Research Coalition, Nov 2012).
How well do store-bought rolls break up?
A Turkish study tested 12 brands in water at pH 6 to 9.
- Three of the 12 samples disintegrated poorly and six disintegrated to a medium degree (BioResources, Jul 2019).
- Wet strength polymers added to make thin sheets hold together lowered softness and made the fibres harder to separate (BioResources, Jul 2019).
- Sewer officials and drain contractors said city residential lines were mostly clogged with toilet paper, paper towels and synthetic wipes (BioResources, Jul 2019).
- A life cycle study notes that toilet paper is one of the main insoluble pollutants in the water reaching treatment plants, and that its fibres add to sludge and treatment cost (Environmental Science and Pollution Research, Jun 2023).
How are toilets tested for flushing paper?
North America ranks toilets by how much waste and paper they clear in one flush.
- The Maximum Performance (MaP) program began in 2002 with funding from 22 organizations in Canada and the US (MaP Testing, Dec 2025).
- It tests with soybean paste and toilet paper, adding more until the toilet fails (MaP Testing, Dec 2025).
- More than 5,000 toilet models have been tested since 2003 (MaP Testing, Dec 2025).
- WaterSense and the ASME and CSA standard pass or fail a model at 350 grams, while MaP tests up to 1,000 grams (MaP Testing, Dec 2025).
- In the 1980s most toilets flushed with 3.5 gallons or more (MaP Testing, Dec 2025).
How much drain work do plumbers book?
Roto-Rooter reports revenue by service line in its parent company’s annual filing, so it gives a rough picture of the call mix.
- Drain cleaning revenue was $237.5 million in 2024, so 2025 was a 2.4% decline (Chemed, 10-K, Feb 2026).
- Price and service mix added 2.1% to drain cleaning revenue, which partly offset the lower job count (Chemed, 10-K, Feb 2026).
- Plumbing revenue rose 0.7% to $182.7 million, with a 3.6% rise in jobs and a 2.9% drop in price and mix (Chemed, 10-K, Feb 2026).
- Excavation revenue was $238.4 million and water restoration revenue was $190.2 million (Chemed, 10-K, Feb 2026).
- Chemed says excavation and water restoration jobs are generally sold from first calls about drain cleaning (Chemed, 10-K, Feb 2026).
- Roto-Rooter’s gross revenue was $937.9 million and its net revenue $899.9 million (Chemed, 10-K, Feb 2026).
- Chemed says competition for skilled employees, particularly licensed plumbers, is intense (Chemed, 10-K, Feb 2026).
Methodology and Sources
Every statistic comes from the body that produced it: a UN agency, a statistics bureau, a company filing, a journal article, a government survey or a test lab. Where a figure is an advocacy group’s, an industry group’s or a company’s own claim, the text says so. Calculations are marked as ours and use only the sources named beside them. We left out per-person roll counts that trace back to a statistics portal rather than a primary study, and we found no open source that measures sheets per visit or paper saved by a bidet. Dates are the month the source was published or, for live databases, the month we read it. The page is refreshed monthly.
Glossary
- AF&PA: American Forest and Paper Association, the US paper industry’s trade group.
- AHS: American Housing Survey, run by the Census Bureau for HUD.
- BEK and NBSK: bleached eucalyptus kraft pulp and northern bleached softwood kraft pulp, the two main virgin pulps in toilet paper.
- HS code: the customs code for a traded product. Toilet paper is HS 481810.
- JMP: the WHO/UNICEF Joint Monitoring Programme for water, sanitation and hygiene.
- MaP: Maximum Performance, a toilet flush test that uses soybean paste and toilet paper.
- NAICS: the North American Industry Classification System used by the Census Bureau.
- PERC: Plumbing Efficiency Research Coalition, a group of plumbing industry bodies that ran a drain carry study.
- Safely managed sanitation: a toilet not shared with other households, from which waste is safely contained or treated.
Sources
- FAO, Global Forest Products Facts and Figures 2024
- FAO, FAOSTAT Forestry Production and Trade
- World Bank, Population, total
- UN Comtrade Database, US imports and exports of HS 481810, 691010 and 392220
- Census Bureau, 2022 Economic Census, Manufacturing (EC2231BASIC)
- Census Bureau and HUD, American Housing Survey 2023 national public use file
- U.S. Bureau of Labor Statistics via FRED, Producer Price Index by Industry: Sanitary Paper Product Manufacturing
- Procter & Gamble, Form 10-K for fiscal 2026
- Kimberly-Clark, Form 10-K for 2025
- Kimberly-Clark, Form 10-K for 2020
- Clearwater Paper, Form 10-K for 2024
- Chemed, Form 10-K for 2025
- Kimberly-Clark Cottonelle, How Much Toilet Paper Should a Person Use
- NRDC, The Issue with Tissue
- NRDC, The Issue with Tissue Seventh Edition Scorecard
- NRDC, The Issue with Tissue Sixth Edition Scorecard
- NRDC, The Issue with Tissue: How Americans Are Flushing Forests Down the Toilet
- NRDC, On Hemp, Bidets and Bamboo fact sheet
- AF&PA, Tissue
- AF&PA, Are Toilet Paper and Paper Towels Sustainable?
- BioResources, Environmental life cycle assessment of premium and ultra hygiene tissue products in the United States
- BioResources, Effect of toilet tissue paper on residential sewerage-line clogging
- Environmental Science and Pollution Research, Removal of toilet paper fibers from residential wastewater: a life cycle assessment
- PLOS ONE, Influence of perceived threat of Covid-19 and HEXACO personality traits on toilet paper stockpiling
- Journal of Water and Health, Microbial contamination of hands with or without the use of bidet toilets
- Environmental Health and Preventive Medicine, Survey of electric bidet toilet use among community dwelling Japanese people
- Preventive Medicine Reports, Bidet toilet use and incidence of hemorrhoids or urogenital infections
- Cabinet Office of Japan, Consumer Confidence Survey March 2026
- Cabinet Office of Japan, Consumer Confidence Survey March 2025
- WHO/UNICEF JMP, Progress on household drinking water, sanitation and hygiene 2000-2024
- MaP Testing, Background
- Plumbing Efficiency Research Coalition, Phase One Report: Drainline Transport of Solid Waste in Buildings