Water main break statistics are rougher than most people expect. No agency counts every break in the country, so each national figure is an estimate built from utility surveys, city reports and a few peer-reviewed studies. This page uses the best of them and says where they disagree.
It covers how often mains break, which pipes fail first, how old the pipe is, when breaks cluster, what they cost, how much water leaks out, why boil-water advisories follow and who pays to replace the pipe. The numbers come from the utilities and researchers who produced them: Utah State University, ASCE, EPA, AWWA, CDC, and the water systems in New York, Washington, Detroit, Denver and Pittsburgh.
For a plumbing shop, a main break is a street problem that turns into a customer problem fast. The utility owns the pipe under the road, and the shop gets the call about low pressure, air in the lines and a property-line argument. Every figure below is dated and linked to the page or file it came from. Updated October 2026.
For related numbers, see household water leaks, drinking water systems and lead pipes, frozen pipes and the plumbing industry.
Key Takeaways
- The US and Canada see about 260,000 water main breaks a year, which Utah State University prices at about $2.6 billion in repairs at an assumed $10,000 per break (Utah State University Water Research Laboratory, Dec 2023).
- The 2023 break rate was 11.1 breaks per 100 miles of pipe per year, down 20% from 14.0 in 2018 (Utah State University Water Research Laboratory, Dec 2023).
- Cast iron mains broke at 28.6 breaks per 100 miles a year. PVC mains broke at 2.9 (Utah State University Water Research Laboratory, Dec 2023).
- The average main that fails is 53 years old (Utah State University Water Research Laboratory, Dec 2023).
- WSSC Water in Maryland repairs nearly 1,800 water main breaks and leaks in a typical year, and 63% of them fall between November and February (WSSC Water, Dec 2025).
- New York City logged 618 water main breaks in fiscal 2026, or 8.7 per 100 miles, among the highest figures the city has recorded (NYC DEP, Mayor’s Management Report, Sep 2026).
- WSSC Water’s emergency repair bill rose from $17 million for 1,566 breaks and leaks in fiscal 2023 to $33 million for 2,259 in fiscal 2025 (WSSC Water, Dec 2025).
- EPA says the average water system loses 16% of its water to leaks and other losses, and up to 75% of that is recoverable (EPA, Water Audits and Water Loss Control, Jul 2013).
- In Kentucky, 87% of 36,673 boil water advisories from 2004 to 2020 were caused by a line break or leak (Water, Boil Water Advisories study, Jan 2024).
- Households hit by a low-pressure event had a 20% higher risk of gastrointestinal illness than matched households that were not (Environmental Health Perspectives, Jun 2025).
- Drinking water utilities invest about $33.6 billion a year in capital improvements against a projected need of about $90.2 billion, a gap of roughly $56.6 billion a year (AWWA, Beyond the Replacement Era, Feb 2026).
- The Infrastructure Investment and Jobs Act delivered more than $50 billion to EPA for drinking water, wastewater and stormwater infrastructure (EPA, Water Infrastructure Investments, Jul 2026).
- A 42-inch transmission main break in May 2026 cut off water to roughly 200,000 residents in five Michigan communities (Great Lakes Water Authority, The Crisis Beneath Us, Sep 2026).
What Is the Water Main Break Frequency in the US?
Nobody keeps a national register of breaks, so water main break frequency statistics are survey results with error bars. The most thorough one is the Utah State University study of 2023, and it puts the break rate near 11 per 100 miles a year.
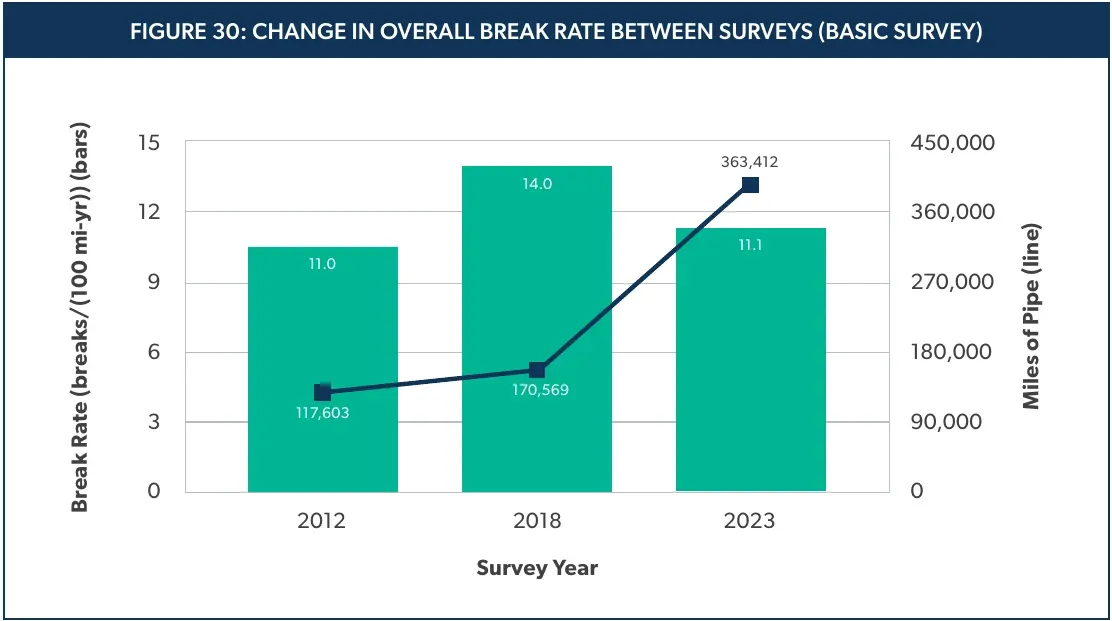 Figure 1: The overall break rate rose from 11.0 to 14.0 breaks per 100 miles between the 2012 and 2018 surveys, then fell to 11.1 in 2023, while the number of pipe miles reporting tripled. Source: Utah State University Water Research Laboratory, Water Main Break Rates in the USA and Canada, Dec 2023. Screenshot of the report page, captured 21 Oct 2026.
How many breaks happen each year?
- The 2023 survey covered 802 utilities and 399,812 miles of water main, which is 17.1% of the estimated length in the US and Canada (Utah State University Water Research Laboratory, Dec 2023).
- Break counts came from 778 utilities that reported 40,489 failures over 363,412 miles of pipe (Utah State University Water Research Laboratory, Dec 2023).
- The utilities that gave break data serve 30.1% of the combined US and Canadian population (Utah State University Water Research Laboratory, Dec 2023).
- ASCE puts the US total at about 240,000 breaks a year (ASCE, 2025 Report Card for Drinking Water, Mar 2025).
- ASCE says the 2018 estimate was between 250,000 and 300,000 breaks a year (ASCE, 2025 Report Card for Drinking Water, Mar 2025).
Is the break rate getting better or worse?
- The first Utah State survey, in 2012, found 11.0 breaks per 100 miles a year (Utah State University Water Research Laboratory, Dec 2023).
- The 2018 and 2012 surveys covered 170,569 and 117,603 miles of pipe, so the 2023 sample is more than twice as large as 2018 (Utah State University Water Research Laboratory, Dec 2023).
- The authors say the 2018 to 2023 drop appears to track a smaller share of cast iron and asbestos cement pipe, while the rate for each material stayed consistent (Utah State University Water Research Laboratory, Dec 2023).
Does utility size or region change the rate?
- Break rates ranged only from 9.4 to 12.3 across the four utility size groups, so a bigger system is not a safer one (Utah State University Water Research Laboratory, Dec 2023).
- Regional rates ran from 4.2 breaks per 100 miles in the Pacific Northwest region to 16.4 in the Northeast and mid-Atlantic and 17.6 in Canada (Utah State University Water Research Laboratory, Dec 2023).
- Five of the nine survey regions ran above the overall average (Utah State University Water Research Laboratory, Dec 2023).
- The study found 287 people served per mile of pipe, lower than the 325 the industry has assumed for urban areas (Utah State University Water Research Laboratory, Dec 2023).
Which Pipes Break the Most?
Material tells you more than the size of the utility. The same ranking has held across three surveys: cast iron fails most often, PVC least.
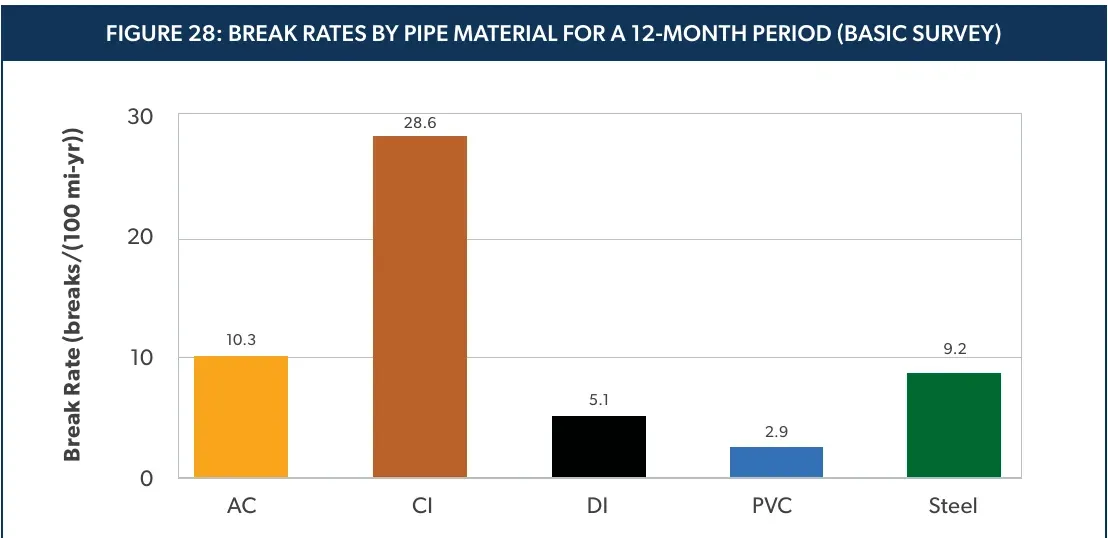 Figure 2: Cast iron mains broke about ten times as often as PVC in the 12 months before the survey. Source: Utah State University Water Research Laboratory, Water Main Break Rates in the USA and Canada, Dec 2023. Screenshot of the report page, captured 21 Oct 2026.
How do break rates compare by material?
- Asbestos cement mains broke at 10.3 per 100 miles a year and ductile iron at 5.1 (Utah State University Water Research Laboratory, Dec 2023).
- Over the past five years, cast iron averaged 30.4 and PVC 2.7, so the gap is not a one-year accident (Utah State University Water Research Laboratory, Dec 2023).
- Cast iron rates were 24.4 in the 2012 survey and 34.8 in 2018 (Utah State University Water Research Laboratory, Dec 2023).
- Canadian cast iron mains broke at 39.3 per 100 miles against 27.7 in the US, which the authors tie to corrosive soils and extreme cold (Utah State University Water Research Laboratory, Dec 2023).
What are America’s mains made of?
- Four materials make up 90% of installed mains: PVC at 29%, ductile iron at 27%, cast iron at 23% and asbestos cement at 11% (Utah State University Water Research Laboratory, Dec 2023).
- Cast iron and asbestos cement together fell from 41.1% of installed pipe in 2018 to 33.3% in 2023, while PVC grew by 7.0% (Utah State University Water Research Laboratory, Dec 2023).
- Utilities that approve ductile iron for new work fell from 86% in 2018 to 78% in 2023, while approval of steel rose from 38% to 44% (Utah State University Water Research Laboratory, Dec 2023).
- In EPA’s needs survey, responding systems said they would replace 54% of existing pipe length with plastic and 34% with ductile iron (EPA, 7th Drinking Water Infrastructure Needs Survey, Sep 2023).
- In the same survey, 47% of systems named plastic as the likely material for new pipe projects and 34% named ductile iron (EPA, 7th Drinking Water Infrastructure Needs Survey, Sep 2023).
- EPA’s survey respondents reported about one-third of their existing pipe as plastic (EPA, 7th Drinking Water Infrastructure Needs Survey, Sep 2023).
Do pipe size and soil matter?
- Distribution pipe of 12 inches or less broke at 13.3 per 100 miles, against 2.2 for larger transmission mains (Utah State University Water Research Laboratory, Dec 2023).
- Pipes of 12 inches or less are 86% of all mains, and 68% are 8 inches or less (Utah State University Water Research Laboratory, Dec 2023).
- 75% of utilities reported at least one area with corrosive soil (Utah State University Water Research Laboratory, Dec 2023).
- 73% of utilities use some form of corrosion protection, most often polyethylene encasement (Utah State University Water Research Laboratory, Dec 2023).
- Ductile iron in highly corrosive soil broke at more than six times the rate of ductile iron in low-corrosion soil (ASCE, 2025 Report Card for Drinking Water, Mar 2025).
How Old Are America’s Water Mains?
The pipe in the ground is older than the plan to replace it. A third of it is past 50, and the average main that fails is already past that mark.
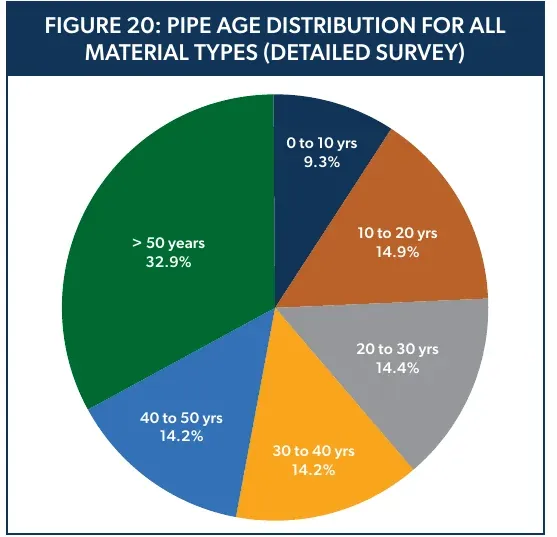 Figure 3: About one third of installed water main is more than 50 years old, and only 9.3% was laid in the last 10 years. Source: Utah State University Water Research Laboratory, Water Main Break Rates in the USA and Canada, Dec 2023. Screenshot of the report page, captured 21 Oct 2026.
How much pipe is past 50?
- 33% of water mains are more than 50 years old, which the study puts at about 770,000 miles in the US and Canada (Utah State University Water Research Laboratory, Dec 2023).
- 86% of cast iron pipe is over 50 years old, as is 41% of asbestos cement (Utah State University Water Research Laboratory, Dec 2023).
- The average age of a failing main was 47 years in 2012 and 50 in 2018, and it has crept up to 53 (Utah State University Water Research Laboratory, Dec 2023).
- Cast iron break rates fell 18% since 2018 and asbestos cement 1%, which the authors say appears to reflect legacy pipe being replaced ahead of failure (Utah State University Water Research Laboratory, Dec 2023).
How long should a main last?
- ASCE says pipes laid after World War II have an average lifespan of 75 to 100 years (ASCE, 2025 Report Card for Drinking Water, Mar 2025).
- Utilities in the Utah State survey put the expected life of installed pipe at 78 years, against 84 in 2018 and 79 in 2012 (Utah State University Water Research Laboratory, Dec 2023).
- The country has more than 2 million miles of drinking water pipe run by nearly 150,000 public water systems (ASCE, 2025 Report Card for Drinking Water, Mar 2025).
How much pipe is overdue?
- 19.4% of installed mains, about 452,000 miles, are past their useful lives (Utah State University Water Research Laboratory, Dec 2023).
- That share was 8% in the 2012 survey and 16% in 2018 (Utah State University Water Research Laboratory, Dec 2023).
- Over half of public water systems name replacing aging infrastructure as their most critical challenge (ASCE, 2025 Report Card for Drinking Water, Mar 2025).
What are utilities doing about it?
- 69.9% of utilities have a pipe replacement program (Utah State University Water Research Laboratory, Dec 2023).
- 43.5% run regular condition assessments of their mains (Utah State University Water Research Laboratory, Dec 2023).
- The average target break rate that triggers replacement was 21 per 100 miles, though most utilities said they had no target (Utah State University Water Research Laboratory, Dec 2023).
- 93% of utilities use open-cut methods for replacement, 65% use directional drilling, 32% use relining and 18% use pipe bursting (Utah State University Water Research Laboratory, Dec 2023).
- The industry guideline is 65% planned and 35% reactive maintenance, and the share of utilities that track that ratio rose from 37% in 2015 to 42% in 2023 (ASCE, 2025 Report Card for Drinking Water, Mar 2025).
- 74.0% of utilities in AWWA’s 2025 survey have an asset management plan fully or partly in place, and 79.7% have a capital improvement plan (AWWA, State of the Water Industry 2025, Oct 2025).
When Do Water Mains Break?
Winter is the busy season, and the best evidence comes from utilities that count breaks by month. The pattern is sharper than most customers think.
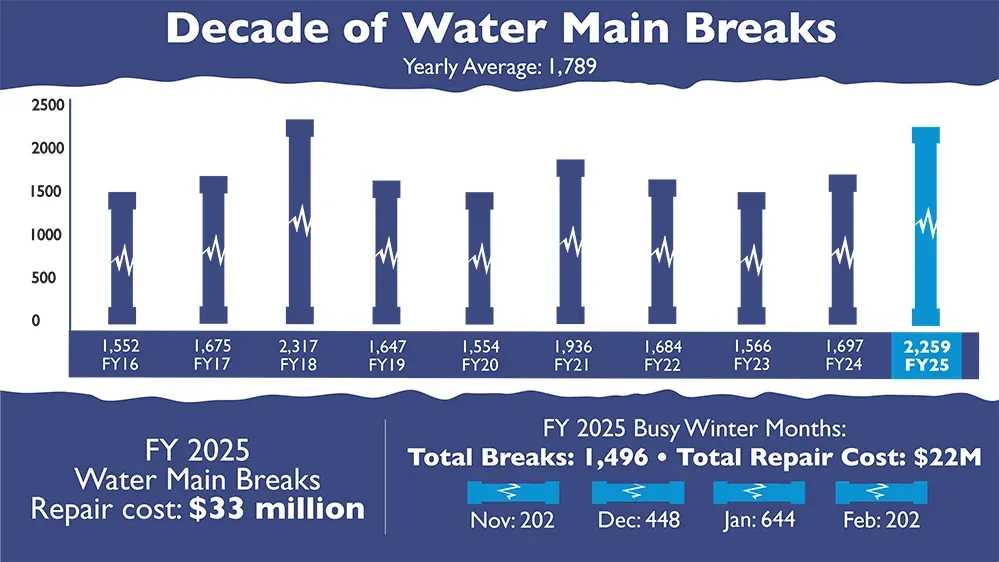 Figure 4: WSSC Water averaged 1,789 breaks a year over ten fiscal years, and January alone took 644 of the 2,259 in fiscal 2025. Source: WSSC Water, Winter Ready, Sep 2026. Chart published by the source, captured 21 Oct 2026.
How much of the year’s breaks come in winter?
- In fiscal 2025, WSSC Water logged 202 breaks in November, 448 in December, 644 in January and 202 in February, for 1,496 in the four winter months (WSSC Water, Winter Ready, Sep 2026).
- Its ten-year average is 1,789 breaks a year, and the peak was 2,317 in fiscal 2018 (WSSC Water, Winter Ready, Sep 2026).
- January 2018, during a polar vortex, was the busiest month on record, with 802 water mains repaired (WSSC Water, news release, Jan 2022).
- From November 1, 2021 to January 10, 2022, the same utility repaired 542 water main breaks (WSSC Water, news release, Jan 2022).
- New York’s Department of Environmental Protection says most breaks happen in the winter months, when freeze and thaw cycles drive the count (NYC DEP, Mayor’s Management Report, Sep 2026).
- DC Water says breaks become more common as the weather turns cold, and in its busiest weeks it can have more than 20 open at once (DC Water, Life Cycle of a Water Main Break, Oct 2026).
Why does cold weather break pipes?
- WSSC Water tracked the Potomac River falling about 17 degrees, from 49 to 32 degrees, between November 26 and December 15, 2025, and logged 293 breaks and leaks in that stretch (WSSC Water, Dec 2025).
- In January 2022 the river fell from 53 to 38 degrees, and the utility had 42 breaks in two days against 18 in the two days before (WSSC Water, news release, Jan 2022).
- The utility says breaks tend to peak a few days after the river hits a new low, because colder water takes time to travel through the system (WSSC Water, Winter Ready, Sep 2026).
- Canadian researchers found that utilities in colder climates often see a peak in break frequency when air temperature is near 0 degrees Celsius (National Research Council Canada, Urban Water Journal, May 2012).
- In data from three utilities in the US and Canada, temperature measures such as the size and speed of air temperature changes were consistently significant, and air temperature alone was usually enough to predict breaks (National Research Council Canada, Urban Water Journal, May 2012).
Do breaks happen in summer too?
- Pittsburgh Water says breaks are more likely in winter but can happen at any time, and that summer use of water for lawns, pools and drinking adds pressure and volume that a weak main may not hold (Pittsburgh Water, Water Main Breaks, Oct 2026).
- In Kentucky, summer had the largest share of boil water advisories at 29%, ahead of fall, winter and spring (Water, Boil Water Advisories study, Jan 2024).
- Advisories issued in winter lasted longest, and January advisories averaged about 12 days (Water, Boil Water Advisories study, Jan 2024).
What Do Big-City Utilities Report?
Cities that publish their counts show what the national surveys average out. Breaks swing year to year with the weather, and the older the pipe, the harder the swing.
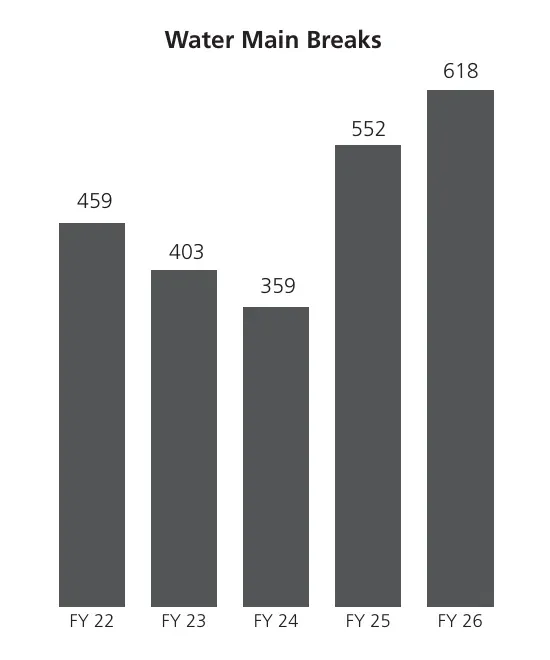 Figure 5: New York’s break count fell to 359 in fiscal 2024, then climbed to 618 in fiscal 2026. Source: NYC DEP, Mayor’s Management Report Fiscal 2026, Sep 2026. Screenshot of the report page, captured 21 Oct 2026.
What is happening in New York City?
- The city counted 459 breaks in fiscal 2022, 403 in 2023, 359 in 2024 and 552 in 2025 (NYC DEP, Mayor’s Management Report, Sep 2026).
- The fiscal 2026 count rose 12% and the rate per 100 miles rose 10% over fiscal 2025 (NYC DEP, Mayor’s Management Report, Sep 2026).
- The fiscal 2025 count of 552 was the most since fiscal 2015 (NYC DEP, Mayor’s Management Report, Sep 2025).
- The average time to restore water after a confirmed break was 3 hours 54 minutes in fiscal 2026, against a target of 6 hours (NYC DEP, Mayor’s Management Report, Sep 2026).
- The city received 761 leak complaints on city infrastructure and 4,567 street cave-in complaints, up 28% on the year (NYC DEP, Mayor’s Management Report, Sep 2026).
What do the Washington-area utilities report?
- WSSC Water maintains 5,958 miles of water mains, and 2,485 miles of them are more than 50 years old (WSSC Water, Winter Ready, Sep 2026).
- The system also has 78,880 valves, 1,985 miles of main aged 25 to 50 years and 1,488 miles under 25 (WSSC Water, Winter Ready, Sep 2026).
- Its mains range from 3 to 96 inches in diameter, and it serves 1.9 million customers (WSSC Water, Dec 2025).
- DC Water averages between 400 and 500 water main breaks a year (DC Water, Life Cycle of a Water Main Break, Oct 2026).
- A simple DC Water repair takes six to eight hours, and a large or complicated one can take several days to a week (DC Water, Life Cycle of a Water Main Break, Oct 2026).
What about Pittsburgh, Denver and Detroit?
- Pittsburgh Water runs about 960 miles of mains with an average age of about 80 years, and more than 40% were installed before 1920 (Pittsburgh Water, Water Main Breaks, Oct 2026).
- Denver Water repaired 326 main breaks in 2016 across more than 3,000 miles of pipe (Denver Water, Main breaks 101, Feb 2017).
- Denver’s system has 160 pressure zones, and it maintains pressure regulating valves to cut the number of breaks they cause (Denver Water, Main breaks 101, Feb 2017).
- The Great Lakes Water Authority runs more than 800 miles of transmission main with an average age of 70 years (Great Lakes Water Authority, The Crisis Beneath Us, Sep 2026).
- A 2022 break on its 120-inch main first affected 23 communities and about 935,000 people, then 133,000 people in seven communities within 24 hours (Great Lakes Water Authority, The Crisis Beneath Us, Sep 2026).
- The authority counted four major breaks in seven years along its 14 Mile Road corridor (Great Lakes Water Authority, 14 Mile project release, Jul 2026).
How Much Water Do Leaks and Breaks Waste?
The break you see on the news is the smaller part of the loss. Most water leaves through leaks that never reach the street.
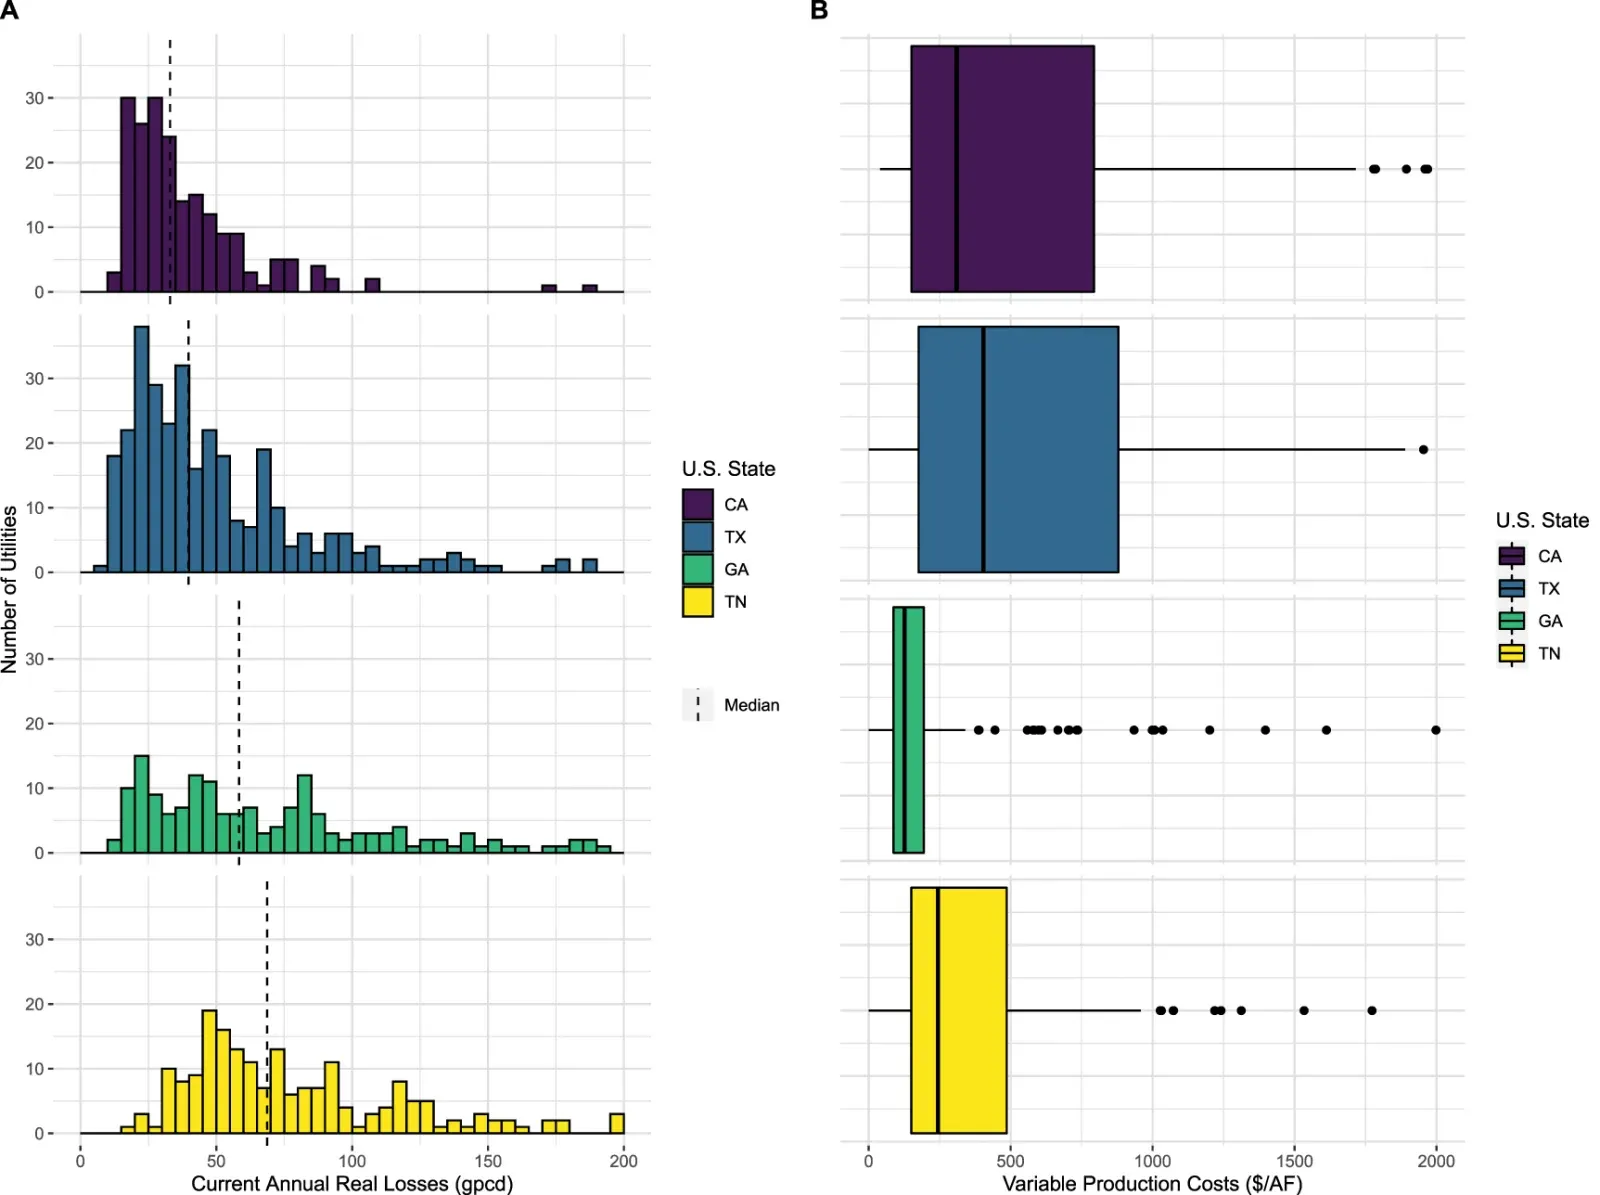 Figure 6: Real losses ranged from about 10 to more than 200 gallons per connection per day across 882 utilities in four states, and the state medians differ widely. Source: Environmental Research Letters, Untapped potential: leak reduction is the most cost-effective urban water management tool, Feb 2022. Chart published by the source, captured 21 Oct 2026.
How much of the supply is lost?
- The average utility in a four-state study of 882 systems lost 17% of its delivered water to leaks (Environmental Research Letters, Feb 2022).
- Utility loss shares ranged from 1% to 55% of delivered water, and state totals ranged from 4% to 25% (Environmental Research Letters, Feb 2022).
- Real losses ran from 10 to more than 250 gallons per connection per day and were lowest on average in California (Environmental Research Letters, Feb 2022).
- Utilities in the Utah State survey estimated leakage at 11% of water, up from 10% in 2018 (Utah State University Water Research Laboratory, Dec 2023).
- Worldwide, utilities lose an estimated 346 million cubic meters of water a day to non-revenue water, worth about $39 billion a year at $0.31 per cubic meter (IWA, Water Supply, May 2019).
- EPA’s 2013 fact sheet estimated that $97 billion of 20-year water system need was for water loss control (EPA, Water Audits and Water Loss Control, Jul 2013).
How much does one break lose?
- Denver Water estimates a 6-inch main break loses 30,000 to 156,000 gallons and an 8-inch break 35,000 to 252,000 (Denver Water, Main breaks 101, Feb 2017).
- A 12-inch break loses 45,000 to 378,000 gallons, and a 16-inch break 52,000 to 1,125,000 (Denver Water, Main breaks 101, Feb 2017).
- A leak on a three-quarter-inch service line is estimated at 15,000 gallons (Denver Water, Main breaks 101, Feb 2017).
- A 24-inch pipe that burst in January 2017 lost an estimated 10 million gallons (Denver Water, Main breaks 101, Feb 2017).
- Denver says less than 1% of the 60 billion gallons it treats a year is lost to breaks and leaks it finds and repairs (Denver Water, Main breaks 101, Feb 2017).
Who tracks and fixes leaks?
- Only seven states required standardized water loss audits as of 2022, and none regulated the level of loss (Environmental Research Letters, Feb 2022).
- For the median utility, reducing losses by 34.7% was economically efficient, at a median cost of $277 per acre-foot of water saved (Environmental Research Letters, Feb 2022).
- The same study found efficient loss standards would save 10.1% of deliveries in Tennessee but only 1.8% in California (Environmental Research Letters, Feb 2022).
- EPA says the payback on a water loss control program is typically measured in days, weeks and months rather than years (EPA, Water Audits and Water Loss Control, Jul 2013).
- 67.8% of utilities in AWWA’s 2025 survey have a water loss control program fully or partly implemented (AWWA, State of the Water Industry 2025, Oct 2025).
What Does a Water Main Break Cost?
The repair is the small line on the bill. Replacement runs into the billions, and the cost of an emergency repair is climbing faster than the number of breaks.
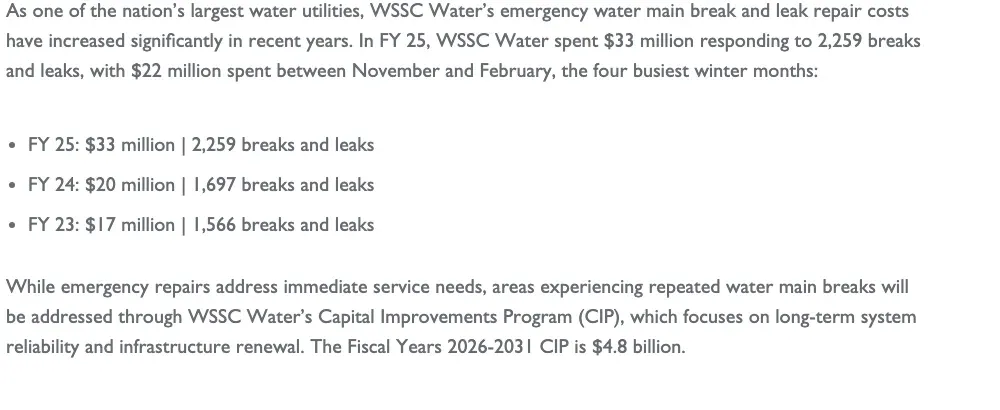 Figure 7: WSSC Water’s spending on breaks and leaks nearly doubled in two years while the count rose by about 44%. Source: WSSC Water, news release, Dec 2025. Screenshot of the source page, captured 21 Oct 2026.
What does an emergency repair cost?
- WSSC Water spent $20 million on 1,697 breaks and leaks in fiscal 2024 (WSSC Water, Dec 2025).
- Of its $33 million fiscal 2025 repair spending, $22 million fell in the four winter months (WSSC Water, Dec 2025).
- The utility says a crew typically needs four to six hours to repair a break after the pipe has been dug up and uncovered (WSSC Water, Dec 2025).
- The Great Lakes Water Authority’s immediate response to the May 2026 break cost over $1 million (Great Lakes Water Authority, The Crisis Beneath Us, Sep 2026).
- A February 2025 break on a nearly 100-year-old cast iron main in Southwest Detroit displaced residents for as long as three months while furnaces and hot water tanks were restored (Great Lakes Water Authority, The Crisis Beneath Us, Sep 2026).
What does replacement cost?
- Utah State University links the 452,000 miles of overdue pipe to a funding shortfall of about $452 billion (Utah State University Water Research Laboratory, Dec 2023).
- EPA’s 20-year need grew 32% from its sixth survey, which was $472.6 billion in 2015 dollars (EPA, 7th Drinking Water Infrastructure Needs Survey, Sep 2023).
- Denver Water replaces an average of 60,000 feet of pipe a year, spent about $11 million on main replacement and improvement in 2016, and planned about $130 million over the next 10 years (Denver Water, Main breaks 101, Feb 2017).
- WSSC Water’s capital program for fiscal 2026 to 2031 is $4.8 billion (WSSC Water, Dec 2025).
- The Great Lakes Water Authority plans about $81 million to replace three miles of 48-inch main with 54-inch steel and inspect three more miles on 14 Mile Road (Great Lakes Water Authority, 14 Mile project release, Jul 2026).
- AWWA projects total drinking water infrastructure needs of $2.1 trillion to $2.4 trillion from 2026 to 2050 (AWWA, Beyond the Replacement Era, Feb 2026).
What does it do to utility crews?
- 54% of utility executives say emergency repairs and system failures often or always lead to overtime requests (AWWA, State of the Water Industry 2026, Apr 2026).
- 56% say on-call response requirements often or always drive overtime (AWWA, State of the Water Industry 2026, Apr 2026).
- About 21% of utility employees are eligible to retire within five years (AWWA, State of the Water Industry 2026, Apr 2026).
Why Do Boil-Water Advisories Follow Breaks?
A break drops the pressure in the pipe, and low pressure can let dirty water in. That is why a street repair can end with a notice on every door.
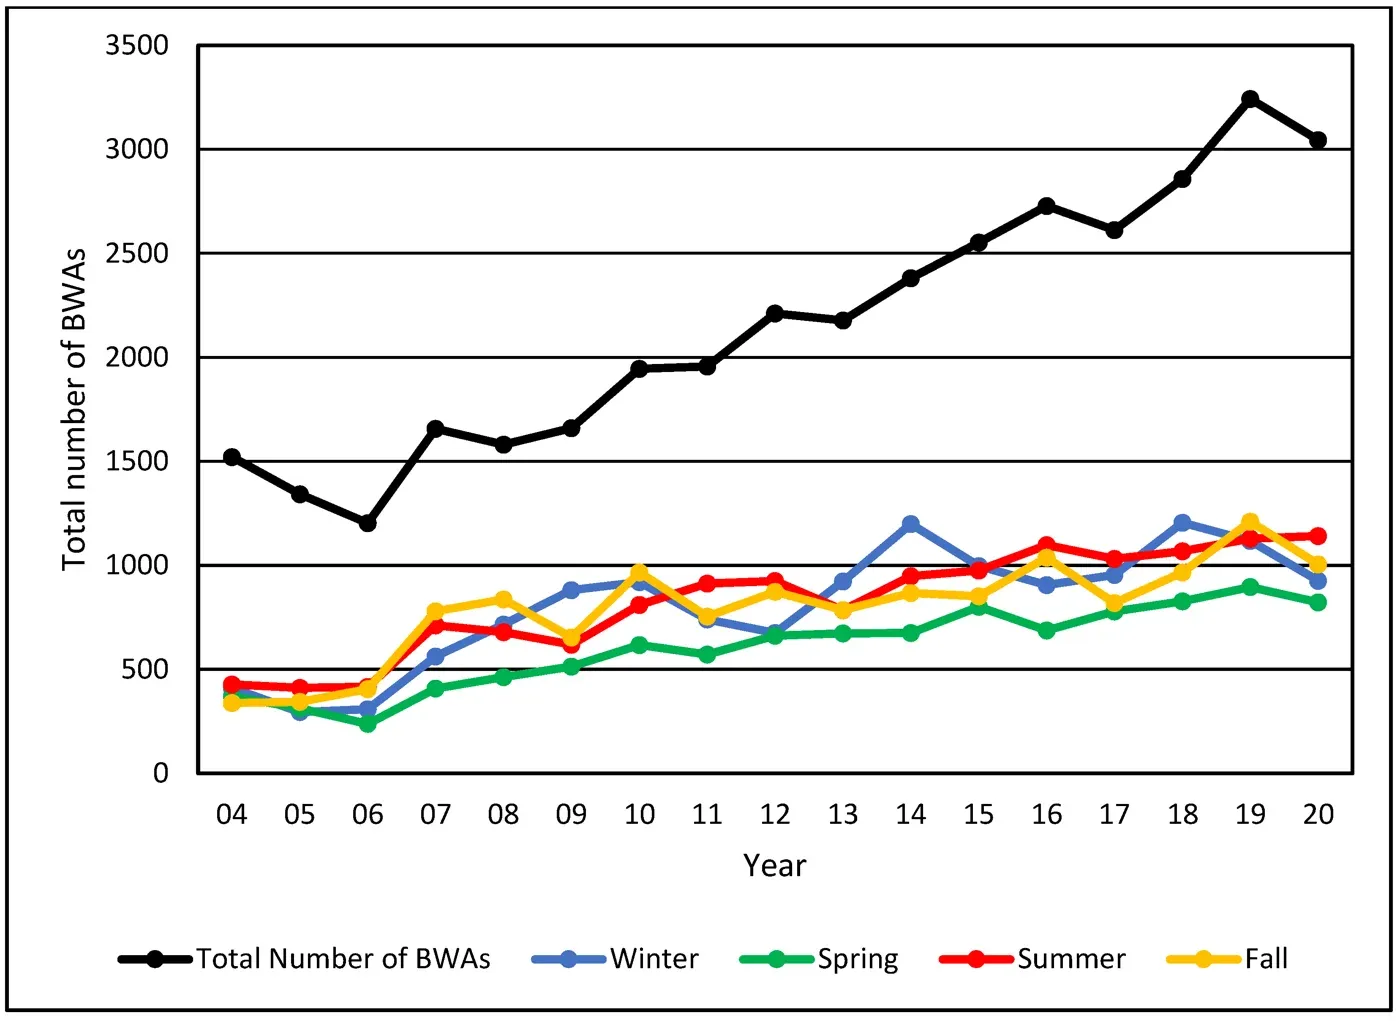 Figure 8: Kentucky’s yearly count of boil water advisories rose across 17 years, with all four seasons climbing together. Source: Water, Public Water Service Disruptions: A Descriptive Analysis of Boil Water Advisories, Jan 2024. Chart published by the source, captured 21 Oct 2026.
How often do breaks trigger advisories?
- Kentucky’s community water systems issued 36,673 boil water advisories from 2004 to 2020, and 93% of the 378 systems issued at least one (Water, Boil Water Advisories study, Jan 2024).
- The average advisory lasted about 5 days, and the longest lasted 2,588 days (Water, Boil Water Advisories study, Jan 2024).
- One system issued 1,361 advisories, and 49 systems issued more than 200 (Water, Boil Water Advisories study, Jan 2024).
- Counties in the eastern, Appalachian part of the state issued about 58% of the advisories (Water, Boil Water Advisories study, Jan 2024).
- The average advisory length fell from about 7 days in 2004 to about 3 days in 2020, and small systems averaged 9 days (Water, Boil Water Advisories study, Jan 2024).
- In West Virginia, 57% of 239 community water systems issued at least one advisory in fiscal 2023, and the average was 3.8 advisories per system (Water, Financial Burden of Boil Water Advisories, Mar 2026).
- Distribution system failures such as main and line breaks and leaks caused about 80% of West Virginia’s advisories (Water, Financial Burden of Boil Water Advisories, Mar 2026).
- Utilities in that state spent an average of about 20 days under advisory, or 5.4% of the year, and some spent more than 75% (Water, Financial Burden of Boil Water Advisories, Mar 2026).
- Each day under an advisory was associated with an average cost increase of about $1,020 per utility (Water, Financial Burden of Boil Water Advisories, Mar 2026).
- After the May 2026 Michigan break, the Great Lakes Water Authority handed out 31,700 gallons of water before the advisories were lifted on May 16 (Great Lakes Water Authority, Update 8, May 2026).
What happens to health when pressure drops?
- A CDC and EPA study matched exposed and unexposed areas across 58 low-pressure events at five utilities between 2015 and 2019 (Environmental Health Perspectives, Jun 2025).
- Of those events, 76% were planned maintenance and 24% were emergencies (Environmental Health Perspectives, Jun 2025).
- The survey covered 879 exposed and 1,414 unexposed households, and 39% of surveys came back (Environmental Health Perspectives, Jun 2025).
- Emergency events carried a higher unadjusted illness risk than the overall figure, with a risk ratio of 1.36 (Environmental Health Perspectives, Jun 2025).
- Households had a higher unadjusted risk of illness when the utility did not swab the repaired pipe, with a risk ratio of 1.33 (Environmental Health Perspectives, Jun 2025).
- Water near cast iron repairs was 2.33 times as likely to have Bacteroidales, a general fecal indicator, detected as water near repairs on other materials (Environmental Health Perspectives, Jun 2025).
- An earlier review found temporary water outages were associated with a relative risk of 3.26 for gastrointestinal illness (Environmental Health Perspectives, Jun 2014).
- CDC’s outbreak data for 2015 to 2020 list low pressure or a pressure change in the distribution system as 4 entries, or 1.0% of the table, for Legionella and other biofilm outbreaks (CDC, MMWR Surveillance Summaries, Mar 2024).
Who Pays to Replace Aging Mains?
Ratepayers pay most of it. Federal money helped for a few years, and it has an end date.
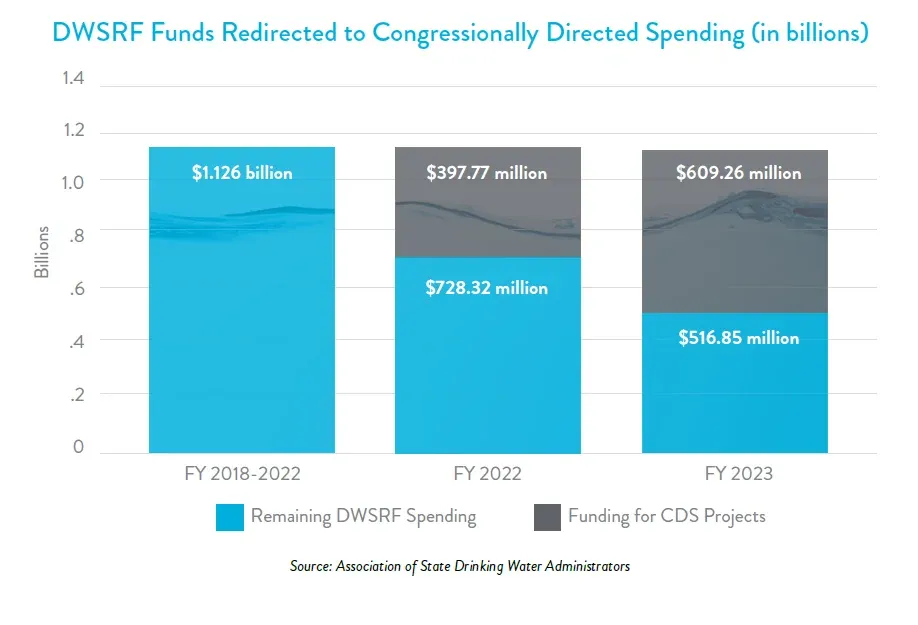 Figure 9: Congressionally directed projects took $397.77 million of state drinking water loan fund money in fiscal 2022 and $609.26 million in fiscal 2023. Source: ASCE, 2025 Report Card for Drinking Water, Mar 2025, charting data from the Association of State Drinking Water Administrators. Chart published by ASCE, captured 21 Oct 2026.
How much federal money is flowing?
- The infrastructure law put $11.7 billion into the Drinking Water State Revolving Fund and another $11.7 billion into the Clean Water fund (EPA, Water Infrastructure Investments, Jul 2026).
- The law set the general drinking water supplemental grants at $1.902 billion for fiscal 2022, $2.202 billion for 2023, $2.403 billion for 2024 and $2.603 billion for each of 2025 and 2026 (Congress, Public Law 117-58, Nov 2021).
- It requires 49% of the general supplemental drinking water funds to go out as grants or loans with 100% principal forgiveness (Congress, Public Law 117-58, Nov 2021).
- The same law authorized $3.25 billion for each of fiscal 2025 and 2026 for the base drinking water fund (Congress, Public Law 117-58, Nov 2021).
- Since fiscal 2022, Congress has appropriated the base drinking water fund at more than $1 billion below authorized levels (ASCE, 2025 Report Card for Drinking Water, Mar 2025).
- EPA announced $7.2 billion in fiscal 2026 allotments across the clean water and drinking water loan funds (EPA, Drinking Water State Revolving Fund, Sep 2026).
- EPA’s WIFIA program has closed 158 loans worth $25 billion in financing (EPA, WIFIA, Oct 2026).
- Those loans support $53 billion in projects that serve 68 million people (EPA, WIFIA, Oct 2026).
- EPA says WIFIA borrowers have saved $8 billion (EPA, WIFIA, Oct 2026).
- ASCE says WIFIA financing had eliminated 100 water main breaks a year as of December 2023 (ASCE, 2025 Report Card for Drinking Water, Mar 2025).
- AWWA says the infrastructure law money is temporary and set to expire after fiscal 2026 (AWWA, Beyond the Replacement Era, Feb 2026).
Who pays the rest?
- Federal contributions are about 3.9% of total public spending on water utilities (AWWA, Beyond the Replacement Era, Feb 2026).
- Closing the annual gap would mean spending 168% more than utilities spend on capital improvements now (AWWA, Beyond the Replacement Era, Feb 2026).
- If water bills alone closed the gap, average annual household drinking water bills would rise 126% by 2050, before inflation (AWWA, Beyond the Replacement Era, Feb 2026).
- Monthly household water bills rose about 64% from 2012 to 2023, to an average of $51 (ASCE, 2025 Report Card for Drinking Water, Mar 2025).
- Only 20% of water utilities reported being fully able to cover the cost of drinking water services (ASCE, 2025 Report Card for Drinking Water, Mar 2025).
- 46% of utility executives plan to raise rates in the next five years, and 24% plan to do so within a year (AWWA, State of the Water Industry 2026, Apr 2026).
- 57% say rate increases are used often or always for capital investment, up from 44% in the prior survey (AWWA, State of the Water Industry 2026, Apr 2026).
- Only 45% say their access to capital is as good or better than at any time in the past five years (AWWA, State of the Water Industry 2026, Apr 2026).
- The share of the state loan fund capitalization grant going to those congressionally directed projects rose from about 35% in 2022 to 54% in 2023 (Association of State Drinking Water Administrators, Hidden Consequences, Dec 2023).
- Between fiscal 2022 and 2023, $1,007,021,093 was diverted from the state drinking water loan funds to congressionally directed projects, cutting capitalization grants by nearly 45% (Association of State Drinking Water Administrators, Hidden Consequences, Dec 2023).
What Does a Main Break Mean for Plumbers and Customers?
The utility owns the pipe in the street, and the owner owns the pipe on the property. The shop gets the call in the gap between them, usually in the same week as every other shop in town.
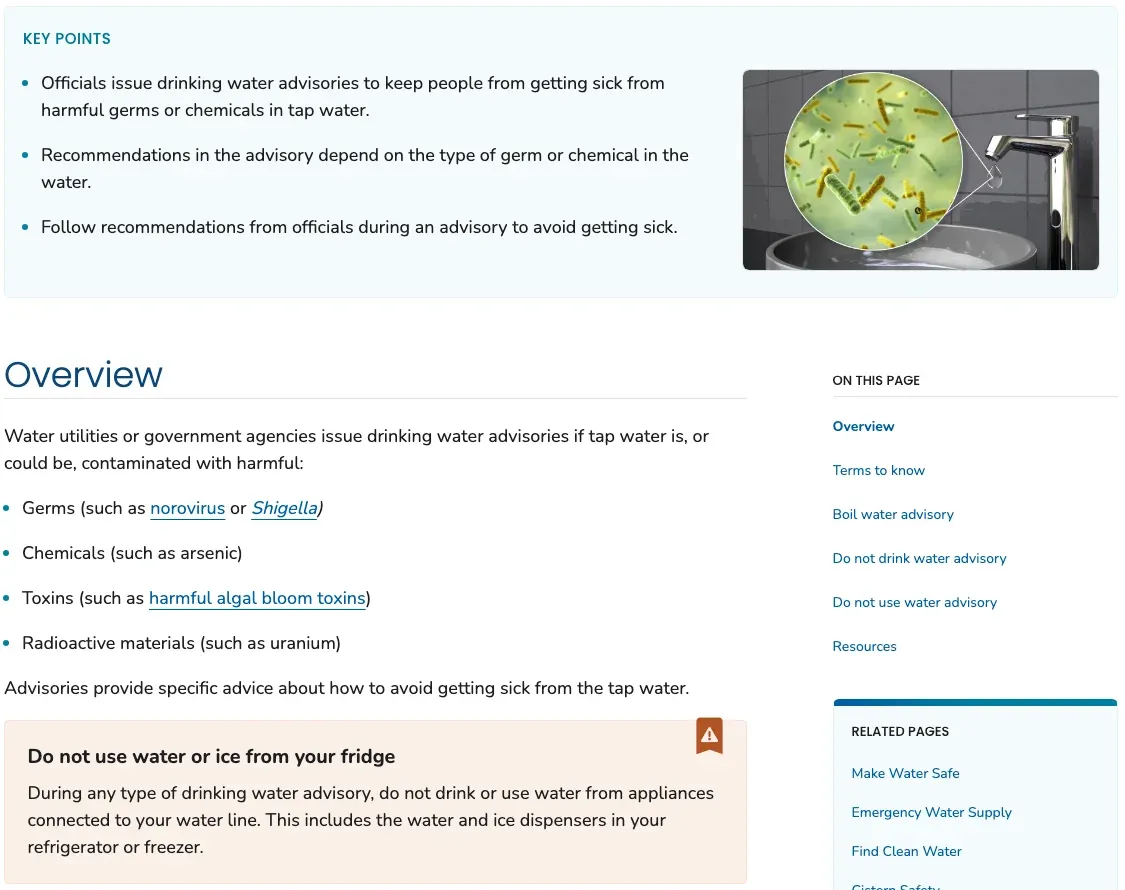 Figure 10: CDC tells households under any advisory not to use water or ice from fridge dispensers, a fixture-level job that lands on plumbers. Source: CDC, Drinking Water Advisories: An Overview, Mar 2024. Screenshot of the source page, captured 21 Oct 2026.
Where does the utility stop and the owner start?
- WSSC Water maintains the pipes in the streets and the connections up to the property line, and a frozen pipe on private property is the owner’s job to repair (WSSC Water, Dec 2025).
- It tells owners to keep the temperature where meters and interior pipes sit at 55 degrees Fahrenheit or more (WSSC Water, Winter Ready, Sep 2026).
- It tells owners who are away to leave the heat on at no lower than 55 degrees (WSSC Water, Winter Ready, Sep 2026).
What pressure do building pipes see?
- Utilities in the Utah State survey reported an average operating pressure of 71 psi and an average maximum of 120 psi (Utah State University Water Research Laboratory, Dec 2023).
- DC Water says a repaired main must be recharged, which can take up to an hour, and on rare occasions the main breaks again because turning the water on causes intense pressure (DC Water, Life Cycle of a Water Main Break, Oct 2026).
- New York’s utility lists pressure management and pressure regulator maintenance among the steps it takes to reduce breaks (NYC DEP, Mayor’s Management Report, Sep 2026).
What should customers do under an advisory?
- CDC says a boil water advisory means bringing tap water to a full rolling boil for 1 minute, or 3 minutes above 6,500 feet (CDC, Drinking Water Advisories, Mar 2024).
- CDC says to boil tap water even if it has passed through a home filter or a filter pitcher (CDC, Drinking Water Advisories, Mar 2024).
- Dishwashers are generally safe if they have a sanitizing cycle or reach a final rinse of at least 150 degrees Fahrenheit (CDC, Drinking Water Advisories, Mar 2024).
- CDC names a water main break among the emergencies after which tap water may not be safe, and it warns never to drink water from radiators or boilers in a home heating system (CDC, How to Make Water Safe in an Emergency, Sep 2024).
Methodology and Sources
Every number comes from the agency, utility, journal or association that produced it, never from a roundup. Where a figure is quoted by a second source, the page cites the original. The 126 billion cubic meters of water a year that appears in some US summaries matches the 2019 global non-revenue water estimate, so it is cited here as a world figure. Utility pages that show no publication date, such as DC Water and Pittsburgh Water, are dated by the month they were retrieved. The Utah State University study was partly funded by the Uni-Bell PVC Pipe Association, the trade association for PVC pipe makers, so its material comparisons deserve that context. Its break rates are for the US and Canada combined unless stated, and the New York, Washington, Denver and Detroit figures are single-utility counts that do not represent the nation. Figures drawn from charts are named in the captions. The page is refreshed monthly.
Glossary
- AWWA: American Water Works Association.
- ASCE: American Society of Civil Engineers.
- BWA: Boil water advisory, a notice telling customers to boil tap water before use.
- CIP: Capital improvement program, a utility’s multi-year pipe and plant spending plan.
- DWSRF: Drinking Water State Revolving Fund, EPA’s low-cost loan program for states.
- GLWA: Great Lakes Water Authority, the regional supplier in southeast Michigan.
- HCGI: Highly credible gastrointestinal illness, a symptom-based illness definition used in the CDC study.
- IIJA: Infrastructure Investment and Jobs Act, the 2021 law also called the Bipartisan Infrastructure Law.
- LPE: Low-pressure event, a service disruption that presumably lowers system water pressure.
- NRW: Non-revenue water, water a utility produces but does not bill for.
- psi: Pounds per square inch, a measure of water pressure.
- WIFIA: Water Infrastructure Finance and Innovation Act, EPA’s large-project loan program.
- WSSC: Washington Suburban Sanitary Commission, now branded WSSC Water.
Sources
- ASCE, 2025 Report Card for Drinking Water, Mar 2025
- Association of State Drinking Water Administrators, Hidden Consequences, Dec 2023
- AWWA, Beyond the Replacement Era, Feb 2026
- AWWA, State of the Water Industry 2025, Oct 2025
- AWWA, State of the Water Industry 2026, Apr 2026
- CDC, Drinking Water Advisories, Mar 2024
- CDC, How to Make Water Safe in an Emergency, Sep 2024
- CDC, MMWR Surveillance Summaries, Mar 2024
- Congress, Public Law 117-58, Nov 2021
- DC Water, Life Cycle of a Water Main Break, Oct 2026
- Denver Water, Main breaks 101, Feb 2017
- Environmental Health Perspectives, Jun 2025
- Environmental Health Perspectives, Jun 2014
- Environmental Research Letters, Feb 2022
- EPA, 7th Drinking Water Infrastructure Needs Survey, Sep 2023
- EPA, Drinking Water State Revolving Fund, Sep 2026
- EPA, Water Audits and Water Loss Control, Jul 2013
- EPA, Water Infrastructure Investments, Jul 2026
- EPA, WIFIA, Oct 2026
- Great Lakes Water Authority, 14 Mile project release, Jul 2026
- Great Lakes Water Authority, The Crisis Beneath Us, Sep 2026
- Great Lakes Water Authority, The Crisis Beneath Us, Sep 2026
- Great Lakes Water Authority, Update 8, May 2026
- IWA, Water Supply, May 2019
- National Research Council Canada, Urban Water Journal, May 2012
- NYC DEP, Mayor’s Management Report, Sep 2025
- NYC DEP, Mayor’s Management Report, Sep 2026
- Pittsburgh Water, Water Main Breaks, Oct 2026
- Utah State University Water Research Laboratory, Dec 2023
- Water, Boil Water Advisories study, Jan 2024
- Water, Financial Burden of Boil Water Advisories, Mar 2026
- WSSC Water, news release, Jan 2022
- WSSC Water, Winter Ready, Sep 2026
- WSSC Water, Dec 2025