Water damage restoration industry statistics are harder to find than they should be, because the federal government has no single code for the work. Mold cleanup sits in one code and fire and flood rebuilds sit in construction codes. This page builds the best picture from the sources that do publish: the Census Bureau, the Bureau of Labor Statistics, a public company filing, the standards body and the companies themselves.
The numbers below are for remediation and restoration work in the United States, mostly NAICS 562910, which is the closest federal code. It is a proxy, not a headcount of dryout crews. Where a figure covers more than water damage, the text says so. Every figure is dated and linked to the file or page it came from.
For a plumbing shop, the point is simple. The restoration trade is mostly small firms, it has been growing, and the big brands sell to insurers, who want clear estimates and records. That is the same ground a plumber covers on a burst pipe call.
For the wider trade, see plumbing industry numbers. For how often homes are hit and what claims pay, see water damage claims and water damage causes in homes.
Key Takeaways
- Receipts at US remediation firms rose from $16.08 billion in 2017 to $22.74 billion in 2022 (Census Bureau, Economic Census, Dec 2024).
- The number of remediation firms grew from 3,886 in 2017 to 5,115 in 2022 (Census Bureau, Economic Census, Jun 2020).
- Employer establishments in the closest federal code grew from 4,103 in 2012 to 5,826 in 2023 (Census Bureau, County Business Patterns, Jun 2025).
- Private-sector remediation employment averaged 100,482 jobs in 2025 (BLS, Quarterly Census of Employment and Wages, Aug 2026).
- In 2023, 2,741 establishments had fewer than 5 employees, the largest size group (Census Bureau, County Business Patterns, Jun 2025).
- The 88 firms with 500 or more employees booked $7.90 billion of the $23.36 billion in 2022 receipts (Census Bureau, Statistics of U.S. Businesses, Apr 2025).
- Fire and flood restoration by general contractors is filed under residential remodelers, not remediation (Census Bureau, NAICS, Jul 2026).
- SERVPRO says it has more than 2,400 locations in the United States and Canada (SERVPRO, Oct 2026).
- Paul Davis Restoration serves the insurance industry through 372 franchises (FirstService, Annual Information Form 2025, Feb 2026).
- The IICRC reports more than 49,000 active certified technicians and more than 6,500 certified firms worldwide (IICRC, Oct 2026).
- The EPA says water-damaged areas and items should be dried within 24 to 48 hours to prevent mold growth (EPA, Feb 2026).
- Remediation and other waste services employed 32,210 hazardous materials removal workers in May 2025 (BLS, Occupational Employment and Wage Statistics, May 2025).
- Florida voided post-loss assignment of benefits on property policies issued on or after January 1, 2023 (Florida Legislature, Dec 2022).
Which Government Codes Cover Restoration Work?
No single code covers the trade, so any total is a proxy. The code used most often here, 562910, is the best available, and it is a partial view.
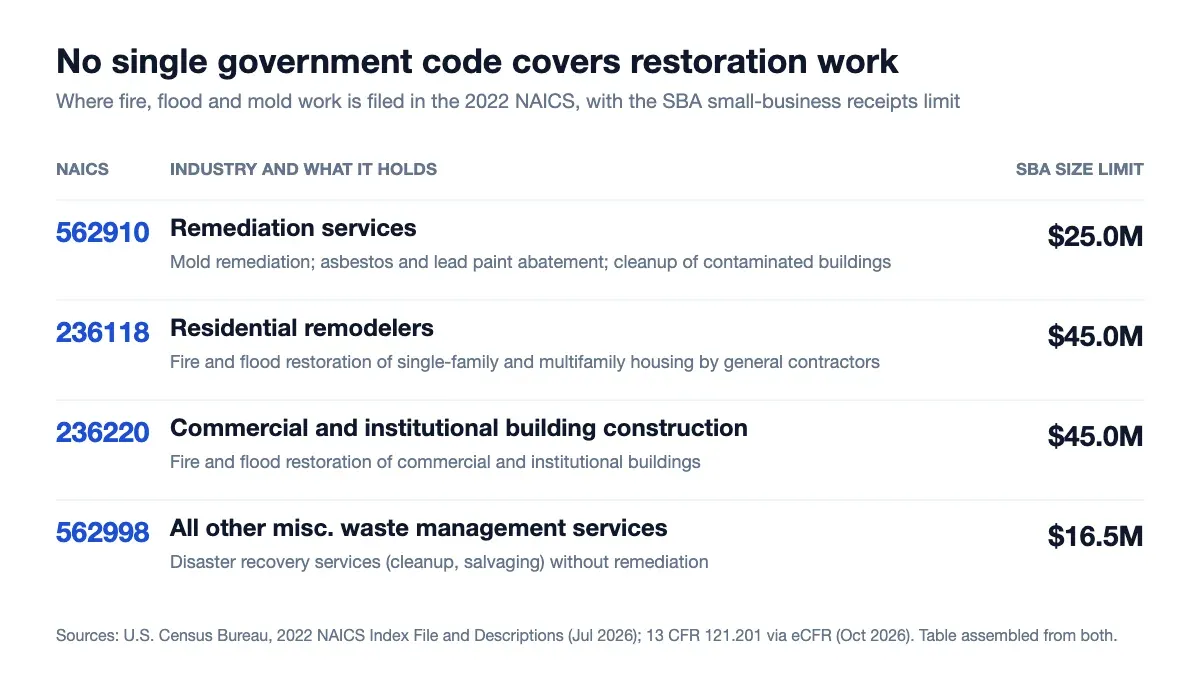 Figure 1: Restoration work is split across remediation and construction codes, and each carries a different small-business limit. Source: U.S. Census Bureau, 2022 NAICS Index File, Jul 2026, and 13 CFR 121.201 via eCFR, Oct 2026. Table assembled by this site from both sources, captured 21 Oct 2026.
What does NAICS 562910 include?
- Code 562910 covers remediation and cleanup of contaminated buildings, mine sites, soil or ground water, plus asbestos, lead paint and other toxic material abatement (Census Bureau, NAICS, Jul 2026).
- Mold remediation services are indexed to 562910 (Census Bureau, NAICS, Jul 2026).
- Disaster recovery services such as cleanup and salvaging, without remediation, are indexed to 562998 instead (Census Bureau, NAICS, Jul 2026).
How does the SBA size limit compare across these codes?
- The SBA small-business limit for remediation services is $25.0 million in average annual receipts (eCFR, 13 CFR 121.201, Oct 2026).
- Residential remodelers, which hold single-family fire and flood restoration by general contractors, have a $45.0 million limit (eCFR, 13 CFR 121.201, Oct 2026).
- All other miscellaneous waste management services, which hold disaster recovery work, have a $16.5 million limit (eCFR, 13 CFR 121.201, Oct 2026).
- Plumbing, heating and air-conditioning contractors have a $19.0 million limit (eCFR, 13 CFR 121.201, Oct 2026).
How Big Is the Water Restoration Industry?
Receipts rose sharply between the last two censuses. The numbers below are nominal dollars, so part of the gain is price growth.
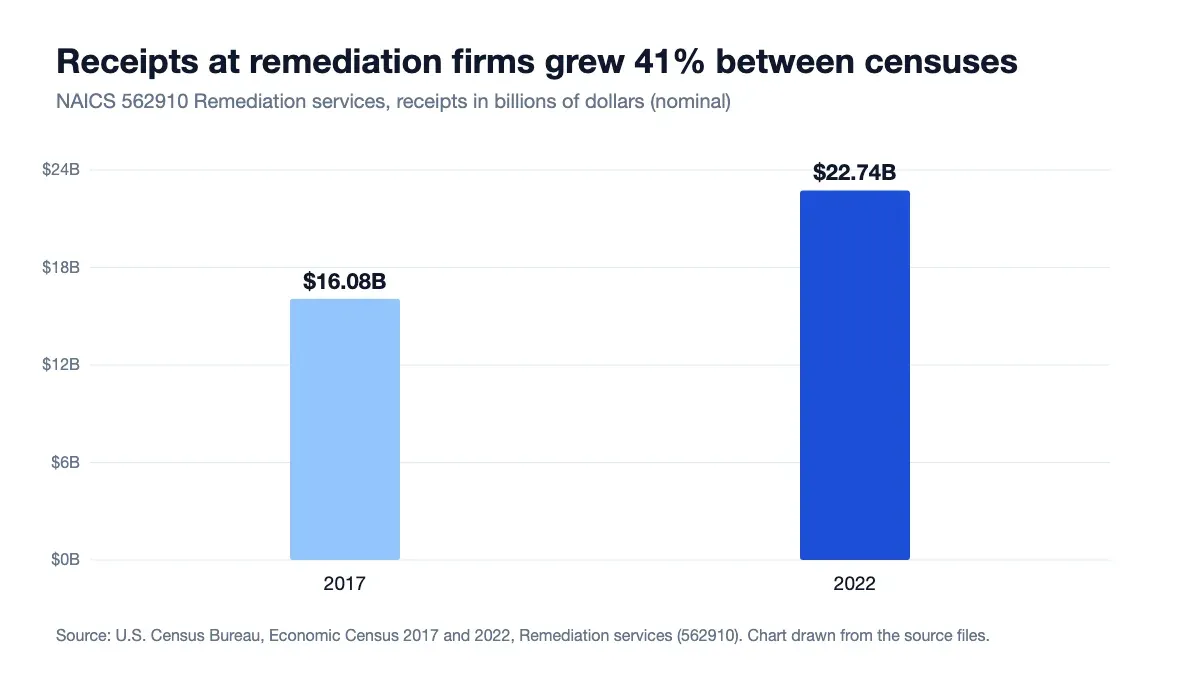 Figure 2: Receipts at remediation firms grew 41% in five years, from $16.08 billion to $22.74 billion in nominal dollars. Source: U.S. Census Bureau, Economic Census 2022, Dec 2024, and Economic Census 2017, Jun 2020. Chart drawn by this site from the source files, captured 21 Oct 2026.
How much do remediation firms pay out?
- Annual payroll at remediation firms was $6.19 billion in 2022 (Census Bureau, Economic Census, Dec 2024).
- It was $4.72 billion in 2017 (Census Bureau, Economic Census, Jun 2020).
- Employer payroll in the 2023 County Business Patterns file reached $7.06 billion (Census Bureau, County Business Patterns, Jun 2025).
- Payroll in the 2019 file was $5.58 billion (Census Bureau, County Business Patterns, Apr 2021).
- Payroll in the 2012 file was $4.42 billion (Census Bureau, County Business Patterns, Nov 2015).
How does it compare with the wider waste and remediation group?
- The whole remediation and other waste management services group (NAICS 5629) had $41.07 billion in 2022 receipts (Census Bureau, Economic Census, Dec 2024).
- The sister code for miscellaneous waste services (562998), which holds disaster recovery work, had $3.59 billion in receipts and 1,279 firms (Census Bureau, Economic Census, Dec 2024).
What do wages add up to?
- Private-sector wages in the closest code totaled $8.65 billion in 2025 (BLS, Quarterly Census of Employment and Wages, Aug 2026).
- They were $8.21 billion in 2024 (BLS, Quarterly Census of Employment and Wages, Sep 2025).
How Many Restoration Firms Operate in the US?
The count has climbed for a decade, with a small dip in 2023. Federal programs count differently, so use each one for its own trend.
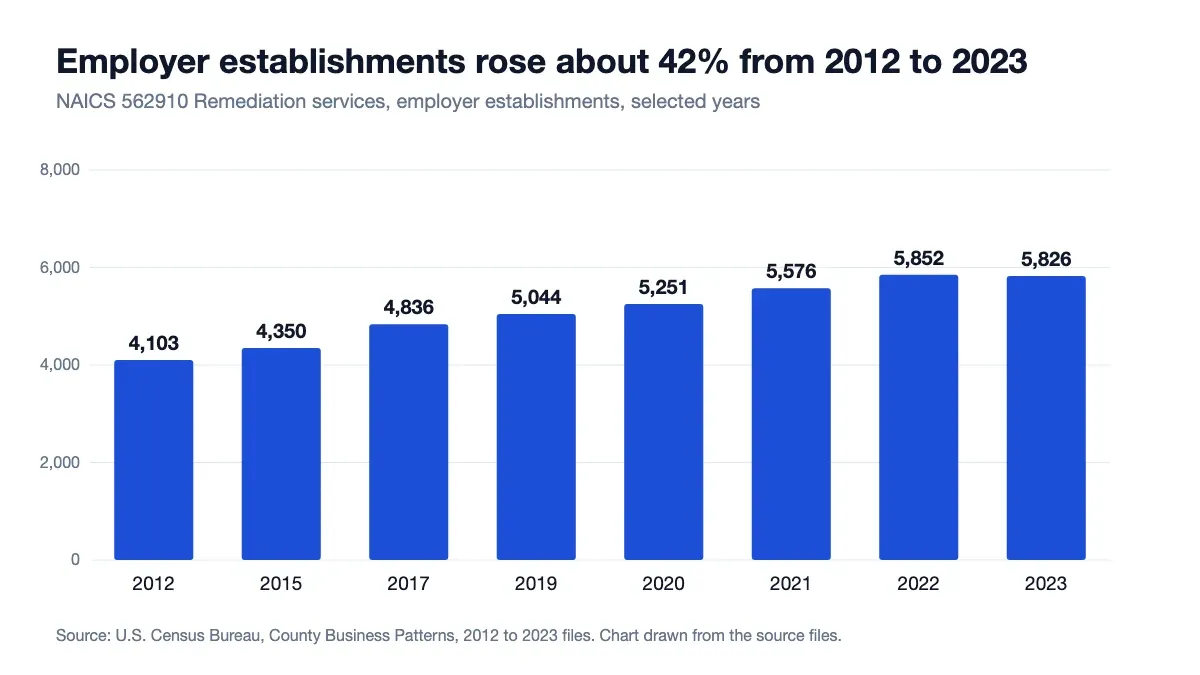 Figure 3: Employer establishments in the closest federal code rose about 42% from 2012 to 2023, with 2023 slightly below 2022. Source: U.S. Census Bureau, County Business Patterns, Jun 2025. Chart drawn by this site from the 2012 to 2023 source files, captured 21 Oct 2026.
How many establishments are there by year?
- There were 5,044 establishments in 2019 (Census Bureau, County Business Patterns, Apr 2021).
- There were 5,251 in 2020 (Census Bureau, County Business Patterns, Apr 2022).
- There were 5,852 in 2022 (Census Bureau, County Business Patterns, Jun 2024).
- The Economic Census counted 5,926 establishments in 2022 (Census Bureau, Economic Census, Dec 2024).
- It counted 4,809 in 2017 (Census Bureau, Economic Census, Jun 2020).
What does the BLS count?
- The BLS counted 9,227 private establishments in 2025 (BLS, Quarterly Census of Employment and Wages, Aug 2026).
- It counted 8,979 in 2024 (BLS, Quarterly Census of Employment and Wages, Sep 2025).
- It counted 7,205 in 2020 (BLS, Quarterly Census of Employment and Wages, Aug 2021).
- It counted 9,365 in the first quarter of 2026 (BLS, Quarterly Census of Employment and Wages, Aug 2026).
How many disaster recovery establishments sit next door?
- Code 562998 had 1,568 employer establishments in 2023 (Census Bureau, County Business Patterns, Jun 2025).
How Many People Work in Restoration?
About 100,000 people are on payrolls in the closest code, and the trend points up. Workforce data for the trade itself is thin, so the occupation figures below come from the hazmat removal job, which is the nearest match.
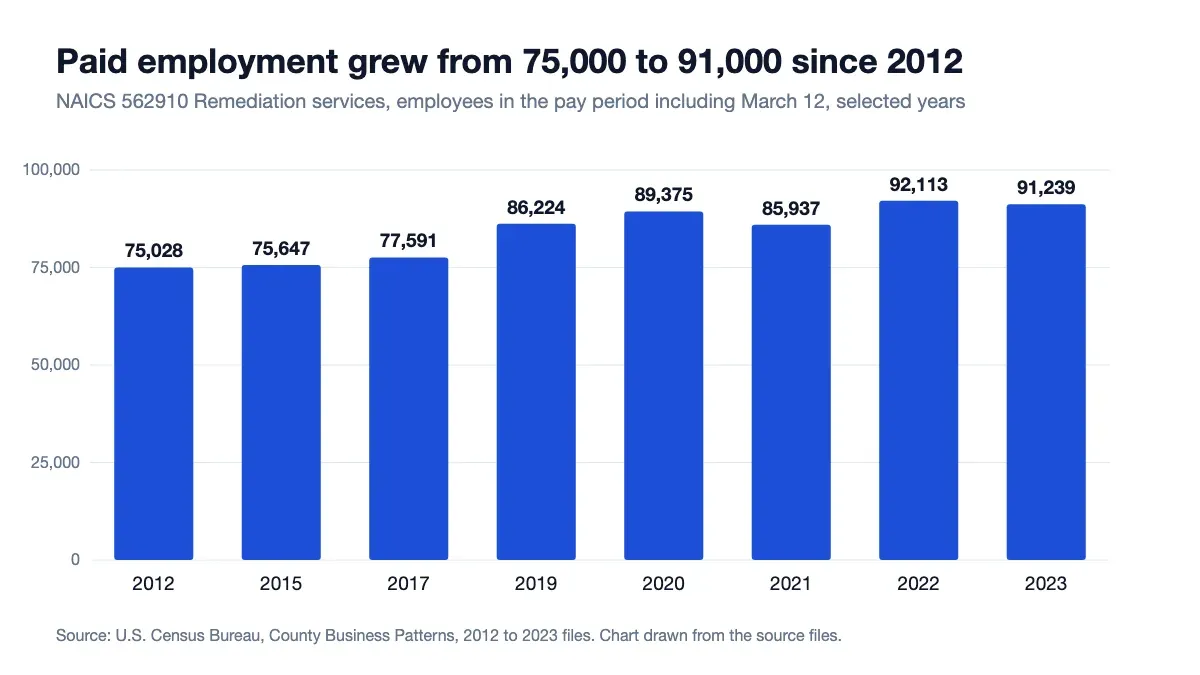 Figure 4: Paid employment in the closest federal code grew from 75,028 to 91,239 between 2012 and 2023, with a dip in 2021. Source: U.S. Census Bureau, County Business Patterns, Jun 2025. Chart drawn by this site from the 2012 to 2023 source files, captured 21 Oct 2026.
How many employees do the Census files show?
- Employment was 86,224 in 2019 (Census Bureau, County Business Patterns, Apr 2021).
- It was 89,375 in 2020 (Census Bureau, County Business Patterns, Apr 2022).
- It fell to 85,937 in 2021 (Census Bureau, County Business Patterns, Apr 2023).
- It rose to 92,113 in 2022 (Census Bureau, County Business Patterns, Jun 2024).
- The Economic Census counted 97,300 employees in 2022 (Census Bureau, Economic Census, Dec 2024).
- It counted 85,402 in 2017 (Census Bureau, Economic Census, Jun 2020).
- The disaster recovery code, 562998, had 18,982 employees in 2023 (Census Bureau, County Business Patterns, Jun 2025).
What does the BLS show?
- Average employment was 87,806 in 2020 (BLS, Quarterly Census of Employment and Wages, Aug 2021).
- It was 98,932 in 2024 (BLS, Quarterly Census of Employment and Wages, Sep 2025).
- March 2026 employment was 96,785 (BLS, Quarterly Census of Employment and Wages, Aug 2026).
How many hazmat removal workers are there?
- The US had 51,710 hazardous materials removal workers in May 2025 (BLS, Occupational Employment and Wage Statistics, May 2025).
- Employment for the job is projected to grow 2% from 2025 to 2035 (BLS, Occupational Outlook Handbook, Aug 2026).
- That is about 800 more jobs over the decade (BLS, Occupational Outlook Handbook, Aug 2026).
- The usual entry requirement is a high school diploma or equivalent (BLS, Occupational Outlook Handbook, Aug 2026).
What Do Restoration Workers Earn?
Pay varies a lot by state. The industry average is well above what a hazmat removal worker makes, because the code covers other jobs too.
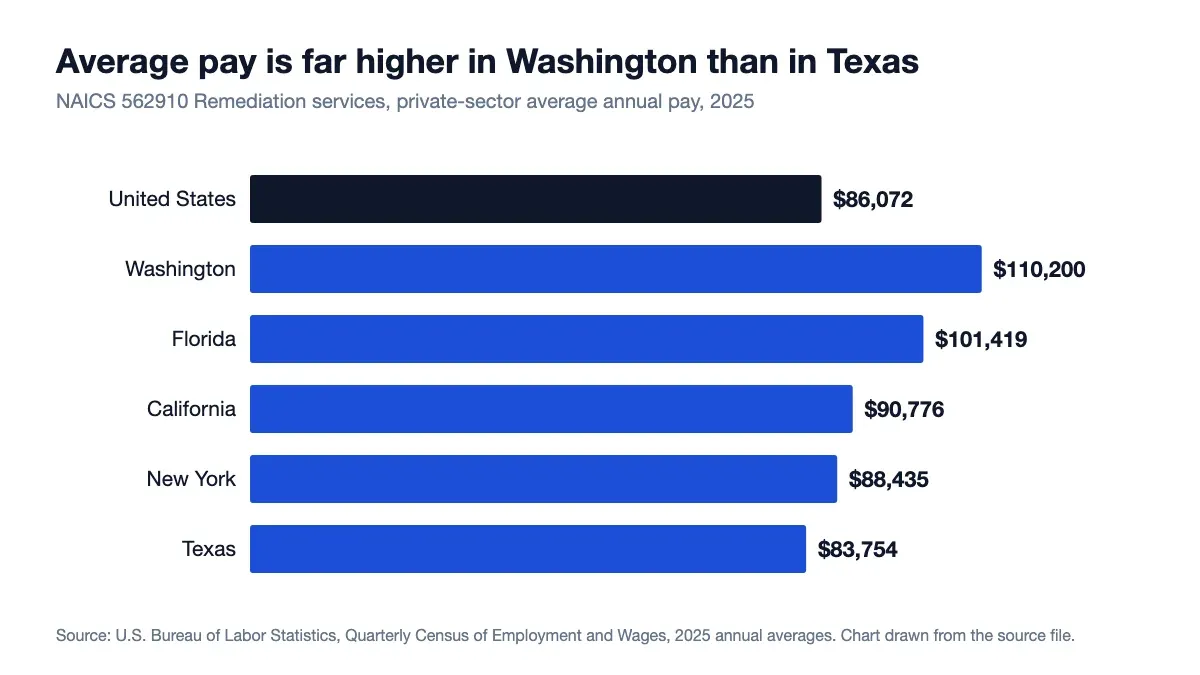 Figure 5: Average pay is $26,446 higher in Washington than in Texas for the same federal code. Source: U.S. Bureau of Labor Statistics, Quarterly Census of Employment and Wages, Aug 2026. Chart drawn by this site from the 2025 annual averages, captured 21 Oct 2026.
How much is average pay across the industry?
- Average annual pay was $86,072 in 2025 (BLS, Quarterly Census of Employment and Wages, Aug 2026).
- That was up 3.7% from 2024 (BLS, Quarterly Census of Employment and Wages, Aug 2026).
- Average annual pay was $82,967 in 2024 (BLS, Quarterly Census of Employment and Wages, Sep 2025).
- It was $70,199 in 2020 (BLS, Quarterly Census of Employment and Wages, Aug 2021).
- The average weekly wage was $1,655 in 2025 (BLS, Quarterly Census of Employment and Wages, Aug 2026).
- It was $1,620 in the first quarter of 2026 (BLS, Quarterly Census of Employment and Wages, Aug 2026).
How do pay levels differ by state?
- Washington averaged $110,200 in 2025 (BLS, Quarterly Census of Employment and Wages, Aug 2026).
- Florida averaged $101,419 (BLS, Quarterly Census of Employment and Wages, Aug 2026).
- California averaged $90,776 (BLS, Quarterly Census of Employment and Wages, Aug 2026).
- New York averaged $88,435 (BLS, Quarterly Census of Employment and Wages, Aug 2026).
- Texas averaged $83,754 (BLS, Quarterly Census of Employment and Wages, Aug 2026).
What do hazmat removal workers earn?
- The mean annual wage for the job was $56,430 nationwide in May 2025 (BLS, Occupational Employment and Wage Statistics, May 2025).
- The mean hourly wage was $27.13 (BLS, Occupational Employment and Wage Statistics, May 2025).
- The median annual wage was $49,450 (BLS, Occupational Employment and Wage Statistics, May 2025).
- Within remediation and other waste services, the mean annual wage for the job was $54,890 (BLS, Occupational Employment and Wage Statistics, May 2025).
How Small Is the Typical Restoration Shop?
Small. Nearly half of establishments have fewer than 5 employees, and the Census shows firms of that size account for only a sliver of revenue. A shop with a handful of people is the norm, not the exception.
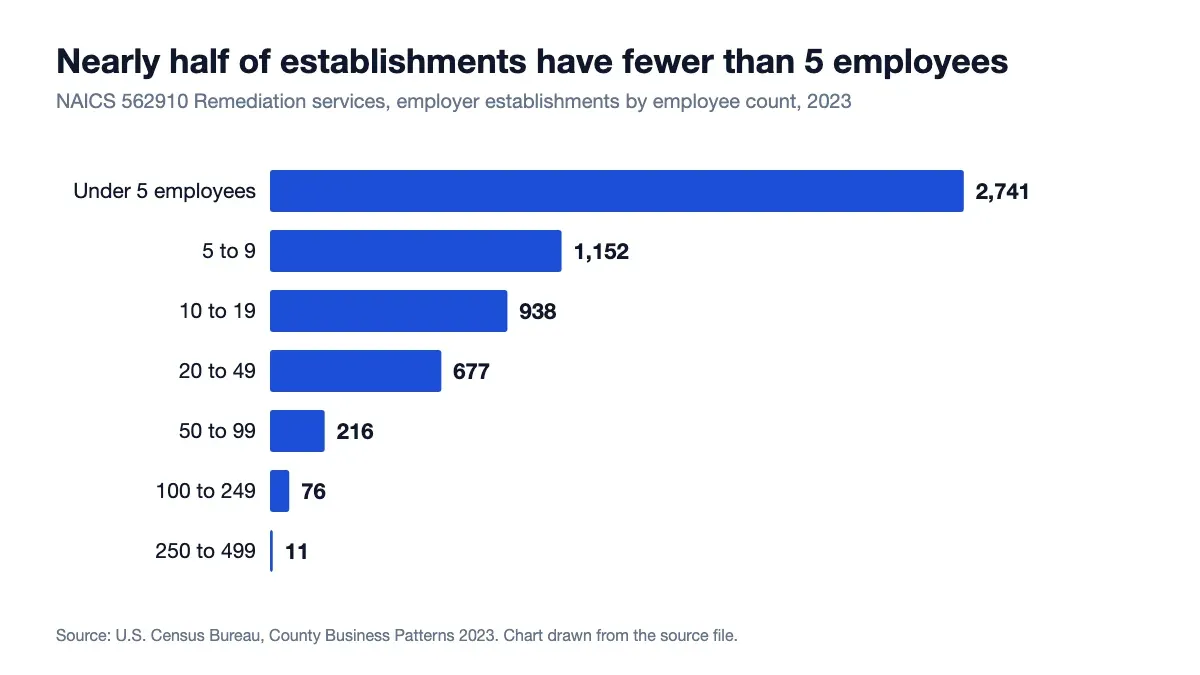 Figure 6: Establishment counts fall steadily as size rises, from 2,741 with fewer than 5 employees to 11 with 250 to 499. Source: U.S. Census Bureau, County Business Patterns, Jun 2025. Chart drawn by this site from the 2023 source file, captured 21 Oct 2026.
How many establishments have 5 or more employees?
- 1,152 establishments had 5 to 9 employees (Census Bureau, County Business Patterns, Jun 2025).
- 938 had 10 to 19 employees (Census Bureau, County Business Patterns, Jun 2025).
- 677 had 20 to 49 (Census Bureau, County Business Patterns, Jun 2025).
- 216 had 50 to 99 (Census Bureau, County Business Patterns, Jun 2025).
- 76 had 100 to 249 (Census Bureau, County Business Patterns, Jun 2025).
How many firms are small, counted by company?
- The Census counted 2,381 firms with fewer than 5 employees in 2022, and together they employed 3,864 people (Census Bureau, Statistics of U.S. Businesses, Apr 2025).
- 878 firms had 5 to 9 employees (Census Bureau, Statistics of U.S. Businesses, Apr 2025).
- 679 firms had 10 to 19 employees (Census Bureau, Statistics of U.S. Businesses, Apr 2025).
- 3,938 firms had fewer than 20 employees and booked $4.57 billion in receipts (Census Bureau, Statistics of U.S. Businesses, Apr 2025).
How much revenue does a typical firm earn?
- 535 firms had under $100,000 in receipts (Census Bureau, Statistics of U.S. Businesses, Apr 2025).
- 1,332 firms had $100,000 to $499,999 (Census Bureau, Statistics of U.S. Businesses, Apr 2025).
- 749 firms had $500,000 to $999,999 (Census Bureau, Statistics of U.S. Businesses, Apr 2025).
- 968 firms had $1 million to $2,499,999 (Census Bureau, Statistics of U.S. Businesses, Apr 2025).
Do a Few Large Companies Hold Most of the Revenue?
Not most, but a lot. A tiny group of big firms takes a third of the money, while the many small shops split a small share. That is the gap a small shop is competing against.
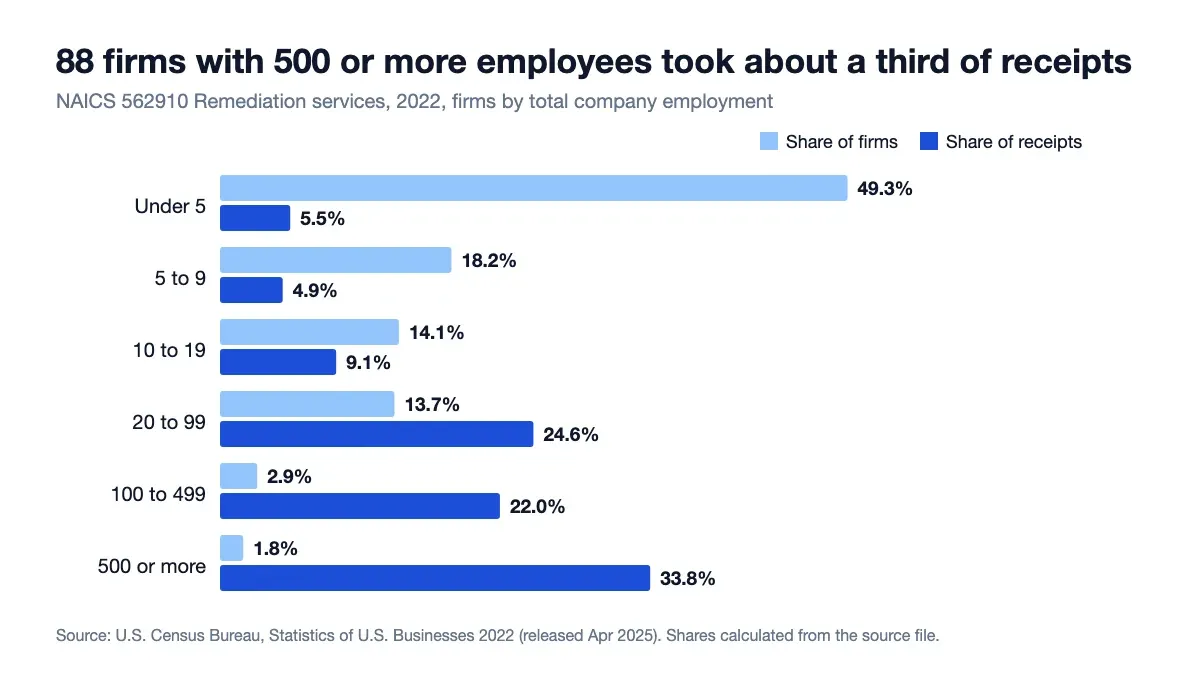 Figure 7: Firms with fewer than 5 employees are 49.3% of firms and 5.5% of receipts, while firms with 500 or more employees are 1.8% of firms and 33.8% of receipts. Source: U.S. Census Bureau, Statistics of U.S. Businesses 2022, Apr 2025. Shares calculated by this site from the source file, captured 21 Oct 2026.
What do the largest firms look like?
- Firms with 500 or more employees operated 748 establishments (Census Bureau, Statistics of U.S. Businesses, Apr 2025).
- They employed 29,269 people (Census Bureau, Statistics of U.S. Businesses, Apr 2025).
- Firms with 100 to 499 employees booked $5.14 billion in receipts (Census Bureau, Statistics of U.S. Businesses, Apr 2025).
- 111 firms with $100 million or more in receipts took $9.86 billion (Census Bureau, Statistics of U.S. Businesses, Apr 2025).
What does the biggest public owner say about the market?
- FirstService describes the industry as highly fragmented and made up mostly of small local businesses, with only a few national players in restoration (FirstService, Annual Information Form 2025, Feb 2026).
Which States Have the Most Restoration Firms?
California, Florida, Texas and New York lead on both firm counts and revenue, but the order changes with the measure. Florida has more establishments than New York and about half the revenue.
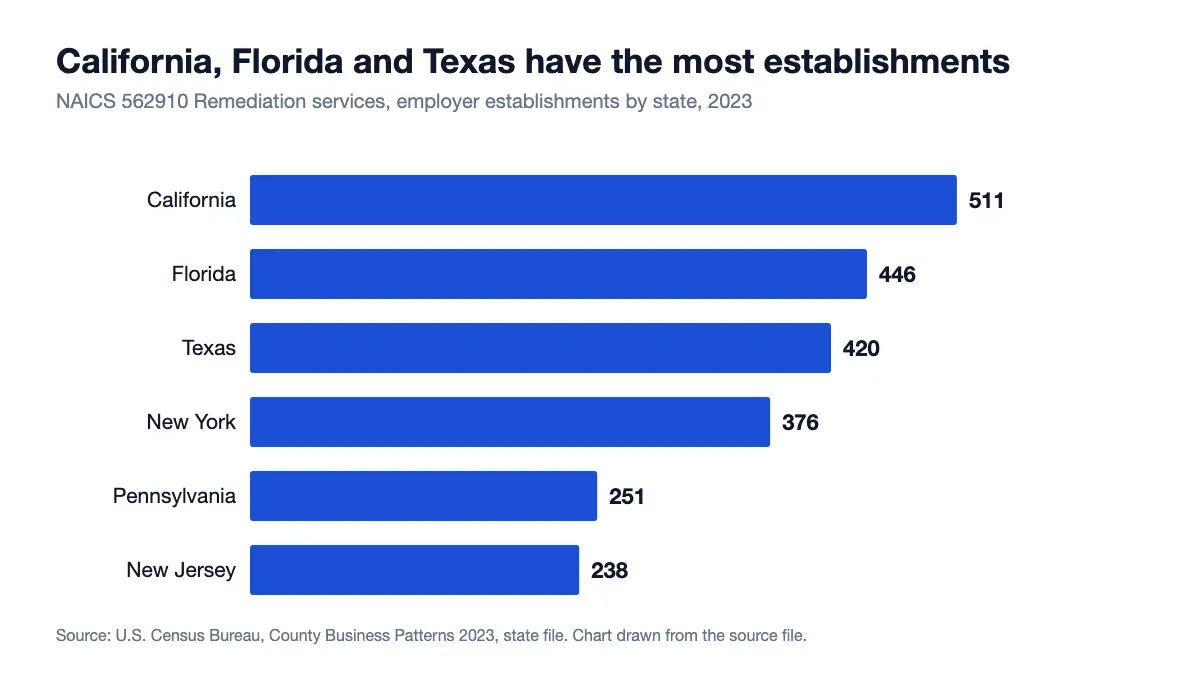 Figure 8: California, Florida and Texas have the most remediation establishments, with New York close behind. Source: U.S. Census Bureau, County Business Patterns 2023 state file, Jun 2025. Chart drawn by this site from the source file, captured 21 Oct 2026.
How many establishments does each state have?
- Pennsylvania had 251 establishments in 2023 (Census Bureau, County Business Patterns, Jun 2025).
- New Jersey had 238 (Census Bureau, County Business Patterns, Jun 2025).
- Colorado had 218 (Census Bureau, County Business Patterns, Jun 2025).
- Washington had 182 (Census Bureau, County Business Patterns, Jun 2025).
Where are the jobs?
- California had 8,662 employees in 2023 (Census Bureau, County Business Patterns, Jun 2025).
- Texas had 6,906 (Census Bureau, County Business Patterns, Jun 2025).
- New York had 6,898 (Census Bureau, County Business Patterns, Jun 2025).
- Washington had 4,863 employees on only 182 establishments (Census Bureau, County Business Patterns, Jun 2025).
Where is the revenue?
- California firms booked $2.36 billion in 2022 (Census Bureau, Economic Census, Dec 2024).
- Texas booked $2.18 billion (Census Bureau, Economic Census, Dec 2024).
- New York booked $1.88 billion (Census Bureau, Economic Census, Dec 2024).
- Florida booked $1.03 billion (Census Bureau, Economic Census, Dec 2024).
Who Are the Franchise and National Restoration Players?
One franchise system dwarfs the rest, and the national players split into residential franchises and commercial large-loss firms. The private ones publish little financial detail, so the figures here are what the companies state about themselves.
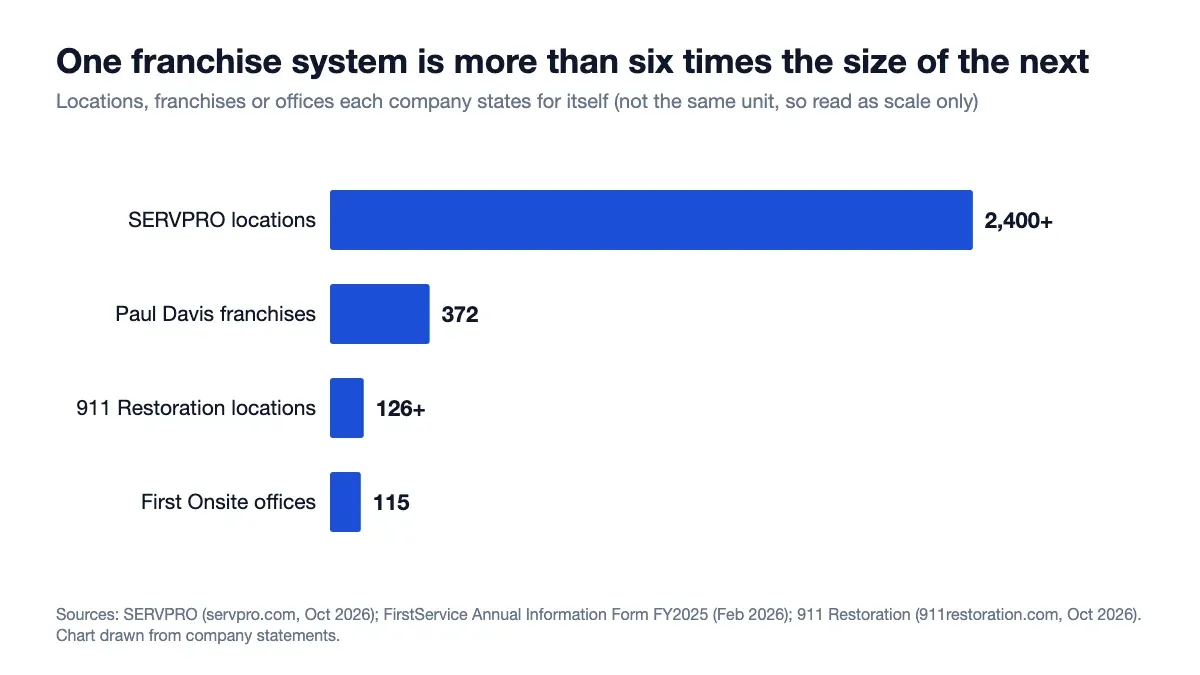 Figure 9: SERVPRO states more than 2,400 locations, more than six times the 372 franchises at Paul Davis. The units differ (locations, franchises, offices), so read the bars as scale only. Source: FirstService, Annual Information Form 2025, Feb 2026, and company websites, Oct 2026. Chart drawn by this site from company statements, captured 21 Oct 2026.
What do SERVPRO and Paul Davis report?
- SERVPRO says it was founded in 1967 (SERVPRO, Oct 2026).
- FirstService Brands acquired Paul Davis Restoration in 1997 (FirstService, Annual Information Form 2025, Feb 2026).
- FirstService owns and runs 16 Paul Davis operations itself, beside the franchises (FirstService, Annual Information Form 2025, Feb 2026).
- 911 Restoration states 126 or more locations in the United States and Canada (911 Restoration, Oct 2026).
- It says it covers more than 9,000 ZIP codes (911 Restoration, Oct 2026).
What do the large-loss firms report?
- First Onsite Restoration calls itself the second largest commercial and large loss restoration firm in North America (FirstService, Annual Information Form 2025, Feb 2026).
- It was founded in 1998 (FirstService, Annual Information Form 2025, Feb 2026).
- It employs about 2,600 staff (FirstService, Annual Information Form 2025, Feb 2026).
- It works from about 115 regional offices (FirstService, Annual Information Form 2025, Feb 2026).
- FirstService bought it in 2019 under the name Global Restoration (FirstService, Annual Information Form 2025, Feb 2026).
- The restoration unit carried $560.0 million of goodwill at the end of 2025, more than roofing or fire protection (FirstService, 2025 financial statements, Feb 2026).
What does BELFOR report?
- BELFOR describes itself as a $3 billion company (BELFOR, Oct 2026).
- It operates in 34 countries (BELFOR, Oct 2026).
- It employs more than 14,000 people (BELFOR, Oct 2026).
How Much Restoration Work Is Driven by Insurance?
Insurance is central to how the big brands sell. No public figure gives the share of jobs paid by a claim, so the evidence here is how the companies describe themselves.
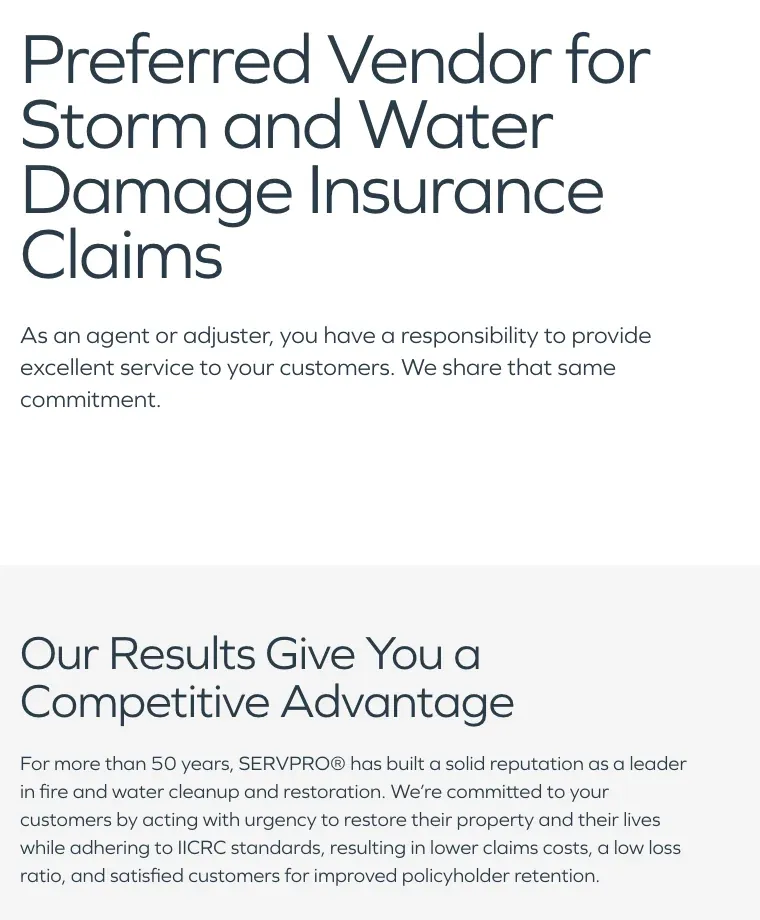 Figure 10: SERVPRO addresses insurance agents and adjusters directly and sells on lower claims costs and a low loss ratio. Source: SERVPRO, Property Damage Insurance Claims Professionals, Oct 2026. Screenshot of the source page, captured 21 Oct 2026.
How do the brands position themselves to carriers?
- Paul Davis provides water, fire and mold cleanup and construction rebuild for property damaged by natural or man-made disasters (FirstService, Annual Information Form 2025, Feb 2026).
- First Onsite lists insurance companies among its blue chip national clients (FirstService, Annual Information Form 2025, Feb 2026).
- BELFOR’s history page says its predecessor, Quality Awning & Construction, began focusing on insurance work in 1980 (BELFOR, Oct 2026).
- BELFOR bought INRECON, short for INsurance RECONstruction, in 2001, a firm it says had $180 million in annual sales and 1,000 staff (BELFOR, Oct 2026).
What do carriers require of vendors?
- SERVPRO says local franchises must agree to 21 requirements to receive insurance referrals (SERVPRO, Oct 2026).
- It offers a two-year labor warranty and a one-year materials warranty (SERVPRO, Oct 2026).
- 911 Restoration says its technicians arrive within an average of 45 minutes and document conditions for the insurance claim (911 Restoration, Oct 2026).
What did Florida require of contractors on insurance-paid jobs?
- For policies issued from July 1, 2019 to before January 1, 2023, an assignment agreement had to include a written, itemized, per-unit cost estimate (Florida Legislature, Dec 2022).
- It had to let the policyholder cancel without a fee within 14 days (Florida Legislature, Dec 2022).
- The contractor had to send the insurer a copy within 3 business days (Florida Legislature, Dec 2022).
A job paid by a carrier needs a clear, itemized estimate and a record of what was found and done. That is the daily work of a price book and a quoting tool.
Which Standards and Licenses Govern Restoration Work?
The rules are set by a private standards body, one federal agency guide and a handful of state laws. The standards are voluntary, and insurers and courts lean on them.
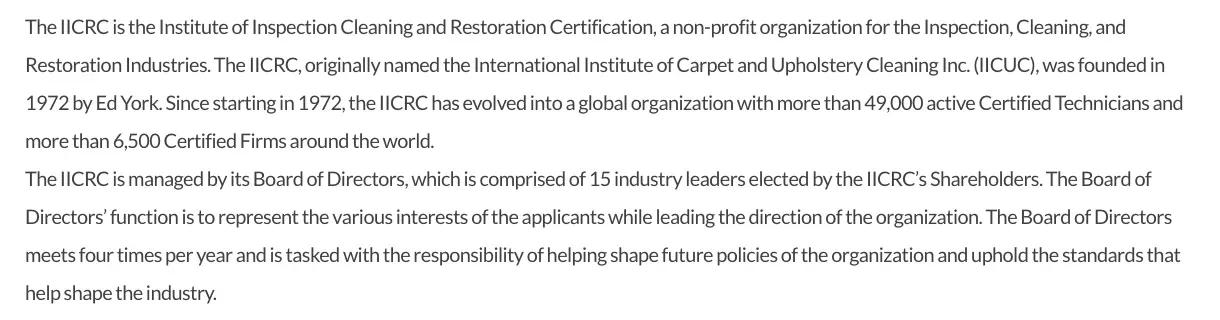 Figure 11: The IICRC states its size in its own words: a global body with more than 49,000 active certified technicians and more than 6,500 certified firms. Source: IICRC, About the IICRC, Oct 2026. Screenshot of the source page, captured 21 Oct 2026.
How is the IICRC run?
- The IICRC was founded in 1972 (IICRC, Oct 2026).
- Its board has 15 industry leaders elected by shareholders (IICRC, Oct 2026).
- The board meets four times per year (IICRC, Oct 2026).
- The Water Damage Restoration Technician certification has no prerequisites (IICRC, Oct 2026).
How often are the standards updated?
- The ANSI/IICRC S500 water damage standard is in its fifth edition, published in 2021 (IICRC, Oct 2026).
- The fourth edition came out in 2015 and the first in 1994 (IICRC, Oct 2026).
- A new S500 consensus body has begun work to revise the 2021 edition (IICRC, Oct 2026).
- The S520 mold remediation standard reached its fourth edition in 2024 (IICRC, Oct 2026).
- The S590 standard for assessing HVAC systems after water, fire or mold damage is in its first edition, from 2023 (IICRC, Oct 2026).
- The S700 fire and smoke damage standard is in its first edition, from 2025 (IICRC, Oct 2026).
- The S700 standard covers contractor qualifications, administrative requirements and documentation of project events (IICRC, Oct 2026).
- On February 10, 2026, the S500 consensus body said wind-driven rain and other weather water are not automatically Category 3 water (IICRC, S500 position statement, Feb 2026).
What do the EPA and Florida require?
- The EPA says a moldy area under about 10 square feet can usually be handled by the owner (EPA, Jun 2026).
- Florida defines mold assessment as work on mold growth of greater than 10 square feet (Florida Legislature, Oct 2026).
- Florida requires documented training for mold assessors from July 1, 2011 (Florida Legislature, Oct 2026).
Standards call for records on every job: moisture readings, drying logs and what was replaced. Shops that quote and invoice from the same system keep those records with the price.
Glossary
- AOB: assignment of benefits, a policyholder signing over insurance claim rights to a contractor.
- ANSI: American National Standards Institute, which approves consensus standards.
- CBP: County Business Patterns, the Census Bureau’s yearly count of employer establishments.
- IICRC: Institute of Inspection Cleaning and Restoration Certification, the standards and certification body for restoration.
- NAICS: North American Industry Classification System, the federal code list for industries.
- OEWS: Occupational Employment and Wage Statistics, the BLS survey of jobs and pay by occupation.
- QCEW: Quarterly Census of Employment and Wages, the BLS count of jobs and wages from unemployment insurance records.
- SBA: Small Business Administration.
- SUSB: Statistics of U.S. Businesses, the Census Bureau series that counts firms by size.
- WRT: Water Damage Restoration Technician, an IICRC certification.
Methodology and Sources
Every figure comes from the agency, standards body or company that published it, and every link opens the file or page that holds the number. Census and BLS figures were read from the downloaded data files. Government files are dated by their release month. Company, association and statute pages show no publication date, so they carry the month they were read, October 2026. No single federal code isolates water damage restoration, so NAICS 562910 is used as a proxy; it also covers asbestos, lead and mold work, and it leaves out restoration done by general contractors under construction codes. Census and BLS count establishments differently, so their totals do not match, and the Statistics of U.S. Businesses totals differ slightly from the Economic Census because that series blends County Business Patterns with the Economic Census. The page is refreshed monthly.
Sources
- Census Bureau, County Business Patterns files
- Census Bureau, Economic Census 2022, sector 56
- Census Bureau, Economic Census 2017, sector 56
- Census Bureau, Statistics of U.S. Businesses 2022
- Census Bureau, 2022 NAICS files
- BLS, Quarterly Census of Employment and Wages
- BLS, Occupational Employment and Wage Statistics
- BLS, Occupational Outlook Handbook, hazardous materials removal workers
- eCFR, 13 CFR 121.201
- IICRC
- FirstService, Annual Information Form 2025
- SERVPRO
- BELFOR
- 911 Restoration
- EPA, A Brief Guide to Mold, Moisture and Your Home
- Florida Legislature, SB 2-A (2022)