Legionnaires disease statistics describe an infection that people catch from the plumbing and water equipment of buildings, which makes it a trade problem as much as a medical one. The bacteria grow in warm, still water in water heaters, pipes, showers, cooling towers and hot tubs, and people get sick when they breathe the mist. This page collects figures from public health agencies, regulators and peer reviewed studies. Where a number is provisional or modeled, the page says so.
The main US count comes from the CDC, which tracks reported cases through the National Notifiable Diseases Surveillance System. Reported cases are a floor, because many pneumonia patients are never tested for Legionella. Every figure below is dated and linked to the document it came from.
The page covers case counts, who gets sick, deaths, where people catch it, outbreak sources, hot water and plumbing conditions, water management rules, costs, Europe and the rest of the world. It does not cover water heater sales or drinking water quality, which have their own pages: water heater statistics and drinking water statistics. For the trade that installs and repairs this plumbing, see plumbing industry statistics.
Key Takeaways
- Reported US incidence rose from 0.42 cases per 100,000 people in 2000 to a provisional 2.9 in 2025 (CDC, Legionellosis Surveillance and Trends, Jul 2026).
- 9,933 confirmed cases were reported in 2018, the peak year (CDC, Surveillance Summary Report 2018-2019, Dec 2022).
- About 1 in 10 people with Legionnaires’ disease die, and about 1 in 4 when they catch it in a healthcare facility (CDC, About Legionnaires’ Disease, Aug 2025).
- 97% of patients with a known hospitalization status were hospitalized in both 2020 and 2021 (CDC, Surveillance Summary Report 2020-2021, Jan 2026).
- CDC estimates that 8,000 to 18,000 people are hospitalized with Legionnaires’ disease each year in the US (EPA, Legionella, Dec 2025).
- Potable water was the source in 15 of 27 outbreaks CDC investigated from 2000 to 2014, or 56% (MMWR, Vital Signs 2016, Jun 2016).
- In CDC outbreak investigations from 2015 to 2019, 43% of the buildings had no water management program (CDC, Outbreaks and Water Management Gaps, Mar 2024).
- An Upper East Side cluster in New York City reached 94 cases and 11 deaths by August 28 (NYC Health Department, Legionnaires’ Disease, Oct 2026).
- CDC says to store hot water above 140°F and keep circulating hot water at 120°F or higher (CDC, Monitoring Building Water, Mar 2024).
- In the Netherlands, 21 of 23 patients in a case-control study had a new water heater of one brand installed in the 6 months before they fell ill (Emerging Infectious Diseases, Dutch Water Heaters, Jul 2026).
- The Flint, Michigan outbreak of 2014 and 2015 totaled 87 cases (PNAS, Flint Outbreak Assessment, Feb 2018).
- A hospital stay for Legionnaires’ disease cost about $37,300 on average in direct healthcare payments in 2014 dollars (Emerging Infectious Diseases, Waterborne Disease Burden, Jan 2021).
- The EU and EEA reported 15,362 cases in 2024, a rate of 3.4 per 100,000 people (ECDC, Annual Epidemiological Report for 2024, May 2026).
How Many People Get Legionnaires’ Disease in the US Each Year?
The reported rate is several times what it was in 2000, and the official count still misses patients who were never tested. Treat every national number as a minimum.
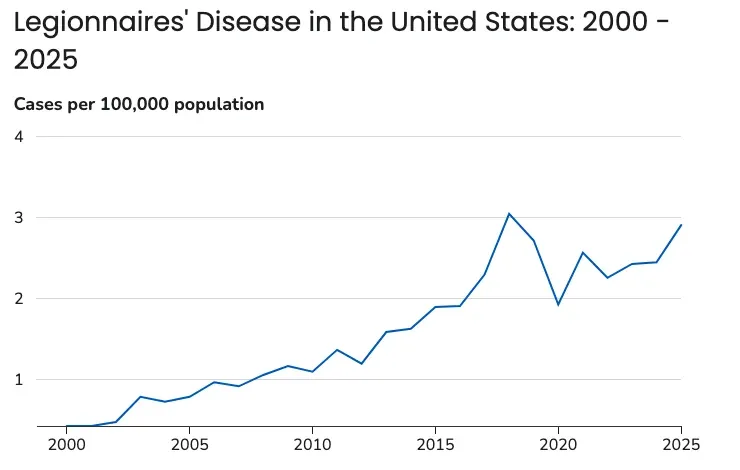 Figure 1: Reported US incidence climbed for almost two decades, dipped in 2020 and has stayed well above the levels of the 2000s. The last two years are provisional. Source: CDC, Legionellosis Surveillance and Trends, Jul 2026. Chart published by the source, captured 21 Oct 2026.
How has the reported rate changed since 2000?
The rate rose in almost every year from 2003 until 2018. After 2018 it fell during the first year of the COVID-19 pandemic and has since settled at a higher level than before 2017.
- Reported incidence peaked at 3.04 cases per 100,000 in 2018 (CDC, Surveillance Summary Report 2020-2021, Jan 2026).
- Incidence fell by more than 35% to 1.92 per 100,000 in 2020 and rebounded to 2.56 in 2021 (CDC, Surveillance Summary Report 2020-2021, Jan 2026).
- The CDC data file shows 2.42 per 100,000 for 2023 and a provisional 2.44 for 2024 (CDC, Legionellosis Surveillance and Trends, Jul 2026).
- The age-standardized average was 0.48 cases per 100,000 during 1992 to 2002, against 2.71 in 2018 (Emerging Infectious Diseases, Rising Incidence, Mar 2022).
How many cases are reported each year?
Annual counts moved from about 5,000 in 2014 to nearly 10,000 in 2018. The count in 2021 was close to the 2019 level again.
- The count was 8,890 in 2019 (CDC, Surveillance Summary Report 2018-2019, Dec 2022).
- The counts were 6,310 in 2020 and 8,442 in 2021, and 6 jurisdictions may have under-reported 2020 because of COVID-19 (CDC, Surveillance Summary Report 2020-2021, Jan 2026).
Are the reported numbers the full picture?
No. Most cases are never tied to an outbreak, and the common urine test finds only one type of the bacteria.
- Only 4% of reported cases during 2000 to 2014 were outbreak-associated (MMWR, Vital Signs 2016, Jun 2016).
- In Canada, modeling found that only 36% of illnesses were captured in surveillance, or 2.8 illnesses for every reported case (Epidemiology and Infection, Canada Burden Estimate, Jan 2024).
- The same Canadian study estimated that 22% of illnesses were caused by types other than Legionella pneumophila serogroup 1 (Epidemiology and Infection, Canada Burden Estimate, Jan 2024).
Which States Lead the Legionella Statistics?
The Northeast and Midwest report the highest rates, and the gap between the top and bottom states is wide.
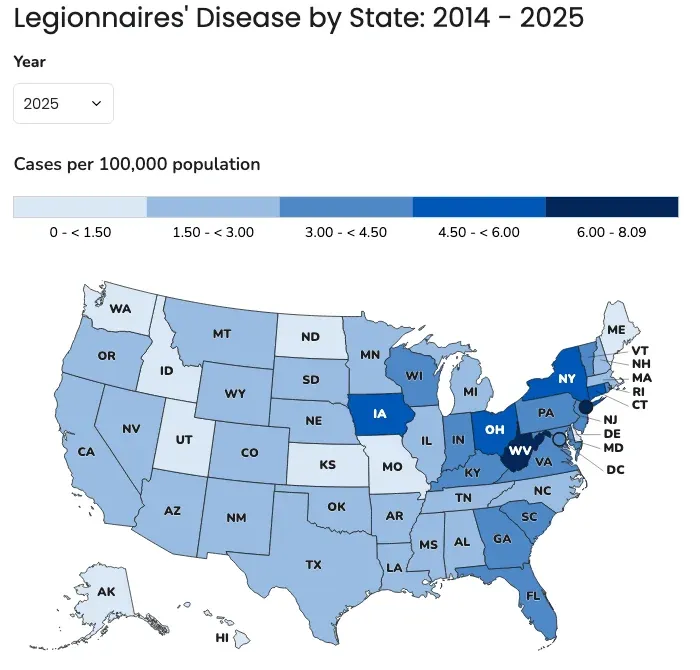 Figure 2: Ohio, New York, Iowa, West Virginia and the Northeast carry the darkest shades, while the Mountain West and Plains states report far fewer cases per person. Source: CDC, Legionellosis Surveillance and Trends, Jul 2026. Chart published by the source, captured 21 Oct 2026.
Which states report the highest rates?
The 2025 figures are provisional. New York City and West Virginia led the country.
- New York City reported 7.8 cases per 100,000 people in 2025, and West Virginia reported 7.18 (CDC, Legionellosis Surveillance and Trends, Jul 2026).
- Ohio reported 5.93 per 100,000 in 2025, and Iowa reported 5.34 (CDC, Legionellosis Surveillance and Trends, Jul 2026).
Why do the Northeast and Midwest stand out?
Three census divisions keep coming up in CDC reports. Researchers have not explained why.
- Incidence in 2020 and 2021 tended to be higher in the East North Central, Middle Atlantic and New England divisions (CDC, Surveillance Summary Report 2020-2021, Jan 2026).
When in the year do cases peak?
Cases rise in summer and fall. The pandemic showed how much travel and building use matter.
- CDC lists summer and fall months among the periods with the highest reported rates (CDC, Legionellosis Surveillance and Trends, Jul 2026).
- Seasonality was less pronounced in 2020, with a clear low in spring 2020 during the strictest shelter-in-place and business closure orders (CDC, Surveillance Summary Report 2020-2021, Jan 2026).
Who Gets Legionnaires’ Disease?
Age is the strongest marker, followed by sex, race and smoking. The pattern is steady from year to year.
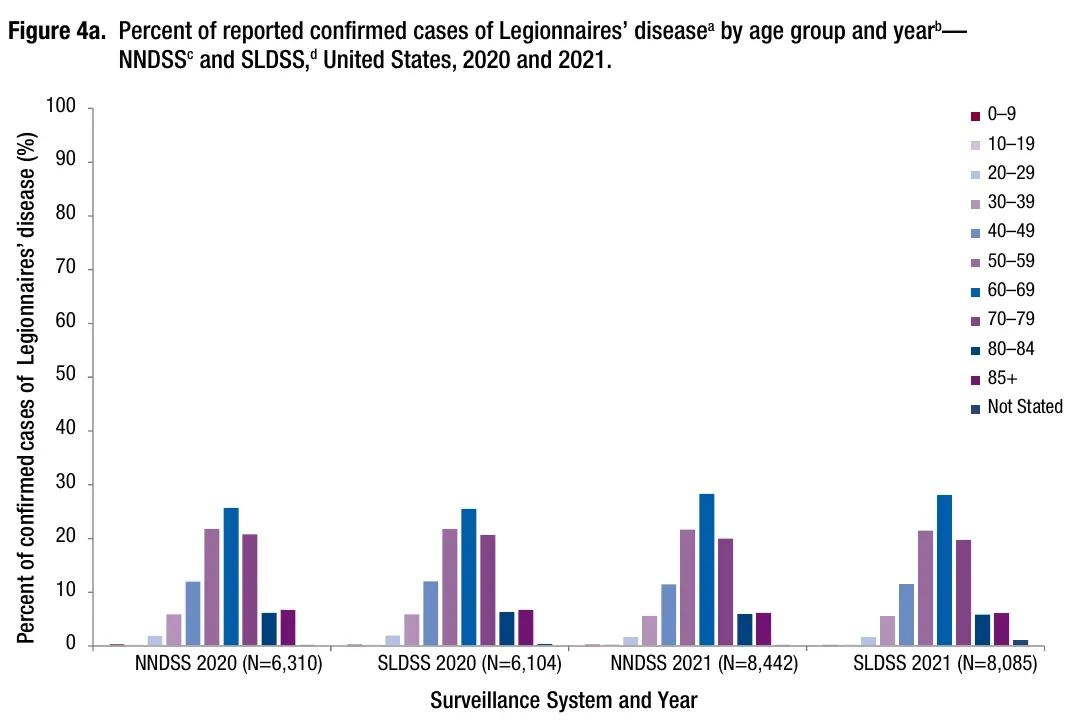 Figure 3: Cases cluster in people aged 50 to 79, with the 60 to 69 group the largest in both years. Source: CDC, Surveillance Summary Report 2020-2021, Jan 2026. Chart published by the source, captured 21 Oct 2026.
How does age change the risk?
Four in five reported cases are in people who are 50 or older. Incidence keeps rising up to the oldest age group.
- In 2020, 80% of reported cases were in people aged 50 or older, and in 2021 the share was 81% (CDC, Surveillance Summary Report 2020-2021, Jan 2026).
- People aged 85 or older had incidence of 6.88 per 100,000 in 2020 and 8.43 in 2021 (CDC, Surveillance Summary Report 2020-2021, Jan 2026).
Who is more likely to be diagnosed by sex and race?
Men and Black Americans have the highest rates. Most cases are still in White patients, because that group is larger.
- Males were 63% of cases in both 2020 and 2021, with rates of 2.41 and 3.23 per 100,000 (CDC, Surveillance Summary Report 2020-2021, Jan 2026).
- Black or African American people were 21% of 2020 cases at 2.73 per 100,000, against White people at 63% of cases and 1.55 per 100,000 (CDC, Surveillance Summary Report 2020-2021, Jan 2026).
- In New York City from 2019 to 2022, the average annual rate was 6.7 per 100,000 for Black non-Latino residents and 2.2 for White non-Latino residents (NYC Health Department, Annual Surveillance Report, Aug 2024).
- The New York City average rate was 5.3 per 100,000 for men and 2.4 for women over the same four years (NYC Health Department, Annual Surveillance Report, Aug 2024).
Which health conditions and habits raise the risk?
Chronic illness and smoking show up in most patient histories.
- More than 90% of New York City patients from 2019 to 2022 had at least one chronic medical condition (NYC Health Department, Annual Surveillance Report, Aug 2024).
- More than 50% of those patients were current or former smokers (NYC Health Department, Annual Surveillance Report, Aug 2024).
- Diabetes was the most common condition at 31%, followed by lung disease at 28.5% (NYC Health Department, Annual Surveillance Report, Aug 2024).
How Deadly Is Legionnaires’ Disease?
It is a hospital disease with a high death rate, and the risk is highest in older patients and in patients who caught it in a healthcare facility.
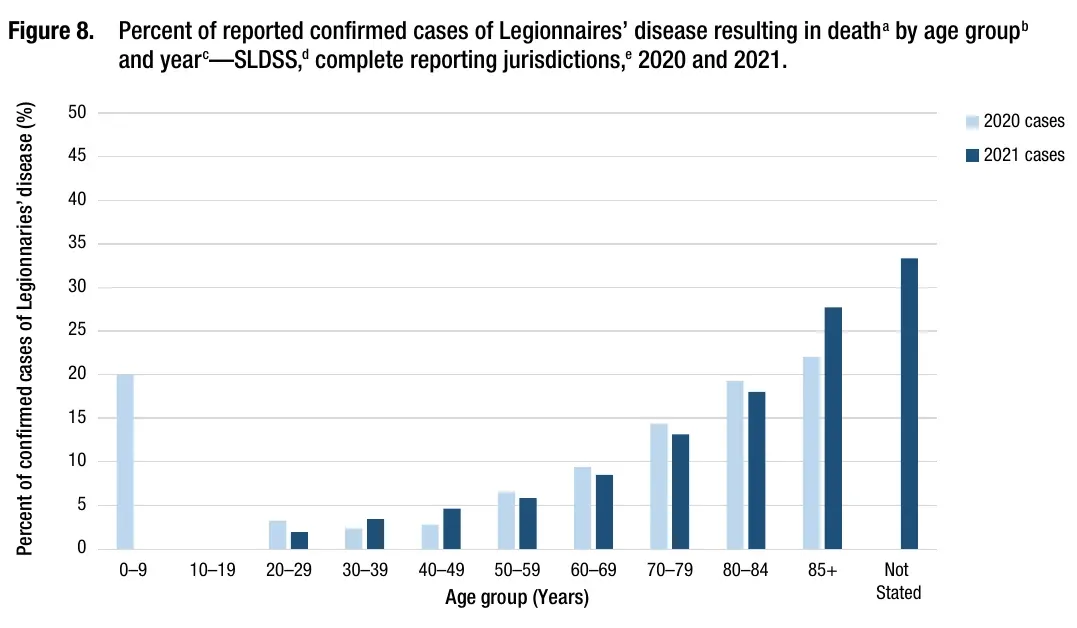 Figure 4: The share of patients who died climbs with age and reaches 22% in 2020 and 28% in 2021 for people aged 85 or older. Source: CDC, Surveillance Summary Report 2020-2021, Jan 2026. Chart published by the source, captured 21 Oct 2026.
How many patients end up in the hospital?
Almost everyone with a confirmed case is admitted. That is why one case costs so much.
- Hospitalization rates ranged from 95% to 100% across age groups in 2020 and from 93% to 100% in 2021 (CDC, Surveillance Summary Report 2020-2021, Jan 2026).
What is the case fatality rate?
The fatality rate in the supplemental surveillance data was higher in 2020 and 2021 than in 2018 and 2019.
- The case fatality rate for Legionnaires’ disease was 6% in 2018 and 7% in 2019 (CDC, Surveillance Summary Report 2018-2019, Dec 2022).
- It was 10% in both 2020 and 2021 (CDC, Surveillance Summary Report 2020-2021, Jan 2026).
- The World Health Organization puts the usual death rate at 5% to 10% (WHO, Legionellosis, Sep 2022).
- WHO says the death rate may reach 40% to 80% in untreated immunosuppressed patients and can fall to 5% to 30% with appropriate case management (WHO, Legionellosis, Sep 2022).
How does the death rate change by setting?
Where a person caught the infection matters as much as who they are.
- The case fatality rate was 17% for patients with a healthcare exposure in 2020 and 16% in 2021 (CDC, Surveillance Summary Report 2020-2021, Jan 2026).
- Among presumptive healthcare-associated cases the rate was 29% in 2020 and 37% in 2021 (CDC, Surveillance Summary Report 2020-2021, Jan 2026).
Where Do People Catch Legionnaires’ Disease?
Most patients did not report a hospital stay, an overnight trip or a senior living stay in the 14 days before symptoms. That is why building water in general gets the attention.
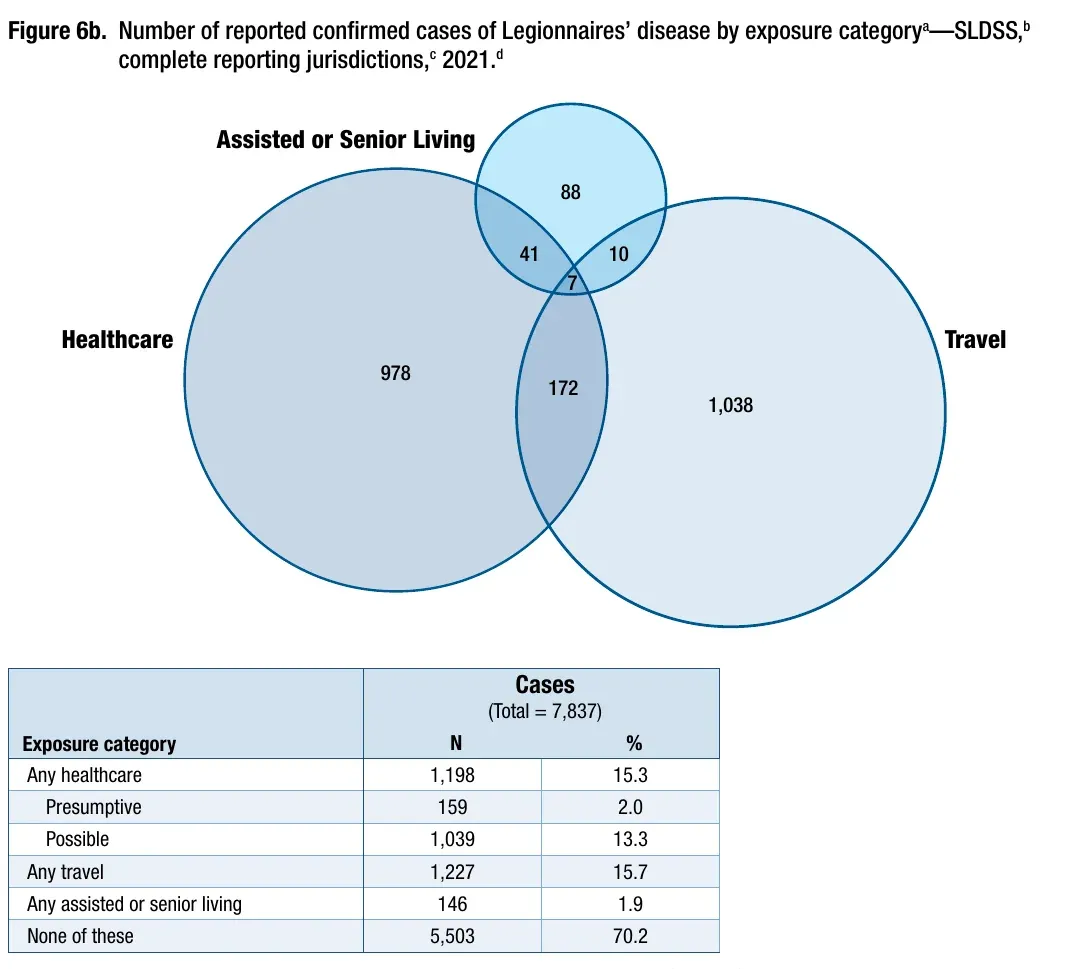 Figure 5: Healthcare, travel and senior living overlap, and 5,503 of 7,837 cases in complete reporting jurisdictions had none of the three exposures. Source: CDC, Surveillance Summary Report 2020-2021, Jan 2026. Chart published by the source, captured 21 Oct 2026.
What share of cases link to healthcare, travel or senior living?
The unexplained share is the largest single group in every year.
- In 2020, 14% of patients had a healthcare exposure, 10% a travel exposure and 3% an assisted or senior living exposure (CDC, Surveillance Summary Report 2020-2021, Jan 2026).
- In 2021, 15% had a healthcare exposure, 16% a travel exposure and 2% a senior living exposure (CDC, Surveillance Summary Report 2020-2021, Jan 2026).
Where do travelers stay when they get sick?
Public lodging dominates, but private rentals appear in the data too.
- Of 585 patients with a travel exposure in 2020, 370 (63%) reported at least one public accommodation and 165 (28%) reported private accommodations only (CDC, Surveillance Summary Report 2020-2021, Jan 2026).
- Of 1,227 patients with a travel exposure in 2021, 728 (59%) reported public accommodation and 287 (23%) private accommodations only (CDC, Surveillance Summary Report 2020-2021, Jan 2026).
- Hotels and resorts were the setting for 12 of 27 CDC-investigated outbreaks from 2000 to 2014, or 44% (MMWR, Vital Signs 2016, Jun 2016).
What about assisted and senior living?
The numbers are small but the patients are frail.
- Of 148 patients with an assisted or senior living exposure in 2020, 75 (51%) had been in an assisted living facility and 54 (37%) in a senior living facility (CDC, Surveillance Summary Report 2020-2021, Jan 2026).
What Causes Legionnaires’ Disease Outbreaks?
CDC’s field investigations point at the same short list every time: potable water, cooling towers and hot tubs, in hotels, care homes and hospitals, with preventable maintenance gaps behind them.
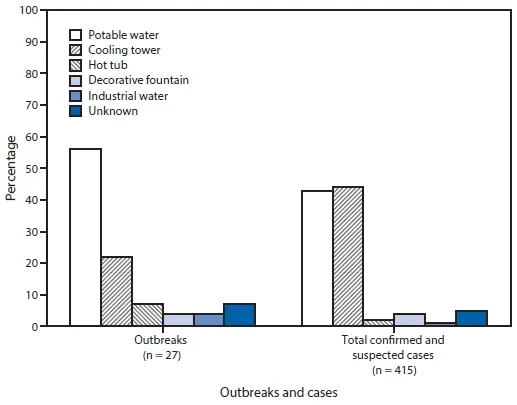 Figure 6: Potable water caused the most outbreaks, but cooling towers caused about as many cases because their plumes reach more people. Source: MMWR, Vital Signs 2016, Jun 2016. Chart published by the source, captured 21 Oct 2026.
What sources caused the outbreaks?
The investigations looked at the sources, settings and maintenance records behind each outbreak.
- The 27 land-based outbreaks involved 415 confirmed and suspected cases and 65 deaths (MMWR, Vital Signs 2016, Jun 2016).
- All 27 outbreaks were caused by Legionella pneumophila serogroup 1 (MMWR, Vital Signs 2016, Jun 2016).
- Cooling towers caused 6 outbreaks (22%), hot tubs 2 (7%), industrial equipment 1 (4%) and a decorative fountain 1 (4%) (MMWR, Vital Signs 2016, Jun 2016).
- The median cooling tower outbreak had 22 cases, against 10 for potable water outbreaks (MMWR, Vital Signs 2016, Jun 2016).
Where do outbreaks happen?
Care settings account for the most deaths.
- Healthcare-associated outbreaks accounted for 57% of cases and 85% of deaths (MMWR, Vital Signs 2016, Jun 2016).
- The median outbreak lasted 49 days from first to last case, and 98 days when potable water was the source (MMWR, Vital Signs 2016, Jun 2016).
What maintenance failures sat behind the outbreaks?
Every outbreak with enough information had at least one failure, and most failures were in routine plumbing and water treatment.
- Of 27 outbreaks, 23 had enough information to review, and all 23 had at least one deficiency (MMWR, Vital Signs 2016, Jun 2016).
- Process failures appeared in 65% of those, human errors in 52%, equipment failures in 35% and unmanaged external changes in 35% (MMWR, Vital Signs 2016, Jun 2016).
- Sixteen investigations (70%) found inadequate disinfectant levels, and 12 (52%) found water temperatures in the range best for Legionella growth (MMWR, Vital Signs 2016, Jun 2016).
- Among 7 outbreaks tied to external changes, nearby construction and problems with water mains were each noted 3 times, or 43% (MMWR, Vital Signs 2016, Jun 2016).
- Three buildings had a water management program before the outbreak, and the authors concluded those programs were inadequate (MMWR, Vital Signs 2016, Jun 2016).
How Big Are Cooling Tower, Hot Tub and Community Outbreaks?
The large outbreaks below involved cooling towers, hot tubs and a city water system that lost its disinfectant. They show how fast the numbers grow.
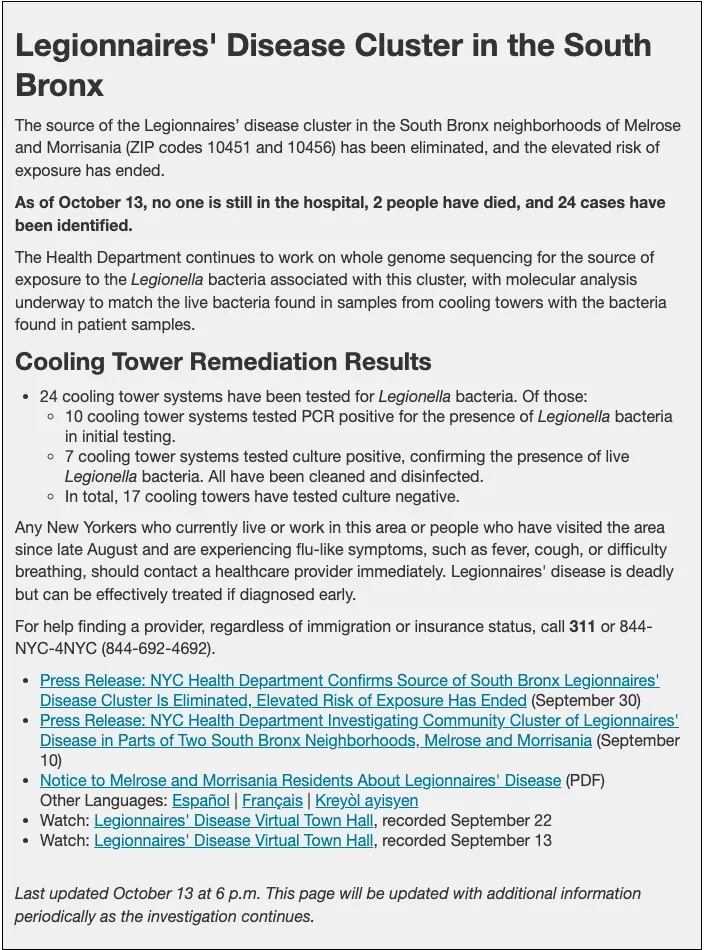 Figure 7: New York City counted 24 cases and 2 deaths in a South Bronx cluster and tested 24 cooling tower systems, finding live bacteria in 7. Source: NYC Health Department, Legionnaires’ Disease, Oct 2026. Screenshot of the source page, captured 21 Oct 2026.
What do the recent New York clusters show?
The city found live bacteria in dozens of towers in a single summer.
- In the Upper East Side cluster, 183 cooling towers at 160 buildings were tested for Legionella (NYC Health Department, Legionnaires’ Disease, Oct 2026).
- Of those, 77 towers tested PCR positive in initial testing, and 59 towers at 58 buildings tested culture positive and were cleaned and disinfected (NYC Health Department, Legionnaires’ Disease, Oct 2026).
- In the South Bronx cluster, 10 of 24 tested cooling tower systems were PCR positive and 7 were culture positive (NYC Health Department, Legionnaires’ Disease, Oct 2026).
- A July and August 2025 outbreak in Central Harlem had 118 confirmed cases and 7 deaths (NEJM Evidence, Central Harlem Outbreak, Jun 2026).
- The health department opened the investigation on the day its daily cluster analysis flagged 8 positive urine antigen tests, and it sampled 43 cooling tower systems by day 3 (NEJM Evidence, Central Harlem Outbreak, Jun 2026).
- Whole-genome sequencing linked the available patient isolates to two cooling towers on the same city block (NEJM Evidence, Central Harlem Outbreak, Jun 2026).
What did earlier New York outbreaks show?
The 2015 outbreaks took weeks to trace, and they led to the city’s cooling tower law.
- The 2015 South Bronx outbreak had 138 cases, the largest on record in the city, and the outbreak zone had 25.7 cases per 100,000 against 0.6 in the rest of the city (Emerging Infectious Diseases, New York City Cooling Towers, Nov 2017).
- Investigators found 55 cooling towers in that zone, 22 tested PCR positive for Legionella pneumophila serogroup 1 and 14 were culture positive (Emerging Infectious Diseases, New York City Cooling Towers, Nov 2017).
- A hotel cooling tower was remediated 14 days after the outbreak was recognized and was confirmed as the source by genome sequencing after 26 days (Emerging Infectious Diseases, New York City Cooling Towers, Nov 2017).
- A second 2015 Bronx outbreak had 15 cases and 64 registered cooling towers in its zone, and 12 of 50 screened towers were PCR positive, 8 of them culture positive (Emerging Infectious Diseases, New York City Cooling Towers, Nov 2017).
- Six community outbreaks since 2006 caused 213 cases and 18 deaths in the city (Emerging Infectious Diseases, New York City Cooling Towers, Nov 2017).
How many New Yorkers are diagnosed each year?
Counts moved a lot from year to year, even in one city.
- New York City records 200 to 700 Legionnaires’ disease diagnoses each year among 8.5 million residents (NYC Health Department, Annual Surveillance Report, Aug 2024).
- The city counted 164 reported cases in 2010 and a peak of 656 in 2018 (NYC Health Department, Annual Surveillance Report, Aug 2024).
- It counted 438 cases in 2019 and 358 in 2022 (NYC Health Department, Annual Surveillance Report, Aug 2024).
What happened in Napa?
A town that normally sees one or two cases a year had 17 in five weeks.
- Napa County usually has a baseline of one or two Legionnaires’ disease cases a year, and 6 were confirmed by July 21, 2022 (MMWR, Napa County Outbreak, Dec 2023).
- Between July 11 and August 15, 2022, investigators found 17 cases, 16 hospitalizations, 10 intensive care admissions and 5 patients on ventilators, and 1 patient died (MMWR, Napa County Outbreak, Dec 2023).
- A clog in the pipe to the chemical feed system of one cooling tower led to low or no biocide injection, and it was detected in early July and resolved in early August (MMWR, Napa County Outbreak, Dec 2023).
How do hot tubs and other water features cause outbreaks?
Hot tubs keep water warm and make mist, which is the combination that spreads the bacteria.
- A North Carolina fair outbreak in 2019 involved 136 people with legionellosis, of whom 98 (72%) were hospitalized and 4 (3%) died (Public Health Reports, North Carolina Fair Outbreak, Mar 2023).
- People who walked past hot tub displays at the fair had 10 times the adjusted odds of illness, and complete treatment records were not kept (Public Health Reports, North Carolina Fair Outbreak, Mar 2023).
- Twelve cases on two cruise ships were linked to private balcony hot tubs, and Legionella was found in 6 of 10 balcony tubs on ship A and in all 8 on ship B (MMWR, Cruise Ship Hot Tubs, Oct 2024).
- Hot tubs typically hold water at 100°F to 104°F, a range favorable for Legionella and one that speeds disinfectant decay (MMWR, Vacation Rental Hot Tub, Jun 2026).
- A Tennessee church outbreak in 2023 had 16 people with symptoms, 9 with a positive test and 7 hospitalized, and 5 of 17 environmental samples grew Legionella, including 4 from a jetted baptismal font (Journal of Environmental Health, Church Baptismal Font, Apr 2025).
Can a city water system cause an outbreak?
Yes, when disinfectant disappears from the water.
- After Flint switched its water source, the odds of a resident having Legionnaires’ disease rose 6.3-fold (PNAS, Flint Outbreak Assessment, Feb 2018).
- When weekly average free chlorine fell below 0.5 mg/L the odds of a case in a neighborhood rose 2.9-fold, and below 0.2 mg/L they rose 3.9-fold (PNAS, Flint Outbreak Assessment, Feb 2018).
- A northern Minnesota outbreak that began in April 2023 reached 34 confirmed cases, 30 hospitalizations and 2 deaths (Emerging Infectious Diseases, Minnesota Chloramine, Jan 2026).
- Before chloramine disinfection, Legionella was found in 1 of 16 distribution system samples but in 5 of 10 premise plumbing samples, and every sample was negative after 24 weeks of disinfection (Emerging Infectious Diseases, Minnesota Chloramine, Jan 2026).
How Common Is Legionnaires’ Disease in Healthcare Facilities?
Healthcare cases are a minority of all cases and the deadliest. Regulators now expect hospitals and nursing homes to run water management programs.
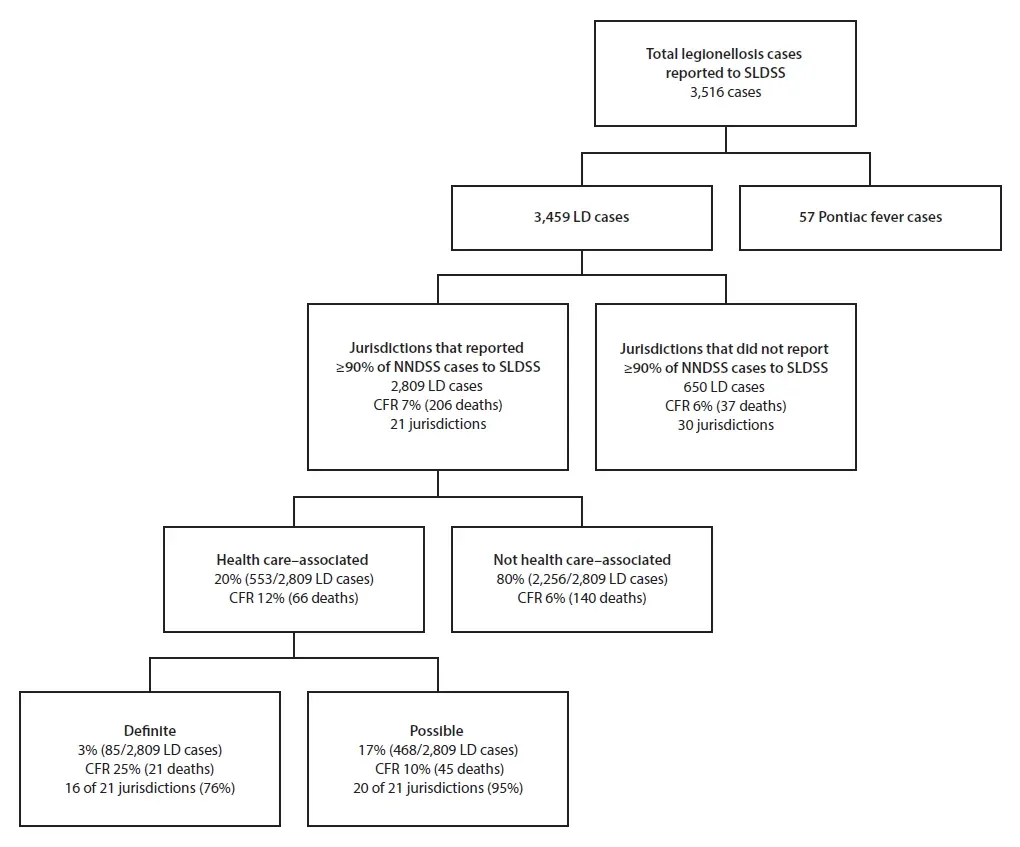 Figure 8: Health care-associated cases had a fatality rate of 12% against 6% for the rest, and the definite group reached 25%. Source: MMWR, Vital Signs 2017, Jun 2017. Chart published by the source, captured 21 Oct 2026.
How many cases come from hospitals and long-term care?
A 2015 review of 21 jurisdictions gives the clearest split.
- The review found 2,809 confirmed cases, of which 85 (3%) were definite and 468 (17%) possible health care-associated cases (MMWR, Vital Signs 2017, Jun 2017).
- Definite cases came from 72 facilities, 15 hospitals and 57 long-term care facilities (MMWR, Vital Signs 2017, Jun 2017).
- The case fatality rate was 25% for definite and 10% for possible health care-associated cases, and 88% of definite cases were in people aged 60 or older (MMWR, Vital Signs 2017, Jun 2017).
- In 2020, 178 of 857 patients with a healthcare exposure (21%) were presumptive healthcare-associated, and 61% of those were in long-term care (CDC, Surveillance Summary Report 2020-2021, Jan 2026).
What do federal rules require of care facilities?
CMS turned the industry standard into a survey expectation in 2017.
- CMS notified state survey agencies on June 2, 2017 that Medicare-certified facilities must have water management policies and procedures (CMS, Survey and Certification Letter 17-30, Jun 2017).
- The memo cites outbreak reviews showing that 19% of 2000 to 2014 outbreaks were in long-term care and 15% in hospitals (CMS, Survey and Certification Letter 17-30, Jun 2017).
- CMS noted that the rate of reported legionellosis rose 286% from 2000 to 2014 (CMS, Survey and Certification Letter 17-30, Jun 2017).
- The memo names water heaters, expansion tanks, aerators, faucet flow restrictors and ice machines among the system parts where Legionella can grow (CMS, Survey and Certification Letter 17-30, Jun 2017).
- New York State requires general hospitals and residential health care facilities to assess and sample their potable water systems for Legionella (New York State Department of Health, Protection Against Legionella, Apr 2025).
What Plumbing Conditions Let Legionella Grow?
Temperature, stagnation and the design of the hot water system decide whether the bacteria multiply. These are conditions that a plumber can see, measure and change.
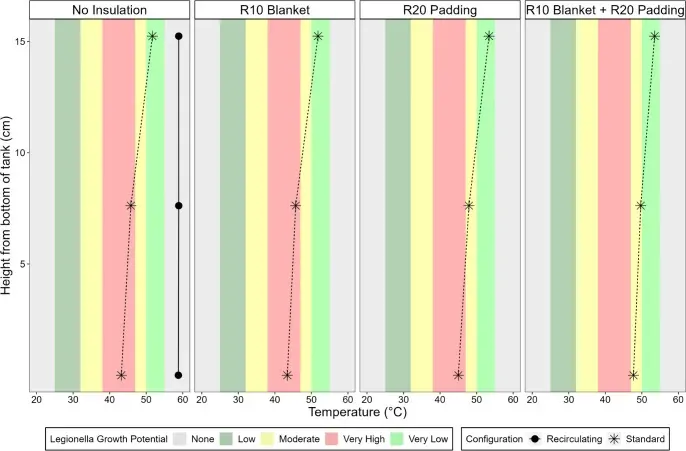 Figure 9: In a standard tank set to 66°C, the bottom of the tank sits in the very high growth band without insulation, and the thickest insulation option moves it to the edge of that band. Source: ACS ES&T Water, Water Heater Type and Temperature Study, Dec 2024. Chart published by the source (CC BY 4.0), captured 21 Oct 2026.
What temperatures allow growth?
The agencies publish slightly different ranges, so each is attributed here.
- CDC says Legionella grows best between 77°F and 113°F, and it may grow in cold water as low as 68°F (CDC, Monitoring Building Water, Mar 2024).
- CDC flags a risk when cold water rises above 77°F or warm water falls below 120°F, and it advises circulating hot water to stay at 120°F or higher (CDC, Monitoring Building Water, Mar 2024).
- WHO says the bacteria grow at 20°C to 50°C with an optimum of 35°C (WHO, Legionellosis, Sep 2022).
- WHO advises hot water above 50°C, which requires water leaving the heater at 60°C or more, and cold water below 25°C and ideally below 20°C (WHO, Legionellosis, Sep 2022).
- ECDC lists 25°C to 42°C as favorable for growth (ECDC, Annual Epidemiological Report for 2024, May 2026).
What do water heater designs and settings change?
A laboratory study measured how much water sat in the worst temperature band.
- The study rates 38°C to 47°C as very high growth potential, 50°C to 55°C as very low and above 55°C as none (ACS ES&T Water, Water Heater Type and Temperature Study, Dec 2024).
- At a 48°C setting, the volume in the very high band was 150 L for a recirculating tank system, 40 L for a standard tank and about 0.47 L for a tankless unit (ACS ES&T Water, Water Heater Type and Temperature Study, Dec 2024).
- Over a full flush and stagnation cycle, 26% of the standard tank system volume and 94% of the recirculating system volume was in the very high band (ACS ES&T Water, Water Heater Type and Temperature Study, Dec 2024).
- At a 66°C setting, the bottom 13 L of the standard tank still fell within the very high band, and the study found that adding insulation removed it (ACS ES&T Water, Water Heater Type and Temperature Study, Dec 2024).
- In a residential test house, Legionella pneumophila was found in 8.1% of 260 samples taken at 54°C and 66°C heater set points (NIST, Household Water Demand and Heater Temperature Study, Mar 2025).
- Kitchen and bathroom faucets posed a higher exposure risk than the tub and shower in that study (NIST, Household Water Demand and Heater Temperature Study, Mar 2025).
Can a new residential water heater be the source?
One European investigation says yes.
- Two clusters of 4 and 2 cases in two apartment buildings in the Netherlands were linked to newly installed water heaters, and the buildings were 16 years old (Emerging Infectious Diseases, Dutch Water Heaters, Jul 2026).
- Sequence type 37 matched a patient isolate and was found in the hot water systems of both buildings, at 100 to 1,000 CFU per liter in taps and shower hoses (Emerging Infectious Diseases, Dutch Water Heaters, Jul 2026).
- None of 31 control patients had recently installed a water heater, and the odds ratio for cases was 542 (Emerging Infectious Diseases, Dutch Water Heaters, Jul 2026).
- Only 1% to 2% of Dutch cases have a source confirmed by a genotype match with a patient isolate (Emerging Infectious Diseases, Dutch Water Heaters, Jul 2026).
What do the UK health and safety rules set for temperatures?
Britain’s Health and Safety Executive publishes the most specific numbers for plumbers.
- Cold water systems should be kept below 20°C where possible (HSE, Hot and Cold Water Systems, Oct 2024).
- Hot water should be stored at 60°C or more and reach 50°C within 1 minute at the outlets, or 55°C in healthcare premises (HSE, Hot and Cold Water Systems, Oct 2024).
- Outgoing water at the calorifier should be at least 60°C, and sentinel outlets should be checked monthly (HSE, Hot and Cold Water Systems Things to Consider, Sep 2024).
- Cold water should be below 20°C after 2 minutes of running at a sentinel tap, and the temperature at the tank ball valve outlet should be recorded every 6 months (HSE, Hot and Cold Water Systems Things to Consider, Sep 2024).
- Pipe runs downstream of a thermostatic mixing valve should not exceed 2 meters (HSE, Hot and Cold Water Systems Things to Consider, Sep 2024).
- Infrequently used outlets should be flushed weekly, and showerheads should be cleaned and descaled quarterly or as the risk assessment says (HSE, Hot and Cold Water Systems Things to Consider, Sep 2024).
- Cold water storage should be kept to about one day of use, and tanks should be linked so water flows through each one (HSE, Hot and Cold Water Systems Things to Consider, Sep 2024).
How do stagnation and dead legs add risk?
Water that sits warms up, loses disinfectant and grows biofilm.
- CDC says a prolonged period of low use can mean weeks or months, depending on plumbing factors, disinfectant, heater set point and use patterns (CDC, Reopening Buildings Guidance, Feb 2024).
- CDC advises flushing until hot water reaches its maximum temperature, with hot water at the tap at 120°F or higher where anti-scald devices allow (CDC, Reopening Buildings Guidance, Feb 2024).
- A Yorkshire outbreak of 3 cases was traced to a private cold-water system with dead legs and heat transfer into the cold-water system (Epidemiology and Infection, Yorkshire Cold-Water Outbreak, May 2025).
- At two hotels in the U.S. Virgin Islands, Legionella pneumophila was found in 3 of 21 samples (14%) at hotel A and 22 of 40 (55%) at hotel B (MMWR, U.S. Virgin Islands Hotels, Jul 2026).
What Do Water Management Programs and Rules Require?
The same gaps repeat: no program, or a program that nobody followed. Rules in New York and at federal care facilities now push owners to document the work.
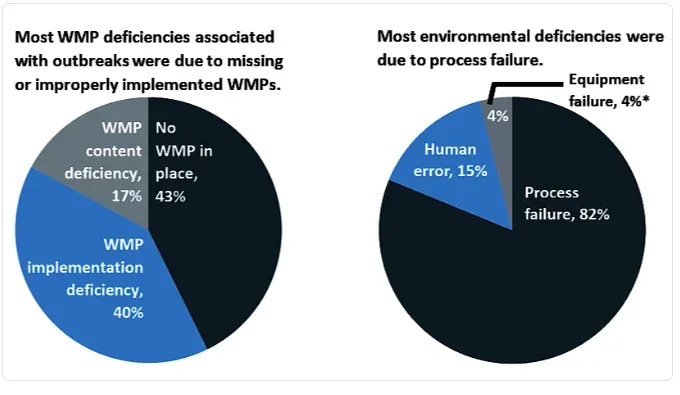 Figure 10: In CDC-led outbreak investigations from 2015 to 2019, 43% of buildings had no program and 40% had a program that was not carried out. Source: CDC, Outbreaks and Water Management Gaps, Mar 2024. Chart published by the source, captured 21 Oct 2026.
What do outbreak investigations say about programs?
A building with a written program still had outbreaks when staff skipped the steps.
- In 40% of outbreak buildings an adequate program was not followed, and 17% had a program with content deficiencies (CDC, Outbreaks and Water Management Gaps, Mar 2024).
- Of the environmental deficiencies, 82% were process failures, 15% human error and 4% equipment failure (CDC, Outbreaks and Water Management Gaps, Mar 2024).
- A review of 14 CDC-led investigations from 2015 to 2019 found that 72% of cases and 81% of deaths came from facilities with no program (Microorganisms, Outbreak Root Causes, Jan 2021).
- At facilities with programs (8), 9.1% of environmental deficiencies were attributed to plumbed devices and 0% to infrastructure design, against 33.3% and 24.2% at facilities without programs (6) (Microorganisms, Outbreak Root Causes, Jan 2021).
What does a program contain?
CDC splits the work into seven steps and ends with documentation.
- CDC lists seven steps: form a team, describe the water systems, find where Legionella could grow, set control measures, set responses when limits are missed, confirm the program works, and document everything (CDC, Water Management Programs, Mar 2024).
- CMS expects facilities to specify testing protocols and acceptable ranges, and to document test results and corrective actions (CMS, Survey and Certification Letter 17-30, Jun 2017).
- CMS cites the ASHRAE 188 standard published on June 26, 2015 as the basis for the expected programs (CMS, Survey and Certification Letter 17-30, Jun 2017).
What do the UK rules say about testing?
The UK sets a test schedule for open systems and ties tests on plumbing to a risk assessment.
- Routine Legionella testing of open systems such as cooling towers and spa pools should be done at least quarterly (HSE, Testing and Monitoring, Sep 2024).
- Hot and cold water systems usually do not need routine microbiological monitoring, unless temperatures or disinfection are not consistently met (HSE, Testing and Monitoring, Sep 2024).
- Culture methods should reach a detection limit of no more than 100 bacteria per liter (HSE, Testing and Monitoring, Sep 2024).
- HSE lists 20°C to 45°C as the water temperature range suitable for growth, and it counts people over 45 as at higher risk (HSE, What Legionnaires’ Disease Is, Sep 2024).
- The August 2002 outbreak in Barrow-in-Furness killed 7 people and made 180 ill (HSE, Barrow Outbreak, Aug 2002).
What do state and city rules add?
New York is the most detailed example.
- New York State requires every cooling tower owner to register, maintain, sample, disinfect and notify health departments and the public of elevated Legionella levels (New York State Department of Health, Protection Against Legionella, Apr 2025).
- After New York City’s cooling tower law took effect, the health department inspected 3,909 registered systems, or 79%, between May 9, 2016 and May 31, 2017 (Emerging Infectious Diseases, New York City Cooling Towers, Nov 2017).
- Samples from 46 systems exceeded 1,000 CFU/mL of Legionella, and each was remediated under the new rules (Emerging Infectious Diseases, New York City Cooling Towers, Nov 2017).
- New York City had 5,886 registered cooling towers in 2017, 75% of them in Manhattan (Emerging Infectious Diseases, New York City Cooling Towers, Nov 2017).
- New York City starts a building evaluation when two or more people in one building are diagnosed within 12 months (NYC Health Department, Annual Surveillance Report, Aug 2024).
What Does Legionnaires’ Disease Cost?
Few waterborne diseases cost as much per patient, and few kill as many.
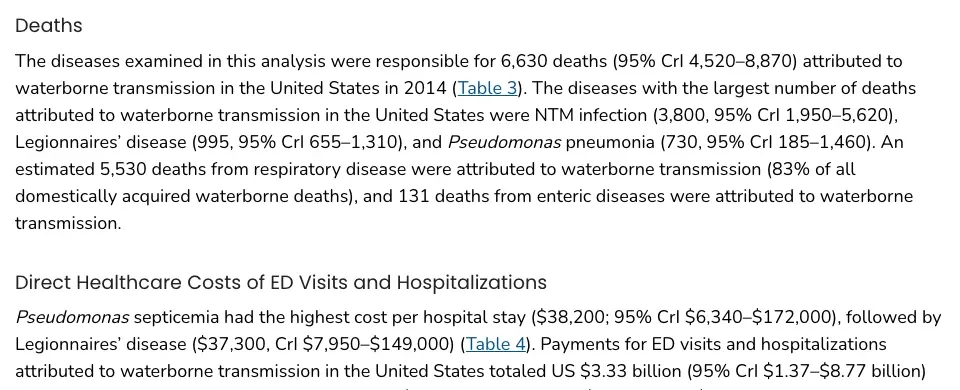 Figure 11: Legionnaires’ disease ranked second for waterborne deaths and second for cost per hospital stay among the 17 diseases studied. Source: Emerging Infectious Diseases, Waterborne Disease Burden, Jan 2021. Screenshot of the source page, captured 21 Oct 2026.
How many deaths and what cost?
The estimate covers 2014 and counts only hospital and emergency department payments.
- Legionnaires’ disease caused an estimated 995 waterborne deaths in 2014 (95% credible interval 655 to 1,310), second only to nontuberculous mycobacteria at 3,800 (Emerging Infectious Diseases, Waterborne Disease Burden, Jan 2021).
- The credible interval for the average hospital stay cost ran from $7,950 to $149,000 (Emerging Infectious Diseases, Waterborne Disease Burden, Jan 2021).
- Only Pseudomonas septicemia cost more per hospital stay, at $38,200 (Emerging Infectious Diseases, Waterborne Disease Burden, Jan 2021).
- The longest hospital stay in the Napa outbreak was 36 days (MMWR, Napa County Outbreak, Dec 2023).
How much plumbing is involved?
The pipe network inside buildings is large, and it is where the bacteria grow.
- US buildings contain an estimated 6 million miles of premise plumbing (Emerging Infectious Diseases, Waterborne Disease Burden, Jan 2021).
What Do European Legionella Numbers Show?
Europe reports more cases per person than the US, and the rate has risen every year since 2020. The ECDC calls the cause of the climb unknown.
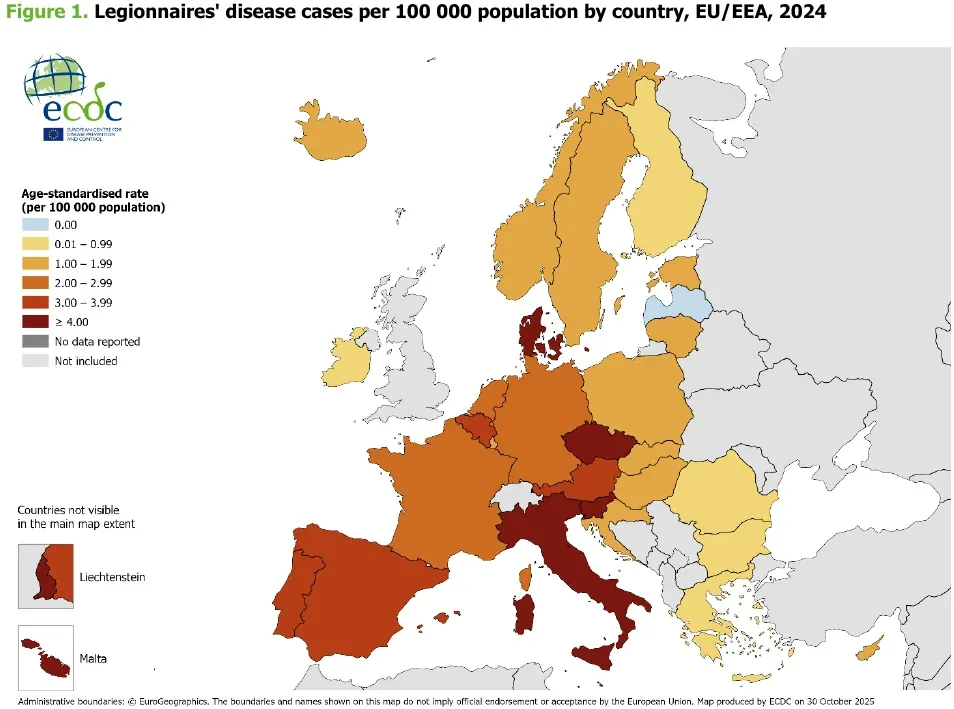 Figure 12: Italy, Czechia and Denmark sit in the highest band, while Bulgaria, Finland, Greece, Ireland and Romania report under 1.0. Source: ECDC, Annual Epidemiological Report for 2024, May 2026. Chart published by the source, captured 21 Oct 2026.
How many cases does the EU report?
The count has risen every year since 2020.
- Of the 15,362 cases in 2024, 14,126 (92%) were classified as confirmed (ECDC, Annual Epidemiological Report for 2024, May 2026).
- The EU and EEA reported 8,432 cases in 2020, a rate of 1.9 per 100,000 (ECDC, Annual Epidemiological Report for 2024, May 2026).
- The 2023 rate was 3.2 per 100,000, and the 2024 rate is the highest in the last decade (ECDC, Annual Epidemiological Report for 2024, May 2026).
- France, Germany, Italy and Spain accounted for 71% of cases with about half of the EU and EEA population (ECDC, Annual Epidemiological Report for 2024, May 2026).
- Italy reported 4,617 cases at 7.8 per 100,000, and Slovenia had the highest crude rate at 9.6 (ECDC, Annual Epidemiological Report for 2024, May 2026).
Who is affected and how deadly is it?
The age pattern matches the US, and the fatality rate is similar.
- People aged 50 or older made up 13,369 (87%) of the 15,315 cases with known age (ECDC, Annual Epidemiological Report for 2024, May 2026).
- The rate was 9.3 per 100,000 in people aged 65 or older, and 13.0 in men of that age against 6.5 in women (ECDC, Annual Epidemiological Report for 2024, May 2026).
- Of 12,041 cases with a known outcome, 1,117 (9%) were fatal (ECDC, Annual Epidemiological Report for 2024, May 2026).
- The male to female ratio was 1.9 to 1 (ECDC, Annual Epidemiological Report for 2024, May 2026).
- Most cases, 8,689 or 57%, occurred between June and October (ECDC, Annual Epidemiological Report for 2024, May 2026).
How many Europeans catch it while traveling?
ECDC runs a separate scheme for patients who stayed at commercial accommodation.
- The scheme received 1,501 travel-associated cases with onset in 2023, up from 1,291 in 2022 (ECDC, Annual Epidemiological Report for 2023, Mar 2026).
- The 1,501 patients made 2,107 accommodation visits, 79% inside the EU and EEA and 20% outside (ECDC, Annual Epidemiological Report for 2023, Mar 2026).
- Italy had 30% of the visits, France 13% and Spain 11% (ECDC, Annual Epidemiological Report for 2023, Mar 2026).
- Hotels accounted for 78% of overnight stays, campsites 10%, commercial rentals 8% and online short rentals 3% (ECDC, Annual Epidemiological Report for 2023, Mar 2026).
- The scheme detected 140 new clusters in 2023, defined as two cases at the same accommodation site within two years (ECDC, Annual Epidemiological Report for 2023, Mar 2026).
- Of 693 travel-associated patients with a known outcome, 15 (2.2%) had died (ECDC, Annual Epidemiological Report for 2023, Mar 2026).
- Travel-associated reports in 2022 were 48% higher than in 2021 (ECDC, Annual Epidemiological Report for 2022, Jan 2026).
What changed in earlier years?
The older reports show how the pattern built up.
- The notification rate rose from 1.9 per 100,000 in 2020 to 2.4 in 2021 and 2.6 in 2022 (ECDC, Annual Epidemiological Report for 2022, Jan 2026).
- The median age of cases rose from 64 years in 2018 to 67 in 2022 (ECDC, Annual Epidemiological Report for 2022, Jan 2026).
- The monthly peak of 2,308 cases in August 2023 was 16% of that year’s total and the highest monthly number recorded under EU and EEA surveillance (ECDC, Annual Epidemiological Report for 2023, Mar 2026).
- In 2023, 59% of cases occurred between June and October, and the male to female ratio was 2.2 to 1 (ECDC, Annual Epidemiological Report for 2023, Mar 2026).
- In 2023, 92% of cases with known age were aged 45 or older (ECDC, Annual Epidemiological Report for 2023, Mar 2026).
How many European outbreaks find a source?
Few do.
- Eight countries reported 32 outbreaks with 365 outbreak-related confirmed cases, ranging from 3 to 89 per outbreak (ECDC, Annual Epidemiological Report for 2024, May 2026).
- A source was found in 16% of outbreaks (5 of 31), including one cooling tower and two suspected cooling towers (ECDC, Annual Epidemiological Report for 2024, May 2026).
- In 2023, seven countries reported 39 outbreaks with 368 cases, and a source was found in 10% (4 of 39) (ECDC, Annual Epidemiological Report for 2023, Mar 2026).
- One 2023 outbreak of 23 cases in the Netherlands was linked to a specific type of water heater used in private homes (ECDC, Annual Epidemiological Report for 2023, Mar 2026).
- A urine antigen test diagnosed 88% of cases, and a culture was reported for 8.3% (ECDC, Annual Epidemiological Report for 2024, May 2026).
- Over 75% of culture-confirmed Legionella pneumophila cases were serogroup 1 (ECDC, Annual Epidemiological Report for 2024, May 2026).
How Does the Rest of the World Compare?
Many countries cannot count the disease at all, so global numbers are estimates with wide ranges. The shape of the problem is the same everywhere: older people, warm buildings and water that sits.
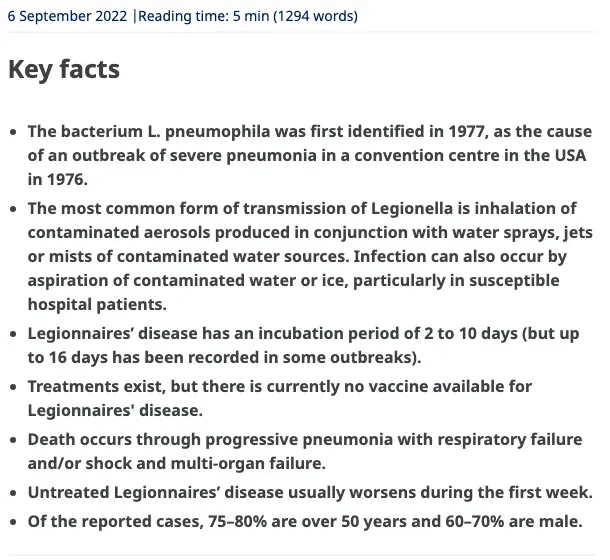 Figure 13: WHO states that 75% to 80% of reported cases are over 50 years old and 60% to 70% are male. Source: WHO, Legionellosis, Sep 2022. Screenshot of the source page, captured 21 Oct 2026.
What does WHO say about the global picture?
WHO does not publish a global case count.
- In Europe, Australia and the USA, about 10 to 15 cases per million population per year are detected (WHO, Legionellosis, Sep 2022).
- The incubation period is 2 to 10 days, and up to 16 days has been recorded in some outbreaks (WHO, Legionellosis, Sep 2022).
- Illness has occurred 3 or more kilometers from the source of an outbreak (WHO, Legionellosis, Sep 2022).
- Legionella pneumophila was first identified in 1977, after the 1976 outbreak at a convention in the USA (WHO, Legionellosis, Sep 2022).
How do Canada and the Netherlands compare?
Canada’s figures are modeled, and the Dutch figure is a notification rate.
- Canada reported an average of 438 Legionnaires’ disease cases per year from 2015 to 2019 (Epidemiology and Infection, Canada Burden Estimate, Jan 2024).
- A model estimated 1,113 illnesses, 1,008 hospitalizations and 34 deaths a year, an incidence of 3.06 per 100,000 (Epidemiology and Infection, Canada Burden Estimate, Jan 2024).
- The Netherlands reached a peak of 5.0 notifications per 100,000 in 2023 (Emerging Infectious Diseases, Dutch Water Heaters, Jul 2026).
What does the global burden study show?
The study uses modeled Global Burden of Disease data.
- The global age-standardized death rate for Legionella infections was 0.86 per 100,000 in 2021 (Journal of Epidemiology and Global Health, Global Burden 1990 to 2021, Jan 2025).
- The age-standardized disability-adjusted life year rate was 24.74 per 100,000, with the highest rates in low sociodemographic index regions (Journal of Epidemiology and Global Health, Global Burden 1990 to 2021, Jan 2025).
- People over 70 had a death rate of 8.15 per 100,000 (Journal of Epidemiology and Global Health, Global Burden 1990 to 2021, Jan 2025).
Methodology and Sources
Every statistic comes from the agency, journal or regulator that produced it. Each source page or file was opened and read for the number before it was used, and every figure was taken from a source chart or a screenshot of the source page. Where two agencies give different ranges, such as growth temperatures, both are listed with attribution. The 2024 and 2025 CDC incidence values are provisional, and the 2014 waterborne burden estimate is modeled. Counts from the latest New York City outbreak page change as the health department updates it, so the figures are as of October 2026. No statistic comes from a roundup page. The page is refreshed monthly.
Glossary
- ASHRAE: American Society of Heating, Refrigerating and Air-Conditioning Engineers, the group that publishes Standard 188 on Legionella risk management in building water systems.
- CFR: case fatality rate, the share of patients with a known outcome who died.
- CFU: colony-forming units, a count of live bacteria that grow on a culture plate.
- CMS: Centers for Medicare and Medicaid Services.
- ECDC: European Centre for Disease Prevention and Control.
- EU/EEA: European Union and European Economic Area countries.
- NNDSS: National Notifiable Diseases Surveillance System, the CDC system that receives case reports from states.
- PCR: polymerase chain reaction, a test that finds traces of living or dead bacteria.
- Premise plumbing: the piping from the water meter to the tap inside a building.
- SLDSS: Supplemental Legionnaires’ Disease Surveillance System, which adds exposure and outcome details to case reports.
- Urinary antigen test: the common urine test for Legionnaires’ disease, which detects Legionella pneumophila serogroup 1.
- WMP: water management program, a written plan to find and control Legionella risks in a building’s water system.
Sources
- CDC, Legionellosis Surveillance and Trends
- CDC, Surveillance Summary Report 2018-2019
- CDC, About Legionnaires’ Disease
- CDC, Surveillance Summary Report 2020-2021
- EPA, Legionella
- MMWR, Vital Signs 2016
- CDC, Outbreaks and Water Management Gaps
- NYC Health Department, Legionnaires’ Disease
- CDC, Monitoring Building Water
- Emerging Infectious Diseases, Dutch Water Heaters
- PNAS, Flint Outbreak Assessment
- Emerging Infectious Diseases, Waterborne Disease Burden
- ECDC, Annual Epidemiological Report for 2024
- Emerging Infectious Diseases, Rising Incidence
- Epidemiology and Infection, Canada Burden Estimate
- NYC Health Department, Annual Surveillance Report
- WHO, Legionellosis
- NEJM Evidence, Central Harlem Outbreak
- Emerging Infectious Diseases, New York City Cooling Towers
- MMWR, Napa County Outbreak
- Public Health Reports, North Carolina Fair Outbreak
- MMWR, Cruise Ship Hot Tubs
- MMWR, Vacation Rental Hot Tub
- Journal of Environmental Health, Church Baptismal Font
- Emerging Infectious Diseases, Minnesota Chloramine
- MMWR, Vital Signs 2017
- CMS, Survey and Certification Letter 17-30
- New York State Department of Health, Protection Against Legionella
- ACS ES&T Water, Water Heater Type and Temperature Study
- NIST, Household Water Demand and Heater Temperature Study
- HSE, Hot and Cold Water Systems
- HSE, Hot and Cold Water Systems Things to Consider
- CDC, Reopening Buildings Guidance
- Epidemiology and Infection, Yorkshire Cold-Water Outbreak
- MMWR, U.S. Virgin Islands Hotels
- Microorganisms, Outbreak Root Causes
- CDC, Water Management Programs
- HSE, Testing and Monitoring
- HSE, What Legionnaires’ Disease Is
- HSE, Barrow Outbreak
- ECDC, Annual Epidemiological Report for 2023
- ECDC, Annual Epidemiological Report for 2022
- Journal of Epidemiology and Global Health, Global Burden 1990 to 2021