CRM benefits statistics are easy to find and hard to trust. Most of the numbers on vendor blogs trace back to a few old studies, and many trace back to nothing. This page keeps only figures that link to the study, survey or filing that produced them.
The honest picture is mixed. CRM pays back, but less than it did a decade ago, and over half of the payback comes from saved time rather than new sales. The clearest gains show up when a shop answers fast, follows up on every estimate and keeps clean customer records. Those are three jobs a small shop can hand to software.
Read the numbers with care. Many come from surveys of owners who chose to buy software, and a survey cannot prove that CRM caused the result. The Methodology section names the sources that also sell software.
Updated October 2026.
Key Takeaways
- CRM returns $3.10 per dollar spent in Nucleus Research’s 2023 review of its case studies (Nucleus Research, Aug 2023).
- Time savings and process efficiency made up 51% of total CRM ROI in 2023 case studies (Nucleus Research, Jan 2024).
- Field service applications of CRM deliver 4.2 times the return on investment of core CRM, according to Nucleus Research’s 2018 analysis (Nucleus Research, May 2018).
- Sales reps spend just 40% of their time selling (Salesforce State of Sales, Feb 2026).
- The odds of contacting a web lead dropped 100 times when the call came at 30 minutes instead of 5, in a 2009 study of web leads at six companies (InsideSales.com Lead Response Management Study, Dec 2012).
- Nearly half of contractors with $10 million or more in revenue (47%) say following up on estimates drives 11% to 15% of their income (ServiceTitan, Mar 2025).
- More than half of residential contractors respond to new leads within the first hour (ServiceTitan, Apr 2026).
- Raising customer retention by 5% increases profits by 25% to 95%, according to research by Bain’s Frederick Reichheld, as reported by Harvard Business Review (Harvard Business Review, Oct 2014).
- American organizations put $973 billion of sales at risk in 2026 by delivering bad customer experiences (Qualtrics XM Institute, Nov 2025).
- Data quality researcher Thomas Redman estimates bad data costs most companies 15% to 25% of revenue (MIT Sloan Management Review, Nov 2017).
- 47% of newly created data records contain at least one critical error (Harvard Business Review, Sep 2017).
- 79% of high-performing sales professionals prioritize data hygiene, against 54% of underperformers (Salesforce State of Sales, Feb 2026).
- 61% of field service organizations say mobile workers have limited access to customer information while onsite (Salesforce State of Field Service, Jul 2026).
- 84% of small business owners say technology platforms helped build stronger relationships with customers (U.S. Chamber of Commerce, Aug 2025).
CRM ROI Statistics: What Does a Dollar of CRM Return?
The best known ROI figure comes from one research firm that averages its own case studies. It has fallen over time, and the old high numbers still get repeated as if nothing changed.
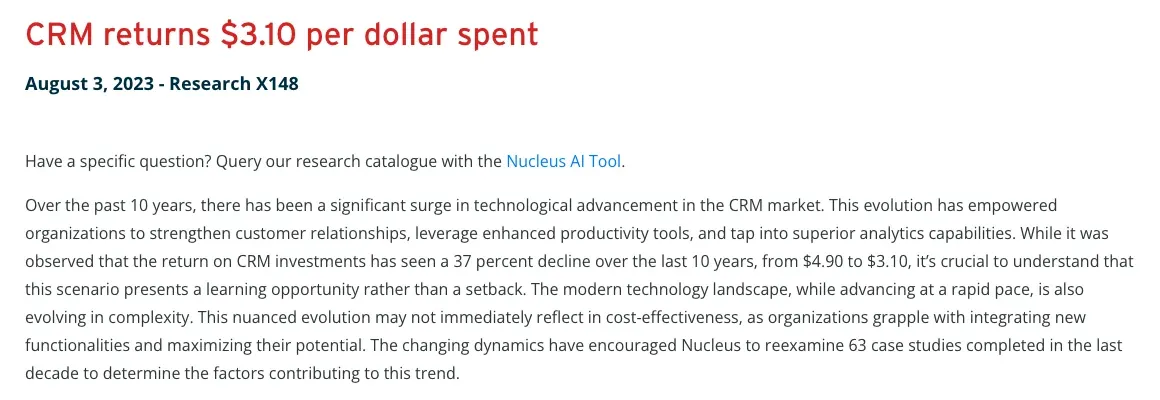 Figure 1: Nucleus Research reports that return on CRM investment fell by 37% over ten years, so older ROI claims overstate what a buyer should expect today. Source: Nucleus Research, CRM returns $3.10 per dollar spent, Aug 2023. Screenshot of the source page, captured 21 Oct 2026.
How has CRM return per dollar changed?
The 2014 figure was far higher than the 2023 one, and the gap is the story.
- Nucleus says the decline over the last ten years was 37%, from a starting point of $4.90 per dollar (Nucleus Research, Aug 2023).
- The 2023 re-examination covered 63 case studies completed in the last decade (Nucleus Research, Aug 2023).
- In 2011 the same firm reported an average return of $5.60 per dollar spent (Nucleus Research, Nov 2011).
- By 2014 it reported $8.71 per dollar, the figure many blogs still quote (Nucleus Research, Jun 2014).
- The January 2024 follow-up looked at 11 case study calculations from 2023 (Nucleus Research, Jan 2024).
Where does the return come from?
Time savings are the largest source, and new revenue adds the least.
- Nucleus found that increased revenue was the benefit area contributing least to total return (Nucleus Research, Jan 2024).
- Fewer than 10% of companies with field service operations had reached optimal maturity in 2018 (Nucleus Research, May 2018).
- Nucleus expected purpose-built generative AI to improve productivity by 10% to 35% for service agents and marketers (Nucleus Research, Apr 2023).
What do small businesses say about CRM?
Owners rate it well, and buyers budget a modest monthly fee per user.
- 83% of small and midsize business leaders said CRM was very or moderately effective at helping them reach marketing goals, more than any other software type in the survey (Capterra, Feb 2021).
- CRM buyers who contacted Capterra budgeted an average of $78 per user per month (Capterra, Mar 2026).
- 36% of buyers said inefficiency was the pain that pushed them to a dedicated CRM (Capterra, Mar 2026).
- 33% said limited functionality in their current tools was the pain (Capterra, Mar 2026).
- 12% said new business opportunities were the reason to switch (Capterra, Mar 2026).
CRM Productivity Statistics: How Much Time Does It Save?
Selling is the job that earns money, and it gets the smaller share of the day. CRM is sold as a way to give that time back.
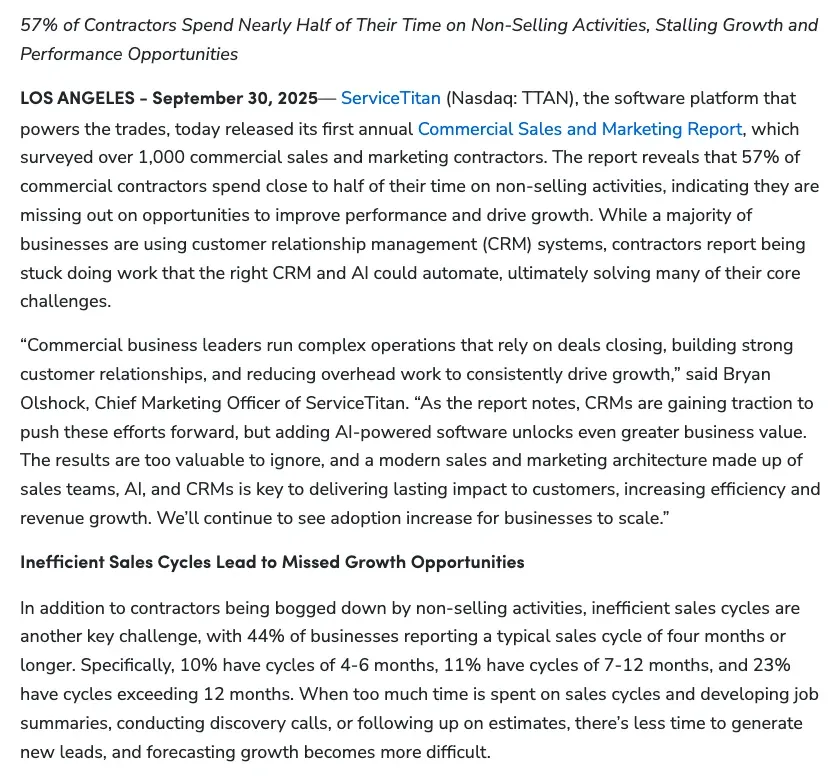 Figure 2: ServiceTitan’s survey of more than 1,000 commercial contractors found most spend close to half their time on work that is not selling, and many wait months to close. Source: ServiceTitan, Commercial Sales and Marketing Report press release, Sep 2025. Screenshot of the source page, captured 21 Oct 2026.
How much of the workday goes to selling?
Less than half, in most surveys.
- Sales reps spend 70% of their time on non-selling tasks (Salesforce State of Sales, Jul 2024).
- They spend nearly one full day each workweek on prospecting (Salesforce State of Sales, Feb 2026).
- 57% of commercial contractors spend close to half their time on non-selling activities (ServiceTitan, Sep 2025).
- Service representatives spend only 46% of their time working directly with customers (Salesforce State of Service, Sep 2025).
- Small business owners lose an average of 96 minutes a day to tasks they call unproductive (Salesforce Small Business Productivity Trends, Aug 2024).
- 17% of small business owners say switching between apps and tools wastes their time (Salesforce Small Business Productivity Trends, Aug 2024).
Does tool sprawl cost time?
Yes, and small firms feel it most.
- 46% of small and midsize business leaders feel overwhelmed by too many business tools (Salesforce Small and Medium Business Trends, Dec 2024).
- At growing small businesses, 66% of leaders describe their tech stack as an integrated suite, against 45% at declining ones (Salesforce Small and Medium Business Trends, Dec 2024).
What does automation inside a CRM add?
Vendors point to data entry, research and drafting. The figures below are survey expectations and self-reports, not audited time studies.
- 43% of contractors that use AI in sales use it to automate CRM data entry and updates (ServiceTitan, Sep 2025).
- Sellers expect AI agents to cut prospect research time by 34% (Salesforce State of Sales, Feb 2026).
- They expect AI agents to cut email drafting time by 36% (Salesforce State of Sales, Feb 2026).
- 66% of contractors who use AI save at least three hours per week (ServiceTitan, Sep 2026).
Does CRM Raise Sales?
The evidence points to speed around the sale more than to new demand.
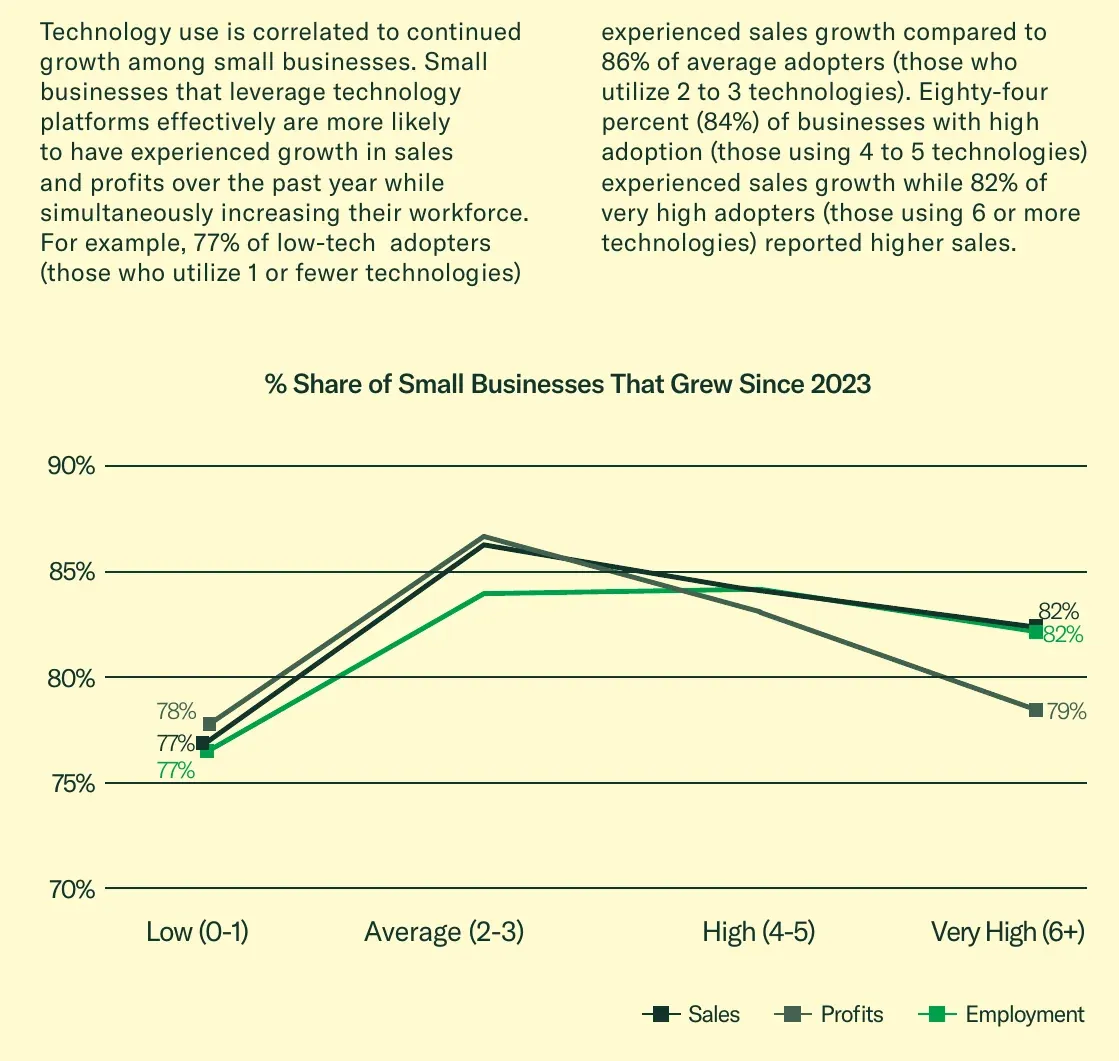 Figure 3: In the US Chamber’s survey, small businesses that use few technologies grew less often than those that use several, though the gain does not keep rising past the average. Source: U.S. Chamber of Commerce Technology Engagement Center, Empowering Small Business 2025 (page 8), Aug 2025. Screenshot of the source report page, captured 21 Oct 2026.
Does faster access to customer data shorten the sales cycle?
It does, by a modest amount.
- Nucleus found that data accessibility for salespeople shortens the sales cycle by 8% to 14% on average (Nucleus Research, Aug 2015).
- 44% of commercial contractors report a typical sales cycle of four months or longer (ServiceTitan, Sep 2025).
- 23% of them have cycles that exceed 12 months (ServiceTitan, Sep 2025).
Do small businesses that use more technology grow more?
They report growth more often, though the link is a correlation.
- 77% of low-tech small businesses, those using one technology or fewer, reported sales growth since 2023 (U.S. Chamber of Commerce, Aug 2025).
- 86% of average adopters, those using two or three technologies, reported sales growth (U.S. Chamber of Commerce, Aug 2025).
- 84% of high adopters, those using four or five, reported sales growth (U.S. Chamber of Commerce, Aug 2025).
- 82% of very high adopters, those using six or more, reported sales growth (U.S. Chamber of Commerce, Aug 2025).
- 88% of growing small businesses are increasing technology spending this year, against 46% of declining ones (Salesforce Small and Medium Business Trends, Dec 2024).
- 73% of leaders at growing small businesses say they keep pace with larger firms on technology, against 42% at declining ones (Salesforce Small and Medium Business Trends, Dec 2024).
What do teams with AI in their sales tools report?
Teams that adopted AI report better results than teams that did not. The survey cannot say which came first.
- 83% of sales teams with AI saw revenue grow in the past year, against 66% of teams without AI (Salesforce State of Sales, Jul 2024).
- 80% of reps with AI say it is easy to get the customer insights they need to close deals, against 54% without (Salesforce State of Sales, Jul 2024).
- 43% of contractors who use AI report increased revenue (ServiceTitan, Sep 2026).
- 47% of contractors who use AI report improved profitability (ServiceTitan, Sep 2026).
Lead Response Time Statistics: How Fast Should You Follow Up?
Speed is the CRM payoff with the best timing data behind it. The best study is old, so treat the multiples as direction, not as a promise for plumbing calls.
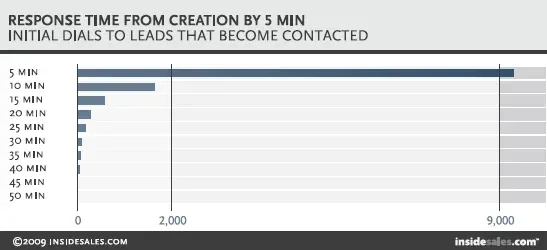 Figure 4: In InsideSales.com’s lead response study, almost all successful contacts came from calls placed in the first five minutes after a web form was submitted. Source: InsideSales.com, The Lead Response Management Study (Internet Archive copy), Dec 2012. Chart published by the source, captured 21 Oct 2026.
How fast do leads go cold?
Within the first hour, and fastest in the first few minutes.
- The 2009 study examined three years of data across six companies, with more than 15,000 leads and more than 100,000 call attempts (InsideSales.com Lead Response Management Study, Dec 2012).
- The odds of contacting a lead fell by over 10 times in the first hour (InsideSales.com Lead Response Management Study, Dec 2012).
- The odds of qualifying a lead fell by over 6 times in the first hour (InsideSales.com Lead Response Management Study, Dec 2012).
- The odds of qualifying a lead dropped 21 times when the call came at 30 minutes instead of 5 (InsideSales.com Lead Response Management Study, Dec 2012).
- After 20 hours, every extra dial hurt the chance of reaching a qualified lead (InsideSales.com Lead Response Management Study, Dec 2012).
When is the best time to call?
Midweek days and late afternoons did best in this data set, which covers web leads at six companies.
- Thursday was 49.7% better than the worst day, Tuesday, for making contact (InsideSales.com Lead Response Management Study, Dec 2012).
- Wednesday was 24.9% better than the worst day, Friday, for qualifying a lead (InsideSales.com Lead Response Management Study, Dec 2012).
- Calls between 4 and 6pm were 114% better for contact than the worst time block (InsideSales.com Lead Response Management Study, Dec 2012).
- Calls between 8 and 9am were 164% better for qualifying than calls at 1 to 2pm (InsideSales.com Lead Response Management Study, Dec 2012).
How fast do trades businesses reply today?
More than half say they answer within the hour, and most still lean on the phone.
- 64% of residential contractors rely on phone calls as their dominant form of communication (ServiceTitan, Mar 2025).
- 10% of thriving residential service businesses prioritize online booking forms (ServiceTitan, Mar 2025).
- 7% of them prioritize text messaging (ServiceTitan, Mar 2025).
What do customers expect from a reply?
An answer now, with the right history in front of the person answering.
- 77% of customers expect to interact with someone immediately when they contact a company (Salesforce State of the Connected Customer, Aug 2023).
- 81% expect faster service as technology advances (Salesforce State of the Connected Customer, Aug 2023).
- 61% of consumers expect instant responses with up-to-date information across departments (Salesforce Real Time Connected Customer Research, Jan 2023).
- 69% expect consistent interactions across departments (Salesforce State of the AI Connected Customer, Oct 2024).
- 72% say they will stay loyal to companies that provide faster service (Salesforce Real Time Connected Customer Research, Jan 2023).
Customer Retention Statistics: Is Keeping Customers Worth the Effort?
Retention is where a customer list turns into a business asset, and the figures below show what losing customers costs.
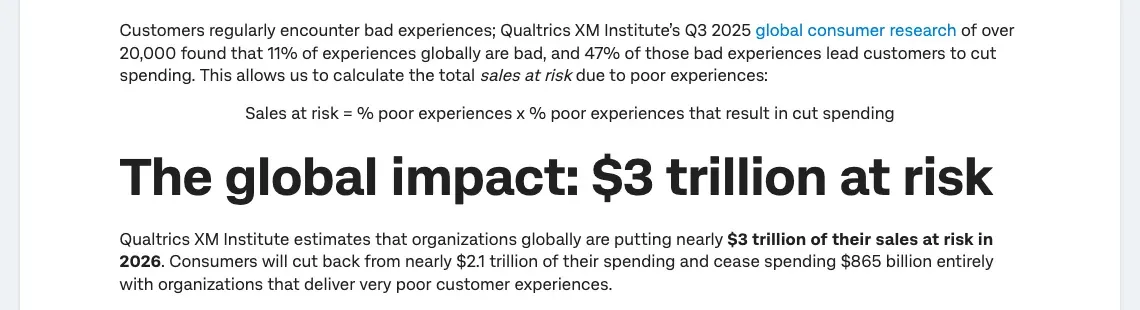 Figure 5: Qualtrics XM Institute multiplies the share of bad experiences by the share that make customers cut spending to estimate how much revenue poor service puts at risk. Source: Qualtrics XM Institute, $3 Trillion is at risk due to bad customer experiences in 2026, Nov 2025. Screenshot of the source page, captured 21 Oct 2026.
What does keeping a customer save?
Money, because winning a new one costs more.
- Acquiring a new customer is anywhere from 5 to 25 times more expensive than retaining one, depending on the study and the industry (Harvard Business Review, Oct 2014).
- Residential contractors rank customer retention (53%) well above new customer acquisition (31%) as a priority (ServiceTitan, Apr 2026).
- Improving customer satisfaction and retention is the top business goal for 35% of field service leaders (Salesforce State of Field Service, Jul 2026).
What does a bad experience cost?
Spending, and sometimes the customer.
- 11% of customer experiences worldwide are bad (Qualtrics XM Institute, Nov 2025).
- 47% of bad experiences lead customers to cut spending (Qualtrics XM Institute, Nov 2025).
- Consumers will cut back nearly $2.1 trillion of spending in 2026 because of poor experiences (Qualtrics XM Institute, Nov 2025).
- They will stop spending $865 billion entirely with organizations that deliver very poor experiences (Qualtrics XM Institute, Nov 2025).
- 61% of 5,000 respondents have switched brands because of poor customer service (Microsoft Dynamics 365 State of Global Customer Service, Aug 2018).
- 95% say customer service matters to their choice of brand and their loyalty (Microsoft Dynamics 365 State of Global Customer Service, Aug 2018).
What makes customers loyal?
Speed, a personal touch and an experience that matches the product.
- 65% of consumers say they will stay loyal to companies that offer a more personalized experience (Salesforce Real Time Connected Customer Research, Jan 2023).
- 80% of customers say the experience a company provides is as important as its products and services (Salesforce State of the Connected Customer, Aug 2023).
- 47% are willing to pay extra for better customer service (Salesforce State of the Connected Customer, Aug 2023).
- 61% say most companies treat them as a number (Salesforce State of the Connected Customer, Aug 2023).
Do Customers Notice Better Service?
Owners say yes. Academic work on firms with CRM points the same way, though it measures US firms in a national index, not three-truck shops.
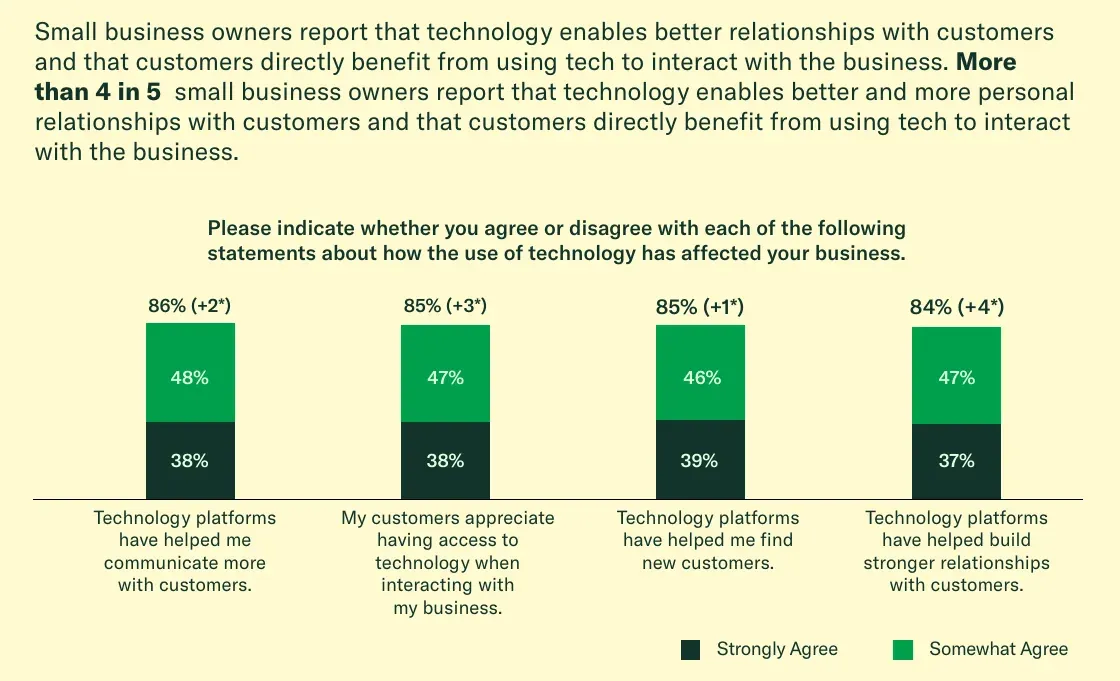 Figure 6: More than four in five US small business owners agree that technology helps them talk to customers, win new ones and build stronger relationships. Source: U.S. Chamber of Commerce Technology Engagement Center, Empowering Small Business 2025 (page 11), Aug 2025. Screenshot of the source report page, captured 21 Oct 2026.
Do owners say technology improves customer relationships?
Four in five do, and the answers are close across questions.
- 86% say technology platforms helped them communicate more with customers (U.S. Chamber of Commerce, Aug 2025).
- 85% say their customers appreciate having access to technology when interacting with their business (U.S. Chamber of Commerce, Aug 2025).
- 85% say technology platforms helped them find new customers (U.S. Chamber of Commerce, Aug 2025).
- 83% say technology platforms helped their business compete with larger companies (U.S. Chamber of Commerce, Aug 2025).
- 85% say technology platforms helped them enjoy running their business more (U.S. Chamber of Commerce, Aug 2025).
What does peer-reviewed research say about CRM and satisfaction?
CRM use goes with better customer knowledge and higher satisfaction. These are findings, not percentages.
- A Journal of Marketing study of US firms found that use of CRM applications was positively associated with improved customer knowledge and improved customer satisfaction (Journal of Marketing, Mithas, Krishnan and Fornell, Oct 2005).
- The same study found gains in customer knowledge were stronger when firms shared customer information with supply chain partners (Journal of Marketing, Mithas, Krishnan and Fornell, Oct 2005).
- A 2006 Journal of Marketing study found that satisfaction, measured by the American Customer Satisfaction Index, was significantly related to the market value of equity (Journal of Marketing, Fornell, Mithas, Morgeson and Krishnan, Jan 2006).
- The authors found that portfolios of firms that scored well on that index beat the market at low systematic risk (Journal of Marketing, Fornell, Mithas, Morgeson and Krishnan, Jan 2006).
Where do companies fall short on service?
On listening and on seeing problems early.
- Customers want to give feedback (90% on average) but are offered the chance only 37% of the time (Microsoft Dynamics 365 State of Global Customer Service, Aug 2018).
- 59% of consumers have used multiple channels to get questions answered (Microsoft Dynamics 365 State of Global Customer Service, Aug 2018).
- 53% of customers expect companies to anticipate their needs, but only 33% say most companies address service issues proactively (Salesforce State of the Connected Customer, Aug 2023).
CRM Data Quality Statistics: What Do Bad Records Cost?
A CRM is only as good as what goes into it. Bad records waste time, and they weaken every other gain on this page.
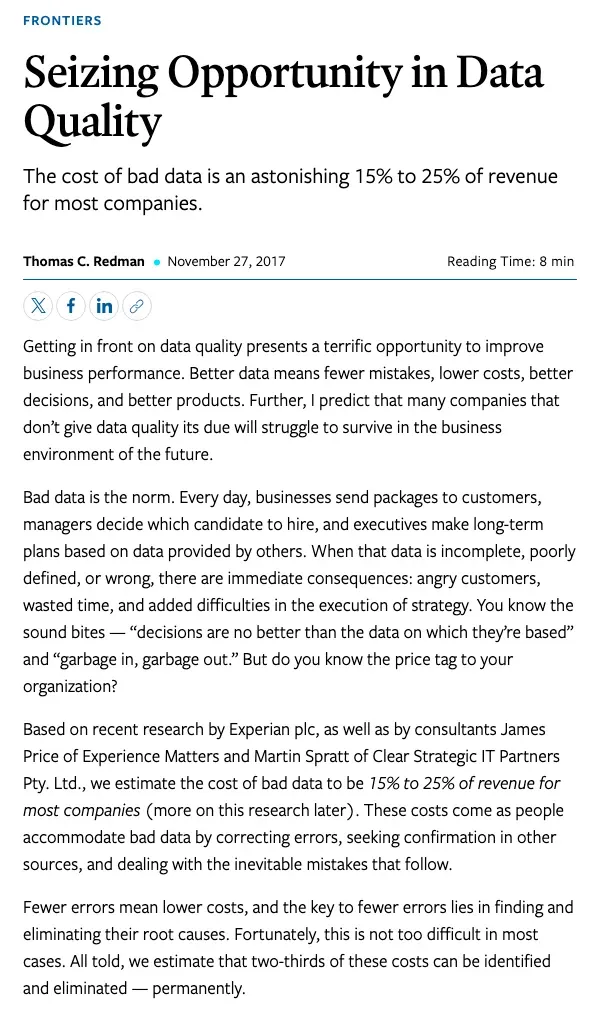 Figure 7: Data quality researcher Thomas Redman estimates that bad data costs most companies 15% to 25% of revenue, and that two-thirds of that cost can be removed for good. Source: MIT Sloan Management Review, Seizing Opportunity in Data Quality, Nov 2017. Screenshot of the source page, captured 21 Oct 2026.
How bad is business data?
The surveys show low trust in the data teams already hold.
- In a study of 75 executives, only 3% of data quality scores could be rated acceptable under the loosest standard (Harvard Business Review, Sep 2017).
- Data and analytics leaders estimate 26% of their organizations’ data is untrustworthy (Salesforce State of Data and Analytics, Nov 2025).
- They estimate 19% of company data is siloed, inaccessible or unusable (Salesforce State of Data and Analytics, Nov 2025).
- Only 35% of sales professionals completely trust the accuracy of their organization’s data (Salesforce State of Sales, Jul 2024).
- 53% of small and midsize business leaders say data is often inconsistent across their business tools (Salesforce Small and Medium Business Trends, Dec 2024).
What does bad data cost?
The estimates are large, and they are estimates.
- Redman estimates that two-thirds of the cost of bad data can be identified and eliminated permanently (MIT Sloan Management Review, Nov 2017).
- Gartner research found organizations believe poor data quality costs them an average of $15 million per year (Gartner, Jun 2018).
- Redman put the cost of bad data to the US economy at $3 trillion per year in a 2016 Harvard Business Review article (Harvard Business Review, Sep 2016).
- 80% of small and midsize business leaders say improving data quality would increase revenue (Salesforce Small and Medium Business Trends, Dec 2024).
- 84% say complete and accurate data is increasingly important for business success (Salesforce Small and Medium Business Trends, Dec 2024).
Does using data well pay off?
Firms that use data well report higher output, and fragmented systems hold other teams back.
- Firms that adopt data-driven decision making have output and productivity 5% to 6% higher than expected from their other investments, in a study of 179 large public firms (Brynjolfsson, Hitt and Kim, Strength in Numbers (SSRN), Apr 2011).
- 51% of sales leaders with AI say disconnected systems are slowing their AI initiatives (Salesforce State of Sales, Feb 2026).
- 37% of current CRM users call contact management the most essential feature (Capterra, Mar 2026).
- 46% of CRM buyers use non-specialized tools such as ecommerce or recruiting platforms to run daily customer work (Capterra, Mar 2026).
- 23% of buyers have no particular system in place (Capterra, Mar 2026).
- 14% use spreadsheets and email (Capterra, Mar 2026).
What Gaps Do Trades Businesses Report?
Trades shops work across the office, the truck and the follow-up call. The surveys below show where those handoffs break.
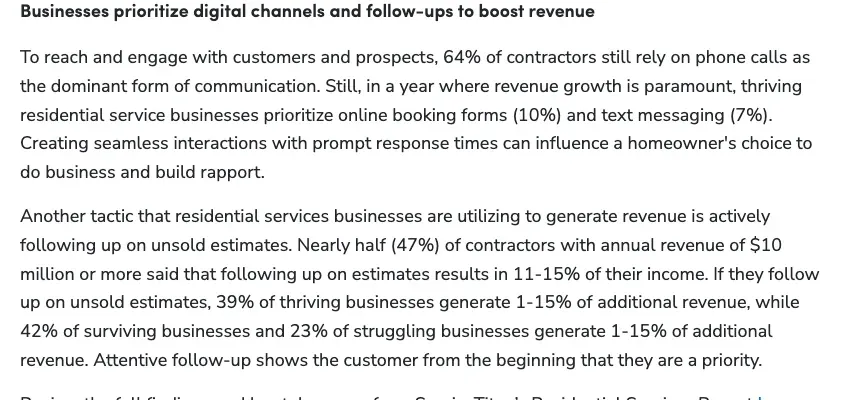 Figure 8: ServiceTitan’s residential contractor survey links follow-up on unsold estimates to a share of revenue, and the thriving businesses report more of it than struggling ones. Source: ServiceTitan, Residential Services Report press release, Mar 2025. Screenshot of the source page, captured 21 Oct 2026.
How much extra revenue comes from following up on unsold estimates?
More for businesses that call themselves thriving.
- 39% of thriving residential businesses generate 1% to 15% of additional revenue by following up on unsold estimates (ServiceTitan, Mar 2025).
- 42% of surviving businesses do the same (ServiceTitan, Mar 2025).
- 23% of struggling businesses do the same (ServiceTitan, Mar 2025).
Do field teams have the customer data they need?
Often not.
- 49% of field service organizations lack a clear process for converting service visits into sales leads (Salesforce State of Field Service, Jul 2026).
- Only 16% say their field and back-office technology run on a single platform (Salesforce State of Field Service, Jul 2026).
- 52% still use spreadsheets to manage field assets (Salesforce State of Field Service, Jul 2026).
- 66% of field service leaders say mobile worker turnover has risen over the past two years (Salesforce State of Field Service, Jul 2026).
- 57% of field service organizations using AI-powered scheduling and dispatch report higher revenue per job (Salesforce State of Field Service, Jul 2026).
How satisfied are trades businesses with the CRM they have?
Fewer than half are satisfied, and the complaints point to fit, not to the idea of CRM.
- Under half of commercial contractors (41%) report being satisfied with their CRM (ServiceTitan, Sep 2025).
- 37% name a lack of industry-specific features as a primary challenge (ServiceTitan, Sep 2025).
- 29% name high cost (ServiceTitan, Sep 2025).
- 22% name limited reporting capabilities (ServiceTitan, Sep 2025).
Glossary
- CRM: customer relationship management, software that stores customer records and tracks contacts, quotes and follow-up.
- ROI: return on investment, the money gained for each dollar spent.
- SMB: small and midsize business.
- ACSI: American Customer Satisfaction Index, a national measure of customer satisfaction.
- Sales cycle: the time from first contact with a lead to a signed job.
- Qualified lead: a lead that has agreed to start the sales process, such as booking an appointment.
Methodology and Sources
Figures were selected for the angle of this page: what CRM and related customer-record practices do for return, time, sales, follow-up speed, retention, satisfaction and data quality. Each figure was traced to the entity that ran the study, and the figure sits next to a link to that source. Market size and adoption rates are on the CRM statistics page, and the wider trade picture is on the plumbing industry statistics page. Aggregator pages were not used. Several well-known claims were cut because no original source could be opened, including the often repeated lines that most sales need five or more follow-ups and that CRM raises sales by a fixed percentage.
Several publishers also sell software or services: Salesforce, ServiceTitan, Capterra, Qualtrics and Nucleus Research. Their surveys are cited as research, and readers should weigh them that way. The lead response study is hosted only as an Internet Archive copy of the original InsideSales.com page, whose charts carry a 2009 copyright, so the cited date is the date of the archived copy. The Gartner figure, the data-driven decision making abstract and the Harvard Business Review figures were confirmed against the cited pages or archived copies of them. Salesforce figures link to its public stat library entry for the stat, which lists the report name and month. The US Chamber figures come from a survey run by Teneo Research. The Capterra buyer figures come from phone calls with buyers who contacted Capterra and do not describe the whole market. The page is refreshed monthly.
Sources
- Brynjolfsson, Hitt and Kim, Strength in Numbers (SSRN)
- Capterra
- Capterra
- Gartner
- Harvard Business Review
- Harvard Business Review
- Harvard Business Review
- InsideSales.com Lead Response Management Study
- Journal of Marketing, Fornell, Mithas, Morgeson and Krishnan
- Journal of Marketing, Mithas, Krishnan and Fornell
- Microsoft Dynamics 365 State of Global Customer Service
- MIT Sloan Management Review
- Nucleus Research
- Nucleus Research
- Nucleus Research
- Nucleus Research
- Nucleus Research
- Nucleus Research
- Nucleus Research
- Qualtrics XM Institute
- Salesforce Real Time Connected Customer Research (Salesforce stat library)
- Salesforce Small and Medium Business Trends (Salesforce stat library)
- Salesforce Small Business Productivity Trends (Salesforce stat library)
- Salesforce State of Data and Analytics (Salesforce stat library)
- Salesforce State of Field Service (Salesforce stat library)
- Salesforce State of Sales (Salesforce stat library)
- Salesforce State of Service (Salesforce stat library)
- Salesforce State of the AI Connected Customer (Salesforce stat library)
- Salesforce State of the Connected Customer (Salesforce stat library)
- ServiceTitan
- ServiceTitan
- ServiceTitan
- ServiceTitan
- U.S. Chamber of Commerce