Drinking water statistics describe a system that works for most people and fails, loudly, in a few places. This page pulls the numbers from the agencies that count them: EPA, CDC, USGS, the Government Accountability Office, the Census Bureau and the peer-reviewed studies behind them.
It covers who supplies the water, how often systems break federal rules, how many lead pipes remain, what PFAS monitoring found, how safe private wells are, whether Americans trust the tap and what the repairs will cost. Where two sources disagree, the text says so and names both.
For a plumbing shop, the pattern is clear. The pipe on the customer’s side of the meter, the fixtures and the fittings inside the property are where much of this data turns into a service call. Every figure below is dated and linked to the page or file it came from. Updated October 2026.
For the wider trade, see plumbing industry numbers and plumber workforce numbers. For household use and leaks, see water use at home and water leak numbers.
Key Takeaways
- The EPA’s drinking water database lists 143,024 active public water systems, and 49,342 of them are community systems that serve the same residents year-round (EPA, SDWA data download (ECHO), Oct 2026).
- EPA’s 2025 update estimates 4 million lead service lines: about 3 million reported as lead and about 1 million of unknown material that are predicted to be lead (EPA, 2025 Update to the 7th DWINSA, Nov 2025).
- The 2024 Lead and Copper Rule Improvements lower the lead action level from 15 to 10 micrograms per liter and require most systems to replace lead service lines within 10 years (EPA, LCRI Fact Sheet, Oct 2024).
- In 2025, 4,811 public water systems had at least one health-based violation begin (EPA, SDWA data download (ECHO), Oct 2026).
- EPA estimates that 7.8% of public water systems nationwide had at least one PFAS average above a 2024 federal limit, a comparison that is not a compliance finding (EPA, UCMR 5 Data Summary, Jul 2026).
- The USGS estimates that at least 45% of the nation’s tap water has one or more types of PFAS (USGS, PFAS in tap water news release, Jul 2023).
- More than 43 million people, about 15% of the US population, rely on private wells for drinking water (USGS, Domestic (Private Supply) Wells, Mar 2019).
- About 7.15 million waterborne illnesses occur in the United States each year, resulting in about 6,630 deaths (CDC, Emerging Infectious Diseases, Jan 2021).
- CDC estimates that approximately 500,000 US children have blood lead levels at or above its 3.5 micrograms per deciliter reference value (CDC, About Childhood Lead Poisoning, Aug 2025).
- Over 170 million Americans alive in 2015 had blood lead levels above 5 micrograms per deciliter in early childhood (McFarland et al., PNAS, Mar 2022).
- US drinking water systems reported a $625 billion infrastructure need over 20 years (EPA, 7th DWINSA Report to Congress, Sep 2023).
- Federal law has barred pipes, fittings, solder and flux that are not lead free from drinking water plumbing since June 19, 1986 (U.S. Code, 42 U.S.C. 300g-6, Jun 1986).
- Worldwide, 2.1 billion people still lack safely managed drinking water (WHO/UNICEF JMP, Progress on household drinking water 2000-2024, Aug 2025).
How Many Public Water Systems Serve the United States?
The country has a lot of water systems and most of them are tiny. That mismatch is why small-system staffing, money and testing come up again and again below.
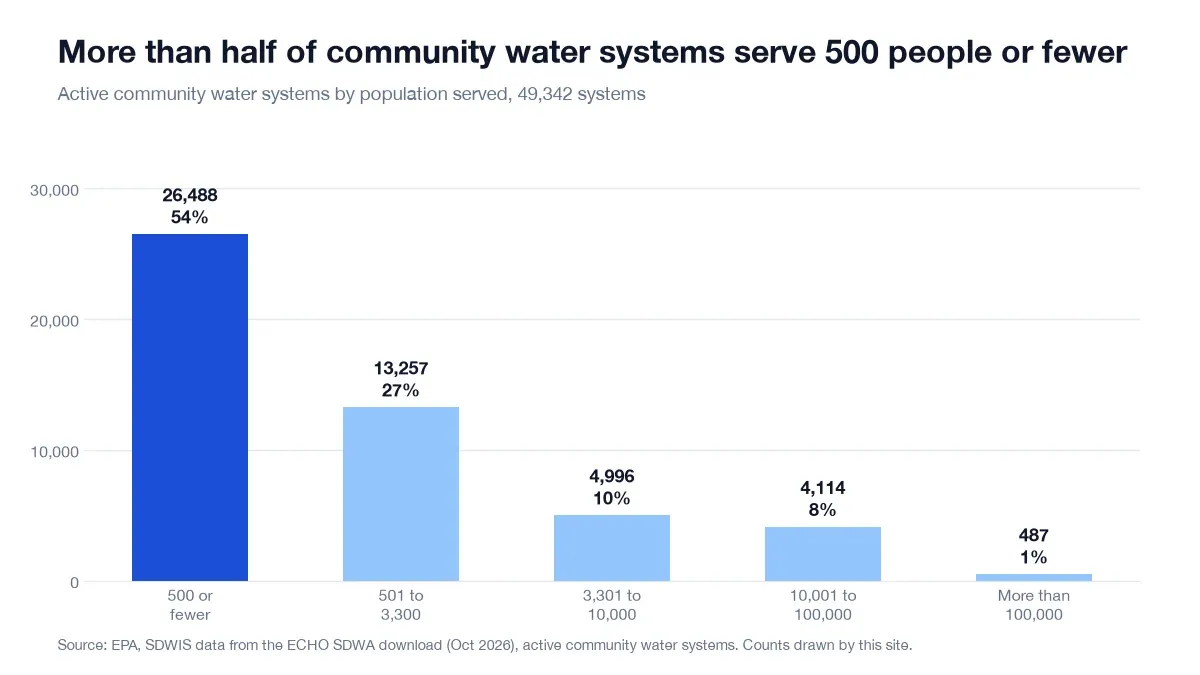 Figure 1: More than half of community water systems serve 500 people or fewer, while 487 serve more than 100,000. Source: EPA, SDWA Data Download Summary (ECHO), Oct 2026. Chart drawn by this site from the source data, captured 21 Oct 2026.
How many systems are there, and who do they reach?
- Public water systems regulated by EPA and delegated states and tribes provide drinking water to 90 percent of Americans (EPA, Information about Public Water Systems, Mar 2026).
- EPA says there are over 148,000 public water systems in the United States, a higher count than the active systems listed in its ECHO database (EPA, Information about Public Water Systems, Mar 2026).
- The ECHO database counts 76,629 active transient non-community systems, such as gas stations and campgrounds, and 17,053 non-transient non-community systems, such as schools, factories and hospitals that run their own water (EPA, SDWA data download (ECHO), Oct 2026).
- Federal law defines a public water system as one with at least 15 service connections or one that regularly serves at least 25 individuals (U.S. Code, 42 U.S.C. 300f, Dec 2016).
- A community water system must serve at least 15 service connections used by year-round residents or regularly serve at least 25 year-round residents (U.S. Code, 42 U.S.C. 300f, Dec 2016).
Who owns and runs community water systems?
- Local governments own 24,094 active community water systems and private owners hold another 22,496 (EPA, SDWA data download (ECHO), Oct 2026).
- Of all community systems, 26,488 serve 500 people or fewer, and 487 serve more than 100,000 (EPA, SDWA data download (ECHO), Oct 2026).
- The 2022 Economic Census counted 3,887 firms and 4,733 establishments in water supply and irrigation systems (Census Bureau, Economic Census, Dec 2024).
- Those establishments employed 47,290 people (Census Bureau, Economic Census, Dec 2024).
- They reported $16.28 billion in receipts and $3.17 billion in annual payroll (Census Bureau, Economic Census, Dec 2024).
- The United States had 131,000 water and wastewater treatment plant and system operator jobs in 2025 (BLS, Occupational Outlook Handbook, Aug 2026).
- BLS lists median pay for those operators at $60,020 a year (BLS, Occupational Outlook Handbook, Aug 2026).
- BLS projects operator employment to fall 6% from 2025 to 2035, a loss of about 7,500 jobs (BLS, Occupational Outlook Handbook, Aug 2026).
How much of the country drinks fluoridated water?
- In 2022, 72.3% of the US population on community water systems received fluoridated water (CDC, Water Fluoridation Statistics 2022, Jun 2024).
- That was 209,135,866 people on fluoridated systems (CDC, Water Fluoridation Statistics 2022, Jun 2024).
How Often Do Water Systems Break Water Quality Rules?
Most violations are missed tests and late reports. The health-based ones are fewer, but thousands of systems still log one every year, and a lead paperwork deadline in 2024 more than doubled the count.
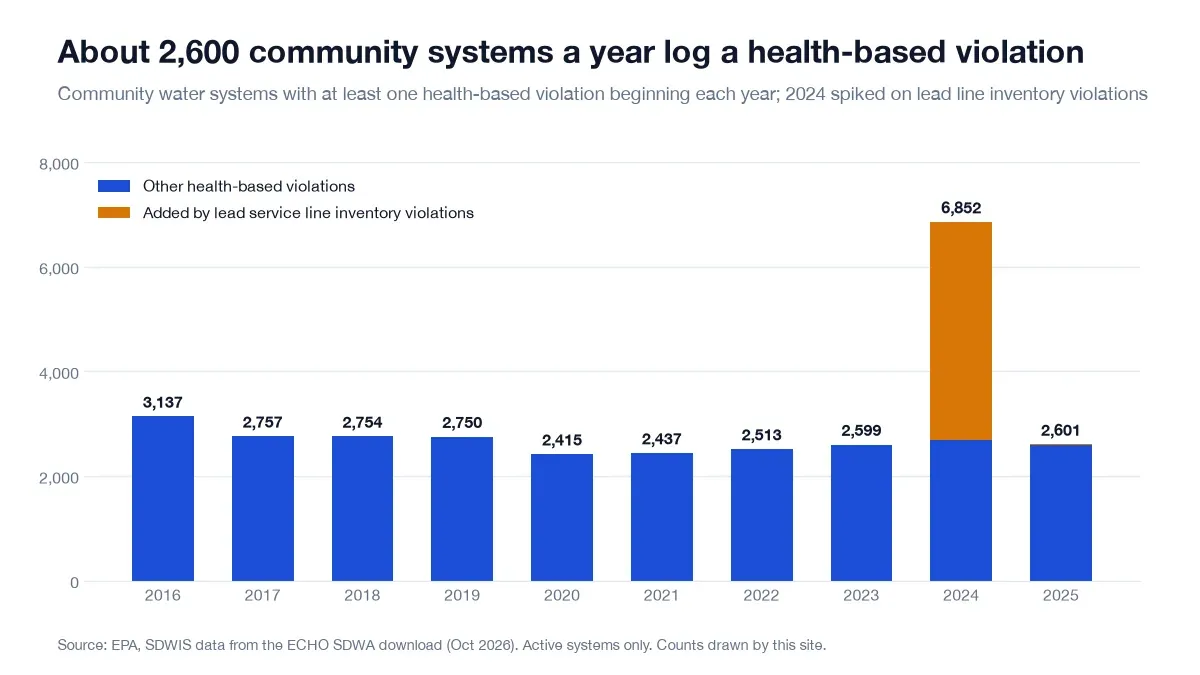 Figure 2: Health-based violations touched about 2,600 community systems a year until lead service line inventory violations pushed 2024 to 6,852. Source: EPA, SDWA Data Download Summary (ECHO), Oct 2026. Chart drawn by this site from the source data, captured 21 Oct 2026.
How many violations do water systems log each year?
- A total of 125,069 violations began in 2025 at 33,205 active systems, and only 10,508 of them were health-based (EPA, SDWA data download (ECHO), Oct 2026).
- Maximum contaminant level violations made up 5,916 of the health-based group, and treatment technique violations made up 4,580 (EPA, SDWA data download (ECHO), Oct 2026).
- Monitoring and reporting violations, which are not health-based, totaled 95,344 (EPA, SDWA data download (ECHO), Oct 2026).
Which rules cause the most health-based violations?
- The Stage 2 disinfection byproducts rule produced a health-based violation at 825 community systems in 2025, more than any other rule (EPA, SDWA data download (ECHO), Oct 2026).
- The Ground Water Rule followed with 419 community systems, and the Revised Total Coliform Rule with 284 (EPA, SDWA data download (ECHO), Oct 2026).
- Arsenic led to health-based violations at 203 community systems, radionuclides at 188 and nitrate at 176 (EPA, SDWA data download (ECHO), Oct 2026).
- In 2024, 6,536 lead service line inventory violations were logged at 6,535 systems (EPA, SDWA data download (ECHO), Oct 2026).
What happens after a violation?
- States and EPA recorded 255,947 enforcement actions in 2025 across 43,611 systems, and only 3,765 of them were formal (EPA, SDWA data download (ECHO), Oct 2026).
- As of the October 2026 data, 7,482 health-based violations were still unaddressed or addressed but not resolved, at 4,882 systems (EPA, SDWA data download (ECHO), Oct 2026).
How many people get sick from tap water?
- Waterborne infections cause about 601,000 emergency department visits a year (CDC, Emerging Infectious Diseases, Jan 2021).
- They also cause about 118,000 hospitalizations a year (CDC, Emerging Infectious Diseases, Jan 2021).
- Direct healthcare costs come to about $3.33 billion a year (CDC, Emerging Infectious Diseases, Jan 2021).
- The 95% credible interval for annual waterborne illnesses runs from 3.88 million to 12.0 million (CDC, Emerging Infectious Diseases, Jan 2021).
- The CDC analysis covered 17 waterborne infectious diseases (CDC, Emerging Infectious Diseases, Jan 2021).
- From 2015 to 2020, public health officials in 28 states reported 214 outbreaks tied to drinking water (CDC, MMWR Surveillance Summaries, Mar 2024).
- Those outbreaks caused at least 2,140 illnesses, 563 hospitalizations and 88 deaths (CDC, MMWR Surveillance Summaries, Mar 2024).
- Public water systems were linked to 172 of the outbreaks, or 80% (CDC, MMWR Surveillance Summaries, Mar 2024).
- Investigators recorded 454 contributing factor types across the 214 outbreaks (CDC, MMWR Surveillance Summaries, Mar 2024).
- Biofilm-associated pathogens caused 187 of the outbreaks (87%), and enteric illness pathogens caused 24 (11%) (CDC, MMWR Surveillance Summaries, Mar 2024).
- Enteric pathogens were behind 1,299 illnesses, or 61% of the total (CDC, MMWR Surveillance Summaries, Mar 2024).
- Norovirus, Shigella and Campylobacter, alone or in mixed cases, accounted for 1,225 of those enteric illnesses, or 94% (CDC, MMWR Surveillance Summaries, Mar 2024).
- For enteric outbreaks, the drinking water source was the most common contributing factor, cited 34 times or 7% (CDC, MMWR Surveillance Summaries, Mar 2024).
How Many Lead Service Lines Are Left?
The national estimate fell by more than half in two years. The two numbers come from different methods: a 2021 survey of a sample of systems scaled up to the nation, and the inventories that states filed in 2025.
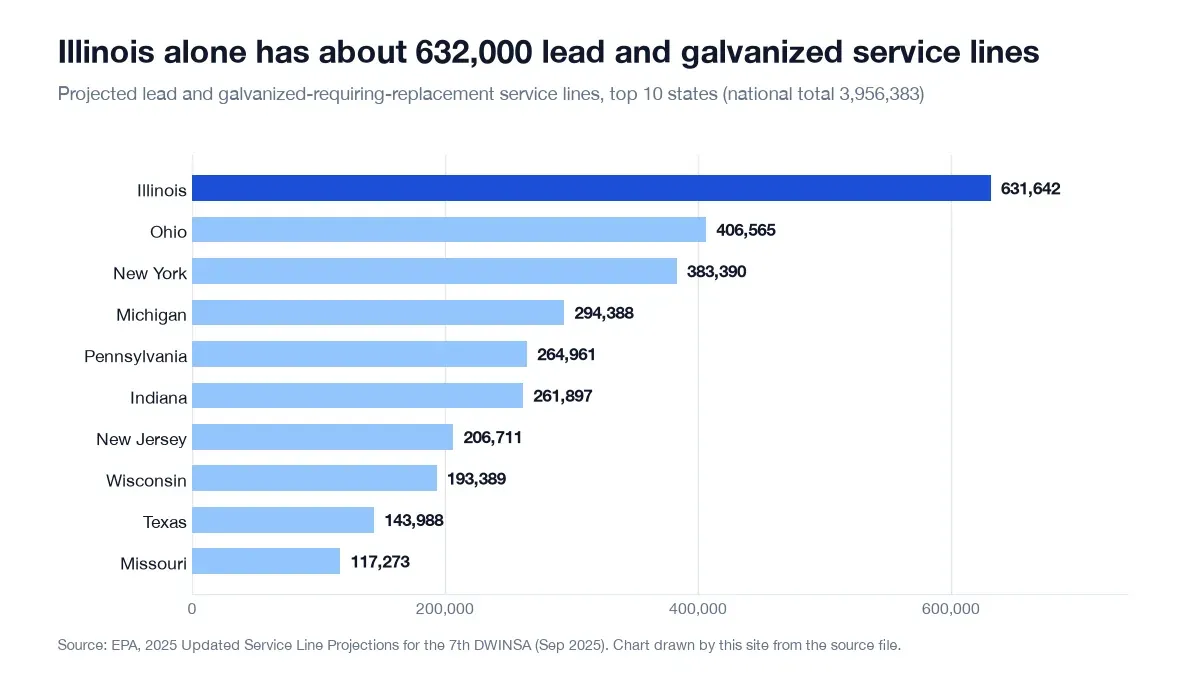 Figure 3: Illinois projects about 225,000 more lead and galvanized lines than Ohio, the next state, and the top ten states hold about three quarters of the national total. Source: EPA, 2025 Updated Service Line Projections, Sep 2025. Chart drawn by this site from the source file, captured 21 Oct 2026.
How did the lead pipe estimate change?
- EPA’s 2023 report to Congress projected 9.2 million lead service lines nationwide (EPA, 7th DWINSA Report to Congress, Sep 2023).
- EPA put the cost of replacing that many lines at roughly $50 billion to $80 billion in 2021 dollars (EPA, 7th DWINSA Report to Congress, Sep 2023).
- States had to send service line inventory data to EPA by March 31, 2025, and could update it by June 30, 2025 (EPA, 2025 Update to the 7th DWINSA, Nov 2025).
- ASCE’s 2025 report card still says more than 9 million lead service lines exist (ASCE, 2025 Report Card for Drinking Water, Nov 2025).
Which states have the most lead and galvanized lines?
- EPA’s 2025 projection counts 3,956,383 lead and galvanized-requiring-replacement lines out of 102,958,322 service lines, split into 2,659,983 lead lines and 1,296,400 galvanized lines (EPA, 2025 Updated Service Line Projections, Sep 2025).
- Illinois projects 631,642 lead and galvanized lines, the most of any state (EPA, 2025 Updated Service Line Projections, Sep 2025).
- Ohio projects 406,565, New York 383,390 and Michigan 294,388 (EPA, 2025 Updated Service Line Projections, Sep 2025).
What does federal law say about lead in plumbing?
- The federal definition of lead free allows a weighted average of not more than 0.25% lead on the wetted surfaces of pipes, fittings and fixtures (U.S. Congress, Public Law 111-380, Jan 2011).
- For solder and flux, lead free means not more than 0.2% lead (U.S. Congress, Public Law 111-380, Jan 2011).
- The 0.25% definition took effect 36 months after the law was signed on January 4, 2011 (U.S. Congress, Public Law 111-380, Jan 2011).
- CDC notes that household plumbing fixtures, welding solder and pipe fittings made before 1986 may also contain lead (CDC, Lead in Drinking Water, Aug 2025).
- CDC lists housing age as a risk factor for lead exposure and notes that lead paint was banned in 1978 (CDC, Lead Risk Factors, Aug 2026).
What Does Lead in Water Do to Health?
Water is rarely the only source of lead, but it is the one a plumber can fix. The health data point the same way: even small doses matter, and the harm lasts a lifetime.
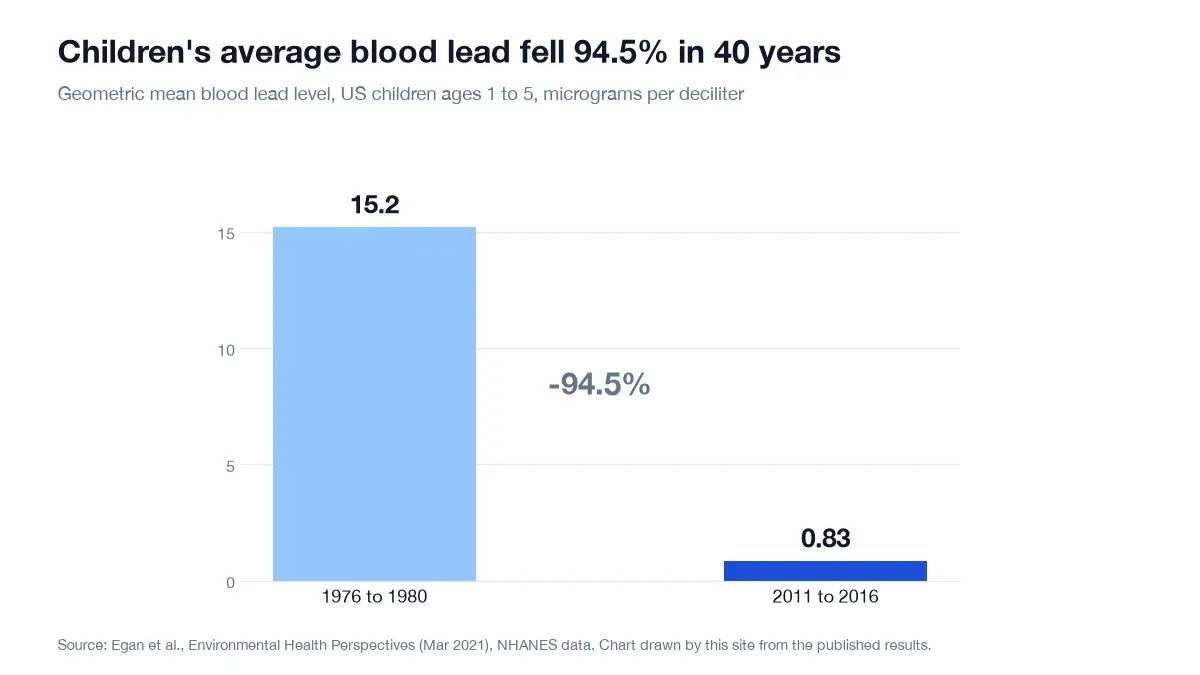 Figure 4: Average blood lead in young children fell from 15.2 to 0.83 micrograms per deciliter in about 40 years, yet risk still tracks poverty, race and housing age. Source: Egan et al., Environmental Health Perspectives, Mar 2021. Chart drawn by this site from the published results, captured 21 Oct 2026.
How much lead exposure comes from tap water?
- EPA estimates that drinking water can make up 20 percent or more of a person’s total exposure to lead (EPA, Basic Information about Lead in Drinking Water, Jun 2026).
- Infants who consume mostly mixed formula can get 40 percent to 60 percent of their lead exposure from drinking water (EPA, Basic Information about Lead in Drinking Water, Jun 2026).
- EPA says testing a home’s water for lead costs between $20 and $100 (EPA, Basic Information about Lead in Drinking Water, Jun 2026).
- CDC reports that about 3 million blood lead test results reach it each year (CDC, National Blood Lead Surveillance, Sep 2025).
- Medicaid requires lead tests for children at 12 and 24 months (CDC, Testing for Lead, Mar 2026).
How many children have elevated blood lead?
- About 385,775 children ages 1 to 11 had blood lead at or above 5 micrograms per deciliter in 2011 to 2016 (Egan et al., Environmental Health Perspectives, Mar 2021).
- For children ages 6 to 11, average blood lead fell 95.3%, from 12.7 to 0.60 micrograms per deciliter (Egan et al., Environmental Health Perspectives, Mar 2021).
- The CDC reference value marks the 97.5th percentile of blood lead in children ages 1 to 5, so children at or above it are among the top 2.5% (CDC, Testing for Lead, Mar 2026).
- In Flint, the share of children under 5 with elevated blood lead rose from 2.4% in 2013 to 4.9% in 2015, after the water source change (Hanna-Attisha et al., American Journal of Public Health, Feb 2016).
- In the Flint neighborhoods with the highest water lead levels, the increase was 6.6% (Hanna-Attisha et al., American Journal of Public Health, Feb 2016).
- Flint students showed lower math achievement and more special needs classifications, even in homes with copper service lines (Science Advances, Flint water crisis and schooling, Mar 2024).
- Roughly 100,000 Flint residents were exposed to polluted water for over a year and a half (Science Advances, Flint water crisis and schooling, Mar 2024).
What does lead cost adults and society?
- More than 54 million Americans had blood lead above 15 micrograms per deciliter in early childhood (McFarland et al., PNAS, Mar 2022).
- More than 4.5 million had blood lead above 30 micrograms per deciliter (McFarland et al., PNAS, Mar 2022).
- The same study estimates that lead exposure explains 824,097,690 lost IQ points as of 2015 (McFarland et al., PNAS, Mar 2022).
- Researchers attribute 412,000 US deaths a year to low-level lead exposure, which is 18.0% of all-cause mortality in their study (Lanphear et al., The Lancet Public Health, Apr 2018).
- About 256,000 of those deaths a year are from cardiovascular disease (Lanphear et al., The Lancet Public Health, Apr 2018).
- In the 14,289 adults followed, 20% had blood lead of at least 5 micrograms per deciliter at the start (Lanphear et al., The Lancet Public Health, Apr 2018).
How many schools have tested for lead in water?
- In a 2017 survey, 43% of school districts serving 35 million students had tested for lead (GAO, K-12 Education: Lead Testing of School Drinking Water, Jul 2018).
- Another 41% of districts, serving 12 million students, had not tested in the prior 12 months (GAO, K-12 Education: Lead Testing of School Drinking Water, Jul 2018).
- Of the districts that tested, 37% found elevated lead and reduced or eliminated exposure (GAO, K-12 Education: Lead Testing of School Drinking Water, Jul 2018).
- Another 16% of districts did not know whether they had tested (GAO, K-12 Education: Lead Testing of School Drinking Water, Jul 2018).
- At least 8 states require schools to test for lead (GAO, K-12 Education: Lead Testing of School Drinking Water, Jul 2018).
What Do the Lead and Copper Rules Require Now?
The 2024 rule moves pipe replacement from an option to a deadline for most systems. EPA also put a price on what that deadline costs and what it buys.
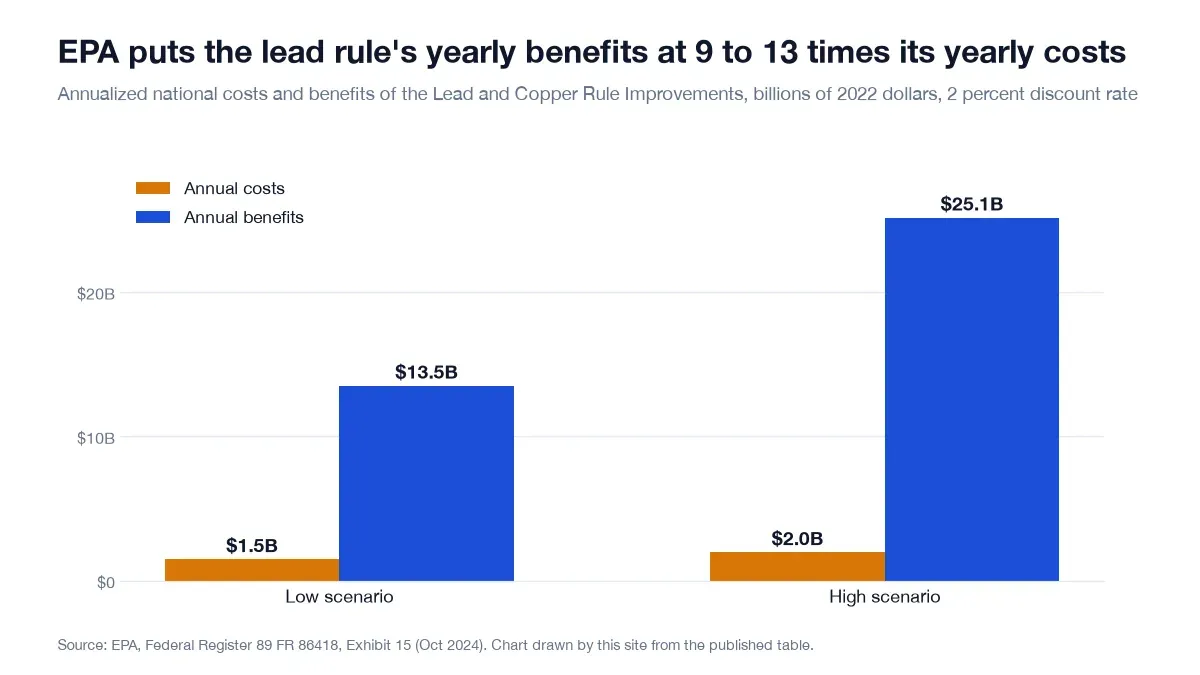 Figure 5: EPA’s own table puts the lead rule’s yearly benefits at roughly 9 to 13 times its yearly costs under low and high scenarios. Source: EPA, Federal Register LCRI final rule, Oct 2024. Chart drawn by this site from the published table, captured 21 Oct 2026.
What changed in the 2024 lead rule?
- The 1991 Lead and Copper Rule set an action level of 15 parts per billion, triggered when more than 10% of sampled taps exceed it (EPA, Lead and Copper Rule, Jan 2026).
- Under the 2024 rule, sites with lead service lines must be sampled at the first liter and the fifth liter, and the higher value counts (EPA, LCRI Fact Sheet, Oct 2024).
- Community and non-transient non-community water systems must comply with the new requirements no later than November 1, 2027, with some exceptions (EPA, Federal Register LCRI final rule, Oct 2024).
What does EPA say the rule will cost and save?
- EPA estimates annualized costs of $1.47 billion to $1.95 billion and annualized benefits of $13.49 billion to $25.14 billion (EPA, Federal Register LCRI final rule, Oct 2024).
- EPA says the rule will protect up to 900,000 infants a year from low birthweight (EPA, LCRI Fact Sheet, Oct 2024).
- It also expects to prevent ADHD in up to 2,600 children and to cut up to 1,500 premature deaths from heart disease each year (EPA, LCRI Fact Sheet, Oct 2024).
- EPA expects to prevent up to 200,000 lost IQ points in children each year (EPA, LCRI Fact Sheet, Oct 2024).
Who pays for lead pipe replacement?
- The Infrastructure Investment and Jobs Act set aside $15 billion in drinking water revolving fund grants for lead service line replacement (U.S. Congress, Public Law 117-58, Nov 2021).
- It added $11.713 billion in general drinking water revolving fund grants (U.S. Congress, Public Law 117-58, Nov 2021).
- The law requires states to give 49 percent of those funds as grants or full principal forgiveness (U.S. Congress, Public Law 117-58, Nov 2021).
- The lead line money comes in $3 billion installments for each fiscal year from 2022 through 2026 (U.S. Congress, Public Law 117-58, Nov 2021).
How Much PFAS Is in US Tap Water?
PFAS turned up in nearly half of US tap water by USGS’s estimate, and in public and private supplies alike. The question is no longer whether it is there but how much, and at which systems.
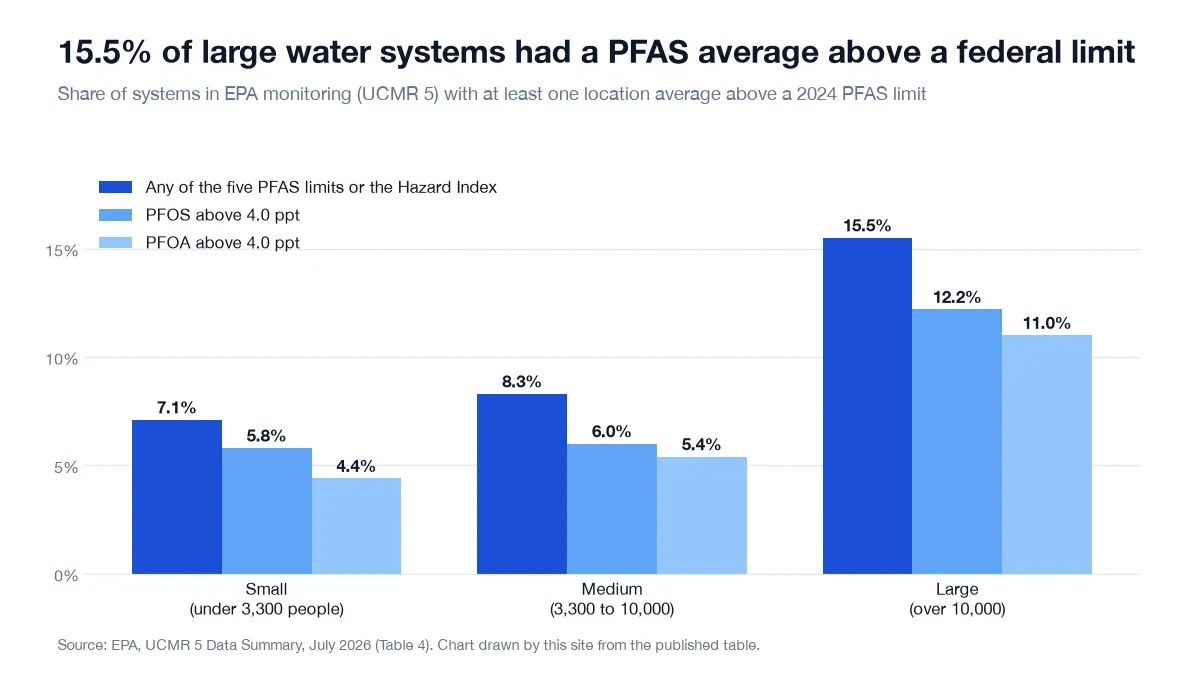 Figure 6: Large systems were twice as likely as small ones to have a PFAS average above a 2024 limit, though EPA says these results are not compliance findings. Source: EPA, UCMR 5 Data Summary, Jul 2026. Chart drawn by this site from the published table, captured 21 Oct 2026.
How common is PFAS in tap water samples?
- USGS scientists collected tap water samples from 716 locations (USGS, PFAS in tap water news release, Jul 2023).
- The samples came from 269 private wells and 447 public supply locations, taken from 2016 to 2021 (Smalling et al., Environment International, Aug 2023).
- PFAS concentrations were similar between public supplies and private wells (USGS, PFAS in tap water news release, Jul 2023).
- The number of individual PFAS observed ranged from 1 to 9, with a median of 2 (Smalling et al., Environment International, Aug 2023).
- PFBS, PFHxS and PFOA were each found in about 15% of samples (Smalling et al., Environment International, Aug 2023).
- In all, 17 different PFAS were observed at least once (Smalling et al., Environment International, Aug 2023).
- Combined PFAS concentrations in the samples ranged from 0.348 to 346 nanograms per liter (Smalling et al., Environment International, Aug 2023).
What did EPA’s national monitoring find?
- The final UCMR 5 dataset covers about 10,130 water systems and about 25,950 sampling locations (EPA, UCMR 5 Data Summary, Jul 2026).
- Among 4,277 large systems with full results, 662 had at least one average above a limit (EPA, UCMR 5 Data Summary, Jul 2026).
- Of sampling locations with at least one PFAS detection, 66% had more than one PFAS (EPA, UCMR 5 Data Summary, Jul 2026).
- At 3,183 sampling locations three or more different PFAS were found, and the most found together at one location was 13 (EPA, UCMR 5 Data Summary, Jul 2026).
What do health agencies say about PFAS in people?
- ATSDR reports that nearly all people in the US have PFAS in their blood (ATSDR, PFAS in the US Population, Nov 2024).
- Blood levels of PFOS fell by more than 85% between 1999 and 2000 and 2018 and 2019 (ATSDR, PFAS in the US Population, Nov 2024).
- Blood levels of PFOA fell by more than 70% over the same period (ATSDR, PFAS in the US Population, Nov 2024).
- An analysis of EPA monitoring from 2013 to 2015 found drinking water supplies for 6 million US residents above the 70 parts per trillion lifetime health advisory for PFOS and PFOA (Hu et al., Environmental Science & Technology Letters, Oct 2016).
- The same analysis linked each additional military site in a watershed to a 35% increase in PFOS and a 20% increase in PFHxS where those PFAS were detected (Hu et al., Environmental Science & Technology Letters, Oct 2016).
- EPA expects the 2024 rule to reduce PFAS exposure for approximately 100 million Americans (EPA, PFAS Rule Fact Sheet, Apr 2024).
What Is Changing in Federal Drinking Water Rules?
Federal rules move slowly and then all at once. In 2026 EPA proposed to reopen part of the PFAS rule, to push back one PFAS deadline and to regulate perchlorate for the first time.
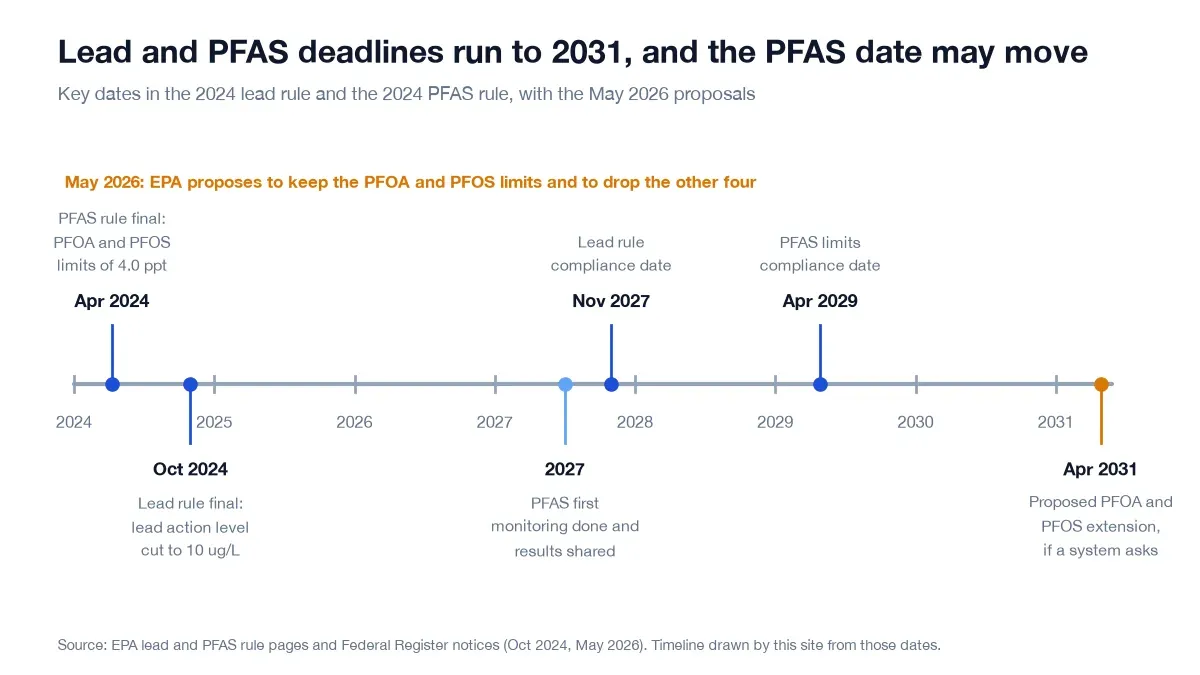 Figure 7: The lead rule’s compliance date is November 2027, while the PFAS compliance date is April 2029 and could move to April 2031 if EPA’s May 2026 proposal is finalized. Source: EPA, PFAS National Primary Drinking Water Regulation, May 2026. Timeline drawn by this site from the cited dates, captured 21 Oct 2026.
Will the PFAS limits take effect on time?
- The April 2024 PFAS rule set legally enforceable limits of 4.0 parts per trillion for PFOA and PFOS (EPA, PFAS National Primary Drinking Water Regulation, May 2026).
- Systems must finish initial PFAS monitoring by 2027 and fix any problem by 2029 (EPA, PFAS National Primary Drinking Water Regulation, May 2026).
- EPA proposed in May 2026 to extend the PFOA and PFOS compliance date from April 26, 2029 to April 26, 2031 for systems that ask (EPA, Federal Register PFOA and PFOS deadline proposal, May 2026).
- A second May 2026 proposal would rescind the limits for PFHxS, PFNA, GenX and the Hazard Index mixture (EPA, Federal Register PFAS rescission proposal, May 2026).
- Congress provided $5 billion in grants for addressing emerging contaminants under section 1459A of the Safe Drinking Water Act (U.S. Congress, Public Law 117-58, Nov 2021).
- It also provided $4 billion in drinking water revolving fund grants for emerging contaminants, with a focus on PFAS (U.S. Congress, Public Law 117-58, Nov 2021).
What other rules are in the pipeline?
- EPA proposed in January 2026 to set a perchlorate goal of 20 micrograms per liter, with possible limits of 20, 40 or 80 (EPA, Federal Register perchlorate proposal, Jan 2026).
- The draft sixth Contaminant Candidate List names 75 chemicals, 4 chemical groups and 9 microbes (EPA, Federal Register draft CCL 6, Apr 2026).
- The proposed UCMR 6 would test for 7 ultrashort organofluorine compounds, 3 pesticide metabolites, 13 semivolatile organic compounds and 7 purgeable organic compounds (EPA, Federal Register UCMR 6 proposal, Jul 2026).
How Safe Is Water From Private Wells?
Nobody tests a private well unless the owner does. The federal government does not regulate them, so the data come from studies, not from compliance records.
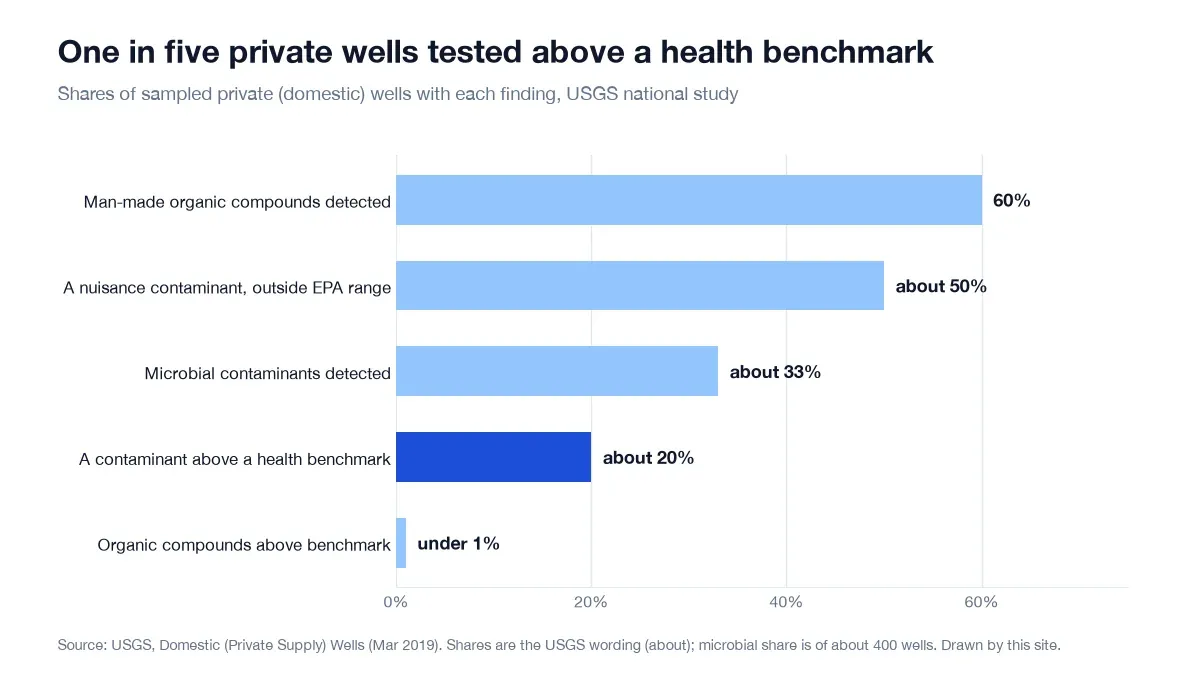 Figure 8: About one in five private wells in the USGS study had at least one contaminant above a human-health benchmark, and a third had microbial contaminants. Source: USGS, Domestic (Private Supply) Wells, Mar 2019. Chart drawn by this site from the USGS wording, captured 21 Oct 2026.
Who is responsible for well water quality?
- EPA estimates that more than 23 million households rely on private wells (EPA, Private Drinking Water Wells, Aug 2026).
- The Safe Drinking Water Act does not regulate private wells that serve fewer than 25 individuals (EPA, Overview of the Safe Drinking Water Act, Dec 2025).
- USGS tested 2,100 domestic wells and found about one in five contained a contaminant above a human-health benchmark (USGS, Domestic (Private Supply) Wells, Mar 2019).
What turns up in well water?
- Man-made organic compounds such as pesticides and solvents were detected in 60 percent of the wells sampled (USGS, Domestic (Private Supply) Wells, Mar 2019).
- Fewer than 1 percent of wells had those compounds above a health benchmark (USGS, Domestic (Private Supply) Wells, Mar 2019).
- About half of the wells had at least one nuisance contaminant outside the range EPA recommends (USGS, Domestic (Private Supply) Wells, Mar 2019).
- Microbial contaminants were found in about one-third of the roughly 400 wells analyzed for them (USGS, Domestic (Private Supply) Wells, Mar 2019).
How often do private wells cause outbreaks?
- Individual or private systems were tied to 17 of the 214 drinking water outbreaks, or 8% (CDC, MMWR Surveillance Summaries, Mar 2024).
- They caused 944 illnesses, or 43% of all cases (CDC, MMWR Surveillance Summaries, Mar 2024).
- They also accounted for 14 deaths, or 16% of the total (CDC, MMWR Surveillance Summaries, Mar 2024).
- When the water source was known in enteric disease outbreaks, wells were identified in 13 of 14, or 93% (CDC, MMWR Surveillance Summaries, Mar 2024).
Do Americans Drink Tap Water or Bottled Water?
More Americans are skipping the tap, and the rise is concentrated among Black and Hispanic households. Bottled water fills part of the gap, with its own rules.
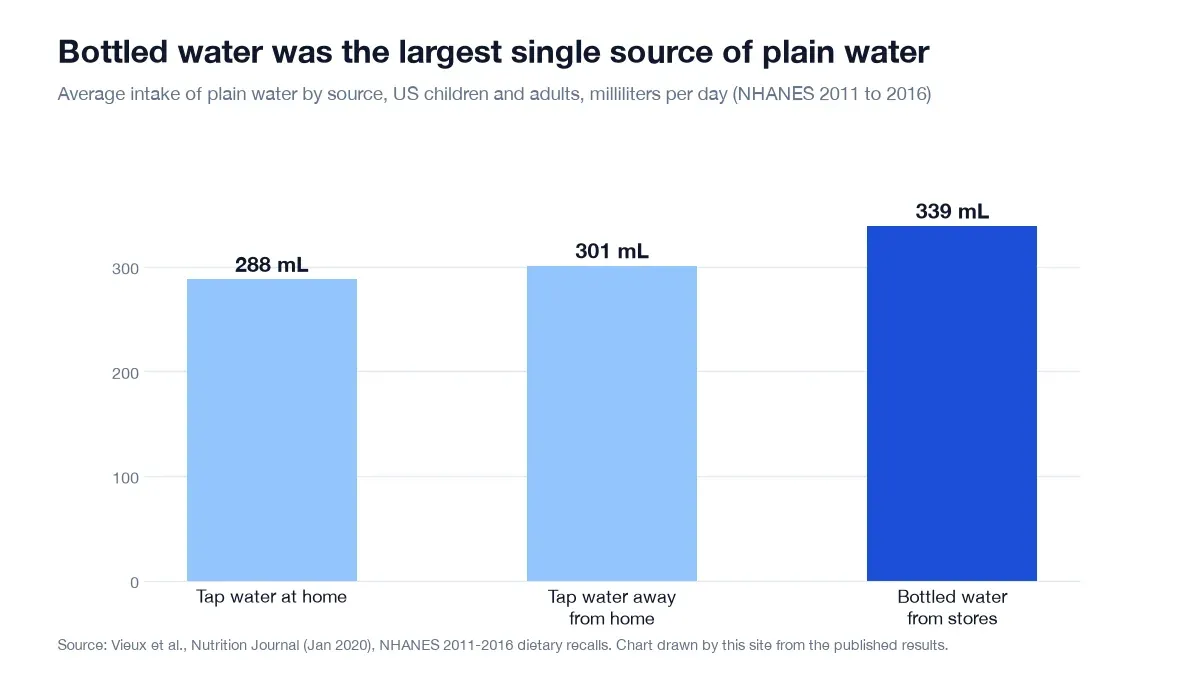 Figure 9: Bottled water from stores was the largest single source of plain water in NHANES recalls, ahead of tap water at home and away from home. Source: Vieux et al., Nutrition Journal, Jan 2020. Chart drawn by this site from the published results, captured 21 Oct 2026.
How much plain water do people drink, and from where?
- The study drew on dietary recalls from 7,453 children and 15,263 adults (Vieux et al., Nutrition Journal, Jan 2020).
- Total dietary water averaged 2,718 milliliters a day, with 1,066 milliliters from plain water (Vieux et al., Nutrition Journal, Jan 2020).
- Only about 40% of the NHANES sample followed US recommendations for adequate water intake (Vieux et al., Nutrition Journal, Jan 2020).
- Higher tap water consumption went with higher income, but bottled water consumption did not (Vieux et al., Nutrition Journal, Jan 2020).
- Non-Hispanic white respondents drank the most tap water at 781 milliliters a day, and Mexican Americans drank the most bottled water at 605 (Vieux et al., Nutrition Journal, Jan 2020).
How many people avoid tap water?
- In 2017 to 2018, the prevalence of not drinking tap water was 63% higher for children and 40% higher for adults than in 2013 to 2014 (Rosinger et al., Public Health Nutrition, Feb 2022).
- The share of Black adults who did not drink tap water rose from 24.6% to 34.5% (Rosinger et al., Public Health Nutrition, Feb 2022).
- Among Hispanic adults it rose from 27.1% to 38.1% (Rosinger et al., Public Health Nutrition, Feb 2022).
- The analysis covered 9,439 children and 17,268 adults (Rosinger et al., Public Health Nutrition, Feb 2022).
Is bottled water held to a different standard?
- FDA sets the allowable lead level in bottled water at 0.005 milligrams per liter (FDA, 21 CFR 165.110 (eCFR), Oct 2026).
- The FDA limit for arsenic in bottled water is 0.010 milligrams per liter (FDA, 21 CFR 165.110 (eCFR), Oct 2026).
- The FDA limit for nitrate in bottled water is 10 milligrams per liter, measured as nitrogen (FDA, 21 CFR 165.110 (eCFR), Oct 2026).
- The FDA limit for copper in bottled water is 1.0 milligrams per liter (FDA, 21 CFR 165.110 (eCFR), Oct 2026).
- Community water systems must deliver an annual Consumer Confidence Report to customers by July 1 of each year (EPA, Basic Information about Lead in Drinking Water, Jun 2026).
How Does the United States Compare With the World?
The United States has plenty of problems at the tap, but they sit on top of a basic service that a quarter of the world’s people still lack. Context keeps the numbers honest.
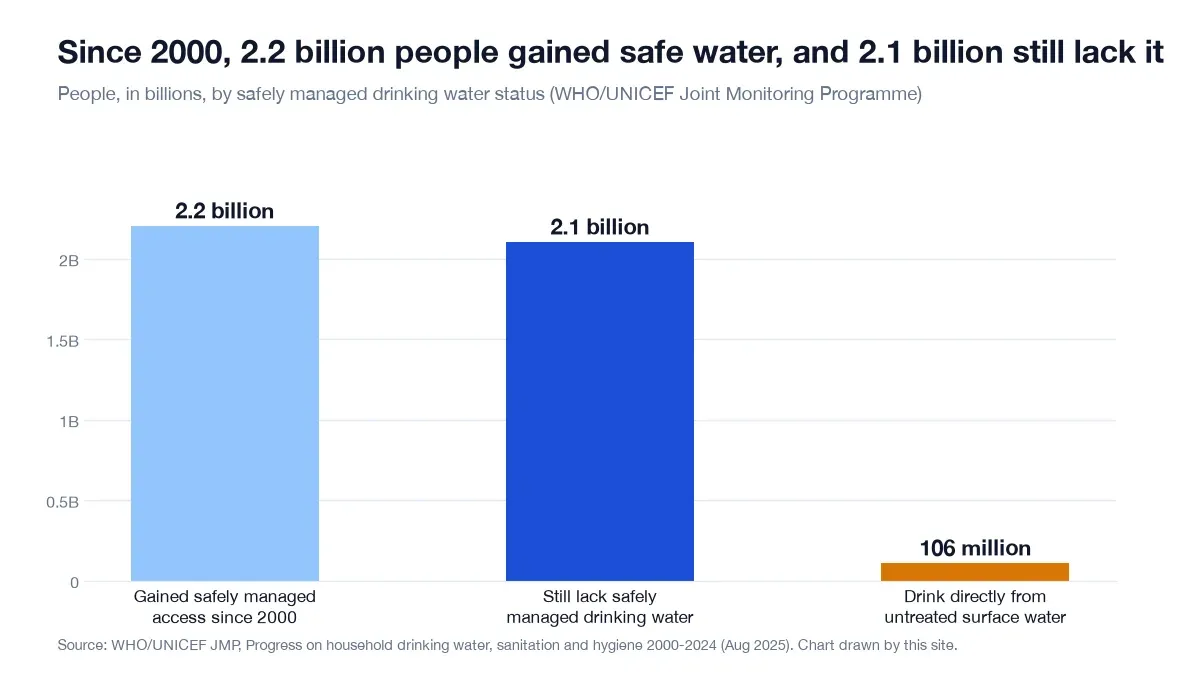 Figure 10: The world added safe water for 2.2 billion people since 2000, yet 2.1 billion still lack it. Source: WHO/UNICEF JMP, Progress on household drinking water 2000-2024, Aug 2025. Chart drawn by this site from the report’s headline figures, captured 21 Oct 2026.
How many people gained or still lack safe water?
- About 2.2 billion people gained access to safely managed drinking water between 2000 and 2024 (WHO/UNICEF JMP, Progress on household drinking water 2000-2024, Aug 2025).
- Of those still without it, 106 million drink directly from untreated surface water (WHO/UNICEF JMP, Progress on household drinking water 2000-2024, Aug 2025).
- The JMP global database covers 237 countries, areas and territories (WHO/UNICEF JMP, Progress on household drinking water 2000-2024, Aug 2025).
How many people drink contaminated water?
- In 2022, at least 1.7 billion people used a drinking water source contaminated with feces (WHO, Drinking-water fact sheet, Sep 2023).
- Contaminated drinking water is estimated to cause approximately 505,000 diarrhoeal deaths each year (WHO, Drinking-water fact sheet, Sep 2023).
How many Americans lack basic water service?
- More than two million Americans lack access to running water, indoor plumbing or wastewater services (US Water Alliance and DigDeep, Closing the Water Access Gap, Nov 2019).
What Will It Cost to Keep Tap Water Safe?
The bill is mostly for pipes in the ground, not for treatment plants, and most of it sits with medium and large community systems.
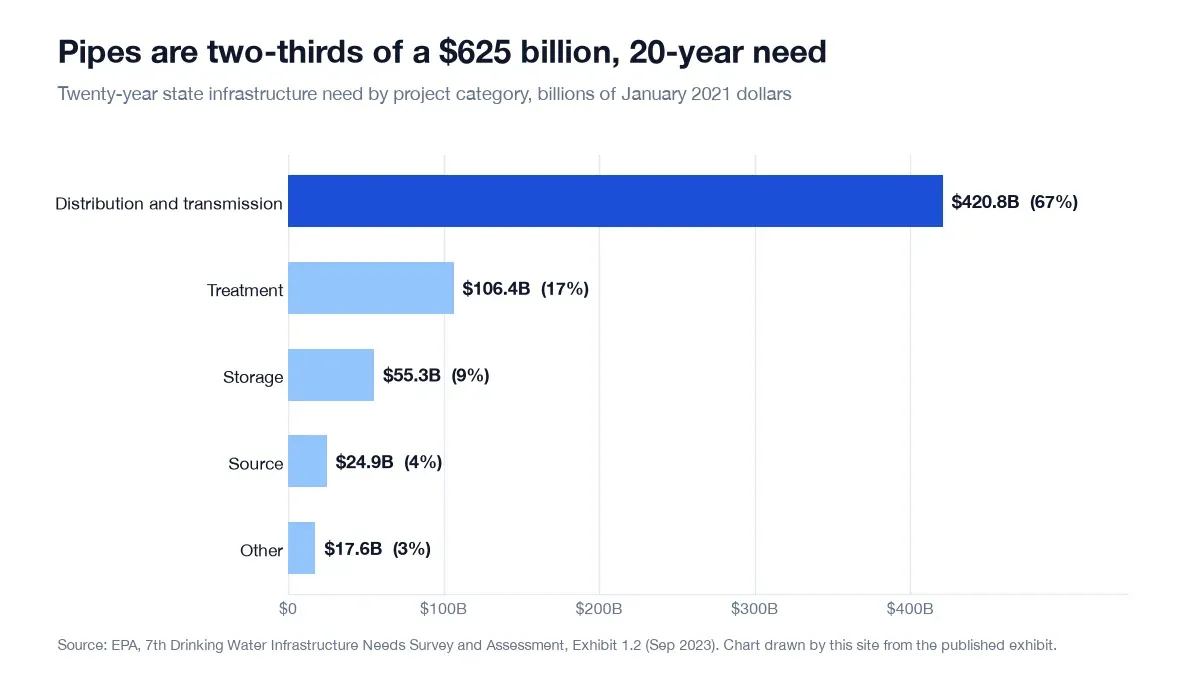 Figure 11: Distribution and transmission pipes make up $420.8 billion, or 67%, of the 20-year state need. Source: EPA, 7th DWINSA Report to Congress, Sep 2023. Chart drawn by this site from the published exhibit, captured 21 Oct 2026.
Where does the $625 billion go?
- In EPA’s size classes, community systems serving over 100,000 people account for $235.2 billion (37%) of the state need, those serving 3,301 to 100,000 for $273.1 billion (44%) and those serving 3,300 or fewer for $100.1 billion (16%) (EPA, 7th DWINSA Report to Congress, Sep 2023).
Who will do the work?
- In the same size classes, 34.99% of small systems, 47.37% of medium systems and 48.25% of large systems reported difficulty hiring employees or contracted operators (EPA, 7th DWINSA Report to Congress, Sep 2023).
What does ASCE say about the funding gap?
- ASCE grades US drinking water infrastructure C- (ASCE, 2025 Report Card for Drinking Water, Nov 2025).
- Its 2024 study put the gap between needs and investment at $309 billion and projects $620 billion by 2043 (ASCE, 2025 Report Card for Drinking Water, Nov 2025).
What Does This Mean for Plumbers?
Most of the lead and PFAS work lands on utilities, but the plumbing inside the property is where a licensed plumber earns the call. The numbers below show the jobs are priced across a wide range, which is where a flat quote can go wrong.
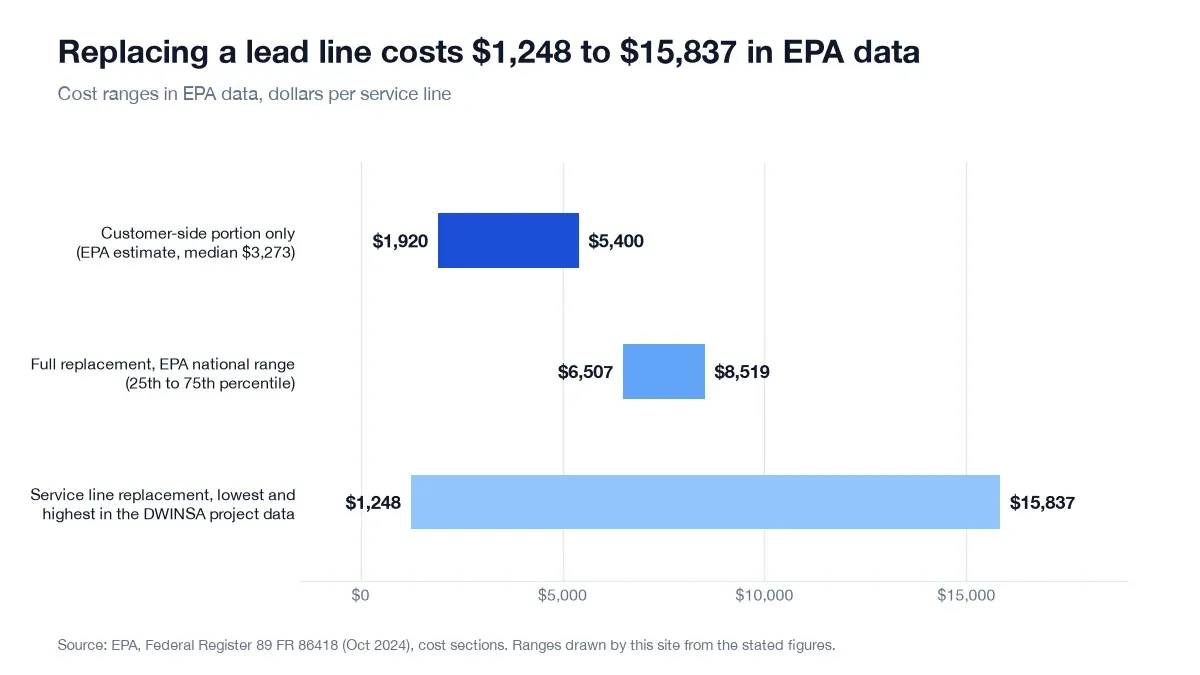 Figure 12: EPA’s cost data for service line replacement span more than $14,000 from lowest to highest project. Source: EPA, Federal Register LCRI final rule, Oct 2024. Ranges drawn by this site from the stated figures, captured 21 Oct 2026.
What does a lead line replacement cost?
- EPA’s project data show service line replacement unit costs from $1,248 to $15,837 (EPA, Federal Register LCRI final rule, Oct 2024).
- EPA uses $6,507 to $8,519 as the 25th to 75th percentile range for a full replacement (EPA, Federal Register LCRI final rule, Oct 2024).
- EPA estimates the customer-owned portion of a line costs $1,920 to $5,400 to remove, with a median of $3,273 (EPA, Federal Register LCRI final rule, Oct 2024).
How much work is coming?
- EPA estimates the yearly replacement work would involve about 3.6 percent of the pipe worker labor force and 3.5 percent of the excavator workforce (EPA, Federal Register LCRI final rule, Oct 2024).
- About 2 million lead connectors must be replaced when a water system encounters them (EPA, Federal Register LCRI final rule, Oct 2024).
Where does plumbing inside the property matter?
- Among biofilm-related outbreaks, reports cited the premise or point-of-use location most often as the contributing factor, 287 times or 63% (CDC, MMWR Surveillance Summaries, Mar 2024).
- EPA says that in homes without lead service lines, the most common problem is brass or chrome-plated brass faucets and plumbing with lead solder (EPA, Basic Information about Lead in Drinking Water, Jun 2026).
- CDC says individual lead exposure risk rises while service line replacement work is ongoing and for up to six months after it is completed (CDC, Lead in Drinking Water, Aug 2025).
Glossary
- ASCE: American Society of Civil Engineers.
- ATSDR: Agency for Toxic Substances and Disease Registry, part of CDC.
- CCR: Consumer Confidence Report, the yearly water quality report a community water system sends to customers.
- CWS: Community water system, a public water system that serves the same residents year-round.
- DWINSA: EPA’s Drinking Water Infrastructure Needs Survey and Assessment.
- GRR: Galvanized requiring replacement, a galvanized service line that EPA treats like a lead line.
- LCRI: Lead and Copper Rule Improvements, the EPA rule finalized in October 2024.
- LSL: Lead service line, the pipe that connects a water main to a building.
- MCL: Maximum contaminant level, the highest level of a contaminant that EPA allows in drinking water.
- NHANES: National Health and Nutrition Examination Survey, run by CDC.
- PFAS: Per- and polyfluoroalkyl substances, man-made chemicals often called forever chemicals.
- ppt: Parts per trillion, the same as nanograms per liter.
- SDWIS: EPA’s Safe Drinking Water Information System.
- UCMR: Unregulated Contaminant Monitoring Rule, EPA monitoring for contaminants that have no federal limit yet.
Methodology and Sources
Every number on this page comes from the agency, journal or dataset that produced it, never from a roundup. The EPA violation and system counts were computed from the quarterly SDWA download that EPA publishes through ECHO (file dated October 14, 2026), and the figures built from it were drawn by this site. Cited dates are the source’s own publication or last-updated month. A few foundational studies are older, such as the 2018 GAO school survey and the 2019 USGS well study, because they are the latest national figures we could verify. Where EPA estimates changed between editions, as with lead service lines, the page shows both and says which is newer. The page is reviewed monthly and refreshed when a source updates.
Sources
- ASCE, 2025 Report Card for Drinking Water, Nov 2025
- ATSDR, PFAS in the US Population, Nov 2024
- BLS, Occupational Outlook Handbook, Aug 2026
- CDC, About Childhood Lead Poisoning, Aug 2025
- CDC, Emerging Infectious Diseases, Jan 2021
- CDC, Lead in Drinking Water, Aug 2025
- CDC, Lead Risk Factors, Aug 2026
- CDC, MMWR Surveillance Summaries, Mar 2024
- CDC, National Blood Lead Surveillance, Sep 2025
- CDC, Testing for Lead, Mar 2026
- CDC, Water Fluoridation Statistics 2022, Jun 2024
- Census Bureau, Economic Census, Dec 2024
- Egan et al., Environmental Health Perspectives, Mar 2021
- EPA, 2025 Update to the 7th DWINSA, Nov 2025
- EPA, 2025 Updated Service Line Projections, Sep 2025
- EPA, 7th DWINSA Report to Congress, Sep 2023
- EPA, Basic Information about Lead in Drinking Water, Jun 2026
- EPA, Federal Register draft CCL 6, Apr 2026
- EPA, Federal Register LCRI final rule, Oct 2024
- EPA, Federal Register perchlorate proposal, Jan 2026
- EPA, Federal Register PFAS rescission proposal, May 2026
- EPA, Federal Register PFOA and PFOS deadline proposal, May 2026
- EPA, Federal Register UCMR 6 proposal, Jul 2026
- EPA, Information about Public Water Systems, Mar 2026
- EPA, LCRI Fact Sheet, Oct 2024
- EPA, Lead and Copper Rule, Jan 2026
- EPA, Overview of the Safe Drinking Water Act, Dec 2025
- EPA, PFAS National Primary Drinking Water Regulation, May 2026
- EPA, PFAS Rule Fact Sheet, Apr 2024
- EPA, Private Drinking Water Wells, Aug 2026
- EPA, SDWA data download (ECHO), Oct 2026
- EPA, UCMR 5 Data Summary, Jul 2026
- FDA, 21 CFR 165.110 (eCFR), Oct 2026
- GAO, K-12 Education: Lead Testing of School Drinking Water, Jul 2018
- Hanna-Attisha et al., American Journal of Public Health, Feb 2016
- Hu et al., Environmental Science & Technology Letters, Oct 2016
- Lanphear et al., The Lancet Public Health, Apr 2018
- McFarland et al., PNAS, Mar 2022
- Rosinger et al., Public Health Nutrition, Feb 2022
- Science Advances, Flint water crisis and schooling, Mar 2024
- Smalling et al., Environment International, Aug 2023
- U.S. Code, 42 U.S.C. 300f, Dec 2016
- U.S. Code, 42 U.S.C. 300g-6, Jun 1986
- U.S. Congress, Public Law 111-380, Jan 2011
- U.S. Congress, Public Law 117-58, Nov 2021
- US Water Alliance and DigDeep, Closing the Water Access Gap, Nov 2019
- USGS, Domestic (Private Supply) Wells, Mar 2019
- USGS, PFAS in tap water news release, Jul 2023
- Vieux et al., Nutrition Journal, Jan 2020
- WHO, Drinking-water fact sheet, Sep 2023
- WHO/UNICEF JMP, Progress on household drinking water 2000-2024, Aug 2025