Water leak statistics show a problem that is huge in total and small in each home. Most houses never have a leak that matters, and a few have one that runs for weeks. That split is why the numbers below look so different from source to source.
This page collects primary data on household leaks in the United States: how much water they waste, which fixtures fail, what they add to the water bill, and what leak alerts and smart detectors have been shown to do. Every figure is traced to the agency, utility or research group that produced it. Where two sources disagree, both are shown.
Updated October 2026. We refresh the page every month.
Key Takeaways
- Household leaks can waste nearly 1 trillion gallons of water a year across the United States (EPA WaterSense, Mar 2026).
- The average household leaks more than 9,300 gallons of water a year (EPA WaterSense, Mar 2026).
- A stuck toilet fill valve can waste 4,300 gallons a day and up to $1,400 a month (EPA WaterSense, Feb 2026).
- A constant toilet leak of about 22 gallons a day adds up to roughly 8,000 gallons a year (USGS, Jun 2019).
- In a field check of 892 California toilets, fewer than 6 percent leaked through the flush valve seal (California Water Efficiency Partnership, Dec 2004).
- Large apartment buildings often have 25 percent of their toilets leaking (Portland Water Bureau, Mar 2021).
- After sensors were installed on 1,198 toilets, 51 percent of the water those toilets used was still lost to leaks (Pacific Institute, Apr 2024).
- 28.4 percent of 3,416 audited Florida irrigation systems had leaks or broken parts (University of Florida IFAS, Aug 2024).
- Leak alerts cut average leak volume per meter by 29 to 50 percent in three of four single-family programs (Alliance for Water Efficiency, Mar 2023).
- New York City sent 47,787 leak alerts in 2025, which the city says avoided 1.7 billion gallons of waste (NYC Department of Environmental Protection, Mar 2026).
- The average household spent $826 on water and other public services in 2024 (U.S. Bureau of Labor Statistics, Dec 2025).
- 26 percent of US internet households have had water leak damage, and only 5 percent of single-family owners have a smart leak detector (Parks Associates, Mar 2026).
- 81 percent of homeowners say they would use water, plumbing or fire-hazard sensors if their insurer provided them free (Nationwide, Oct 2026).
How Much Water Do Household Leaks Waste Each Year?
The national total is large, but it is spread across every house in the country. EPA’s own pages give two different national totals, so treat the number as an estimate.
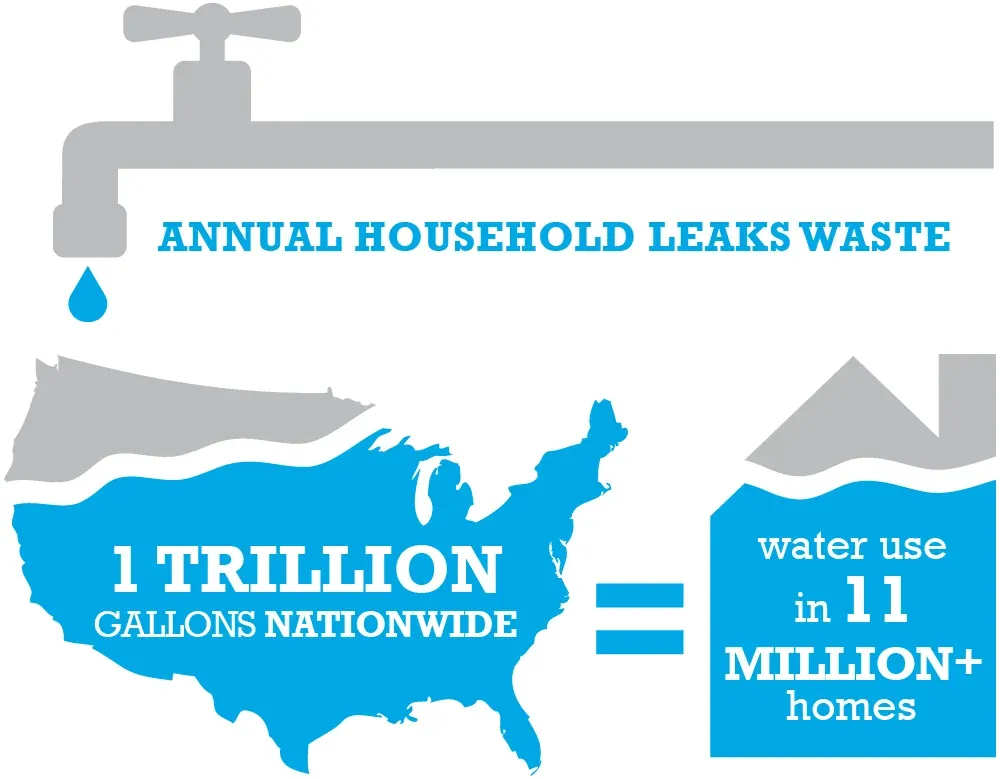 Figure 1: EPA’s national estimate of what household leaks waste each year, shown as the water use of millions of homes. Treat it as an estimate, since EPA’s own pages round it differently. Source: EPA WaterSense, Fix a Leak Week, Mar 2026. Graphic published by the source, captured 21 Oct 2026.
What is the national total?
- EPA’s statistics page puts household leaks at nearly 900 billion gallons a year, equal to the annual water use of nearly 11 million homes (EPA WaterSense, Mar 2026).
How much does one household lose?
- EPA says the average family can waste 180 gallons a week, or 9,400 gallons a year, from leaks (EPA WaterSense, Mar 2026).
- EPA’s leak-hunting checklist puts the average at nearly 10,000 gallons a year (EPA WaterSense, Mar 2019).
- Nine percent of homes have leaks that waste 50 gallons or more per day (EPA WaterSense, Mar 2026).
- San Francisco’s utility says a home with plumbing leaks can lose over 70,000 gallons a year (San Francisco Public Utilities Commission, Mar 2025).
Is leakage getting better or worse?
- Average daily leakage per person fell 17 percent, from 9.5 gallons in 1999 to 7.9 gallons in the 2016 study (Water Research Foundation, Apr 2016).
- The newest study, released in June 2026, drew on high-resolution data from more than 69,000 single-family homes, but its public release does not report a leak share (Water Research Foundation, Jun 2026).
How Much of a Home’s Indoor Water Goes to Leaks?
Across all homes, leaks are a mid-sized slice of indoor use. Inside the homes that have one, leaks can be the biggest use in the house.
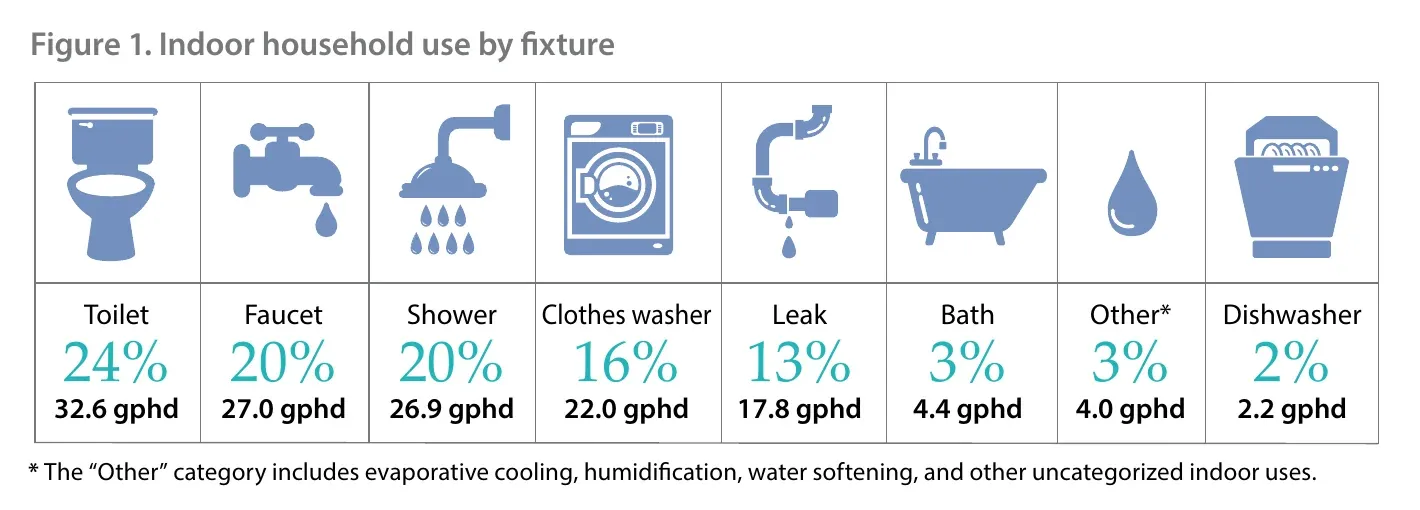 Figure 2: Leaks ranked fifth among indoor uses, ahead of baths and dishwashers, in the Water Research Foundation’s 2016 measurement of single-family homes. Source: Water Research Foundation, Residential End Uses of Water, Version 2: Executive Report, Figure 1, Apr 2016. Chart published by the source, cropped from the report, captured 21 Oct 2026.
What share of household water is lost to leaks?
- Leaks made up 13 percent of indoor use in single-family homes, or 17.8 gallons per household per day (Water Research Foundation, Apr 2016).
- Of the hot water a home uses, 4.6 percent, or 2.1 gallons per day, leaked away in a 94-home sample (Water Research Foundation, Apr 2016).
- Across four utilities, leaks were 1.0 to 2.9 percent of average single-family water use before leak alerts began (Alliance for Water Efficiency, Mar 2023).
How uneven is leakage between homes?
- In the 2016 study, 32 percent of homes had higher leakage rates, and the worst reached 600 gallons per household per day (Water Research Foundation, Apr 2016).
- At meters that had a leak event, leakage was 21.4 to 48.7 percent of all the water those meters used during the event (Alliance for Water Efficiency, Mar 2023).
- In Fort Worth, the 2.9 percent of meters with 10 or more leaks produced 63.8 percent of all leak volume (Alliance for Water Efficiency, Mar 2023).
How big is a typical leak?
- The average leak lasted 5.1 to 27.8 days, depending on the utility (Alliance for Water Efficiency, Mar 2023).
- The average leak wasted 1,255 to 5,920 gallons before it stopped (Alliance for Water Efficiency, Mar 2023).
- A San Francisco leak of 10 gallons an hour scales to 240 gallons a day, nearly double a typical home’s daily use (Alliance for Water Efficiency, Mar 2023).
How Many Homes Have Leaks or Water Damage?
Leaks are common, most are small, and many are outside the house. The Census Bureau’s survey counts households, not gallons.
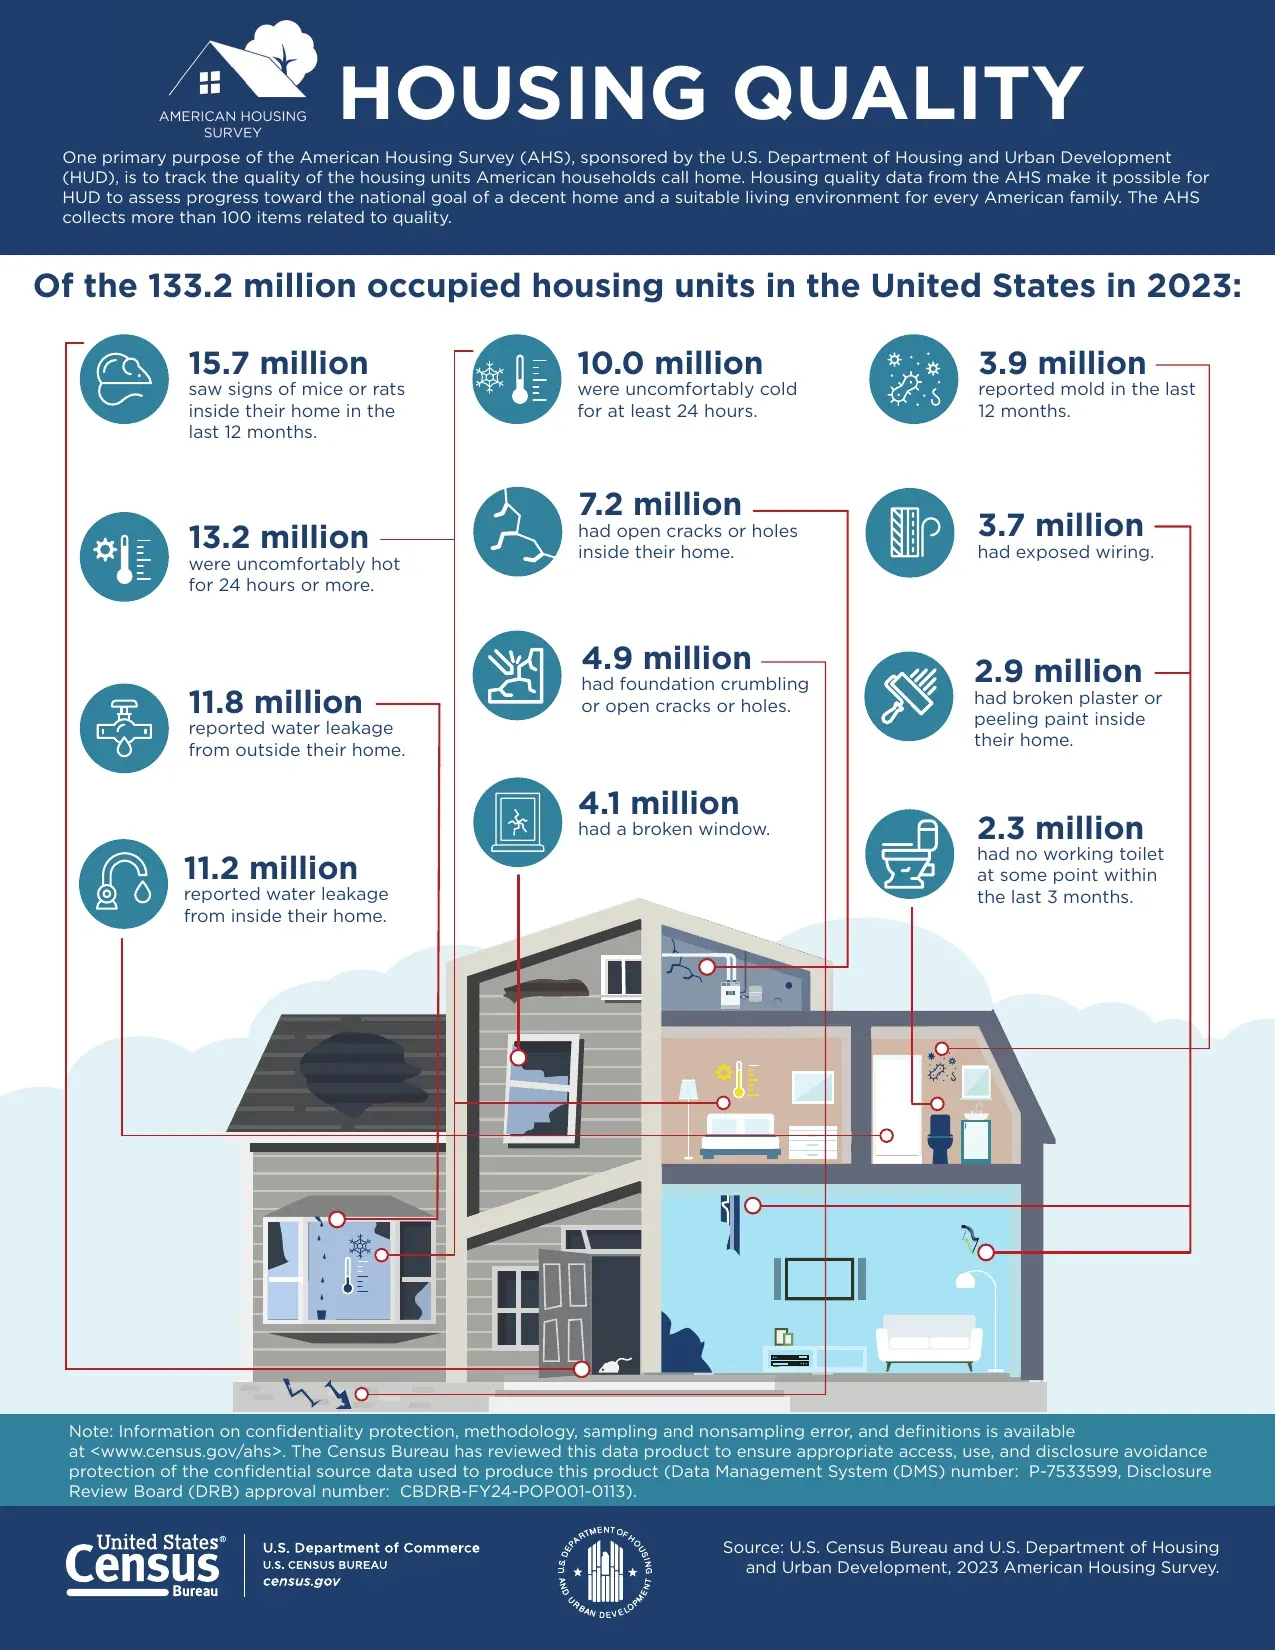 Figure 3: Leaks sit beside mice, mold and broken windows as one of the most common housing defects households report. Source: U.S. Census Bureau and HUD, 2023 American Housing Survey, Housing Quality infographic, Sep 2024. Infographic published by the source, captured 21 Oct 2026.
How many households report leakage?
- 11.2 million of the 133.2 million occupied US homes reported water leakage from inside the home (U.S. Census Bureau and HUD, Sep 2024).
- 11.8 million homes reported water leakage from outside the home (U.S. Census Bureau and HUD, Sep 2024).
- 3.9 million homes reported mold in the last 12 months (U.S. Census Bureau and HUD, Sep 2024).
- 2.3 million homes had no working toilet at some point in the last 3 months (U.S. Census Bureau and HUD, Sep 2024).
What share of homes has a metered leak in a year?
- About 12.5 percent of Fort Worth single-family homes had at least one leak in nine months, which scales to 16.7 percent over a year (Alliance for Water Efficiency, Mar 2023).
- The share with a flagged leak ranged from 4.2 percent in San Francisco to 34.6 percent in Sacramento Suburban, because each utility defines a leak differently (Alliance for Water Efficiency, Mar 2023).
- Roughly 85 percent of single-family meters in the four utility panels registered no leak event in nine months to a year (Alliance for Water Efficiency, Mar 2023).
How fast does a leak turn into mold?
- Water-damaged areas and items should be dried within 24 to 48 hours to prevent mold growth (EPA, Feb 2026).
- EPA says a moldy area under about 10 square feet can in most cases be cleaned by the homeowner (EPA, Feb 2026).
Leaks that are not fixed in time become restoration jobs. For the size of that industry, see water damage restoration industry statistics.
Which Fixtures and Pipes Leak the Most?
Toilets get the blame, and the data supports it for waste per event. How often they leak is less settled, and the numbers differ by about three times depending on who looked.
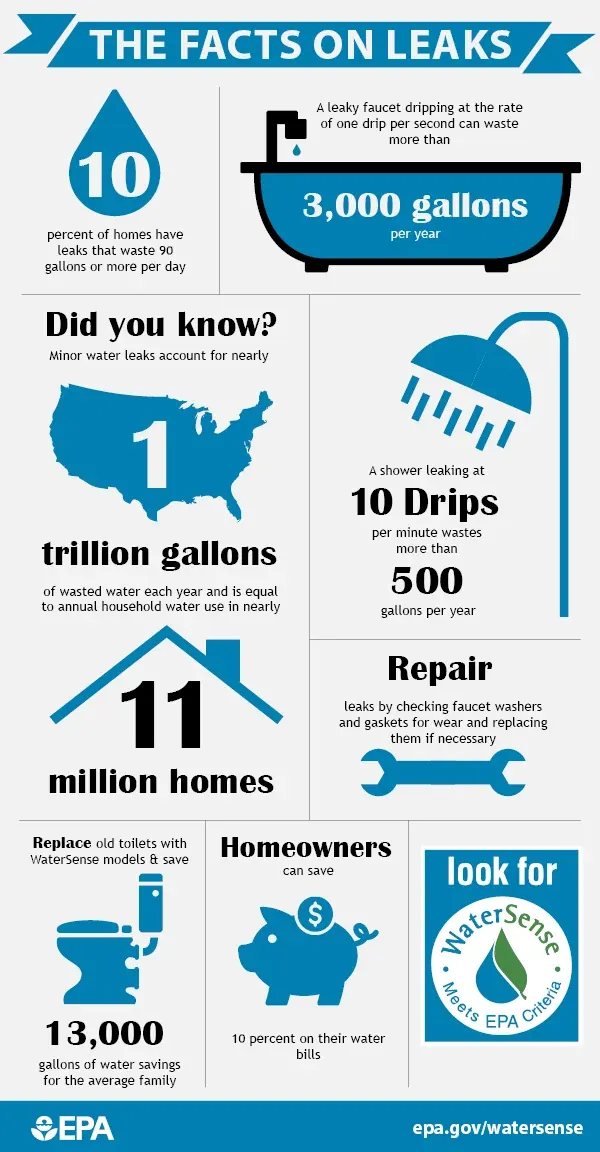 Figure 4: EPA’s fixture-by-fixture leak facts. This older graphic lists 10 percent of homes and 90 gallons per day, while EPA’s current page says 9 percent and 50 gallons, so this article uses the page text. Source: EPA WaterSense, Fix a Leak Week, Mar 2026 (graphic file dated Feb 2017). Graphic published by the source, captured 21 Oct 2026.
How common are toilet leaks?
- EPA’s guide says about 20 percent of toilets leak (EPA WaterSense, Feb 2026).
- Nearly 90 percent of the California toilets inspected still had their original flapper (California Water Efficiency Partnership, Dec 2004).
- Among the oldest fixtures, 9 to 12 years old, fewer than 20 percent of customers had replaced the original flapper (California Water Efficiency Partnership, Dec 2004).
- EPA says to replace a toilet flapper at least every five years (EPA WaterSense, Mar 2026).
- Of 205 California customers who had used in-tank bowl cleaners, only 17 had leaking toilets, so cleaner tablets were not the main cause (California Water Efficiency Partnership, Dec 2004).
- Portland advises checking toilets for leaks every 6 to 12 months (Portland Water Bureau, Mar 2021).
- Toilet leaks are the most common household leaks, according to San Francisco’s utility (San Francisco Public Utilities Commission, Mar 2025).
How much does a leaking toilet waste?
- A leaking toilet can waste up to 3,000 gallons in just a few days (San Francisco Public Utilities Commission, Oct 2026).
- A toilet leak in a large apartment building can use as much as 5,000 gallons a day (Portland Water Bureau, Mar 2021).
- In a Los Angeles pilot, each toilet leak wasted an average of 8,284 gallons before it was stopped (Pacific Institute, Apr 2024).
- The 1,198 sensors flagged 483 toilet leaks in seven months, and 4.8 million of the 9.5 million gallons those toilets used went to leaks (Pacific Institute, Apr 2024).
What do faucet and shower leaks add up to?
- A faucet that drips once per second wastes more than 3,000 gallons a year (EPA WaterSense, Mar 2026).
- A showerhead leaking 10 drips a minute wastes more than 500 gallons a year (EPA WaterSense, Mar 2026).
- One gallon equals about 15,140 faucet drips, which is why slow drips add up (USGS, Jun 2019).
How much do outdoor and underground leaks waste?
- An irrigation leak 1/32 of an inch wide, about the thickness of a dime, wastes about 6,300 gallons a month (EPA WaterSense, Mar 2026).
- A poorly kept automatic irrigation system can waste up to 25,000 gallons a year (EPA WaterSense, Mar 2026).
- Every one of the 3,416 Florida irrigation systems audited had at least one maintenance problem (University of Florida IFAS, Aug 2024).
- A service line leaking one gallon every 10 minutes loses 144 gallons a day, or 52,560 gallons a year (USGS, Jun 2019).
For a plumbing shop, the pattern is useful. Flappers, fill valves and washers are cheap parts and short visits. A saved price for each small repair keeps those jobs quick to quote and easy to invoice.
What Do Leaks Cost on the Water Bill?
A leak is a bill you pay for water you never used, and the rate you pay keeps rising. A small leak costs little in a cheap-water city and a lot where tiers and sewer charges stack up.
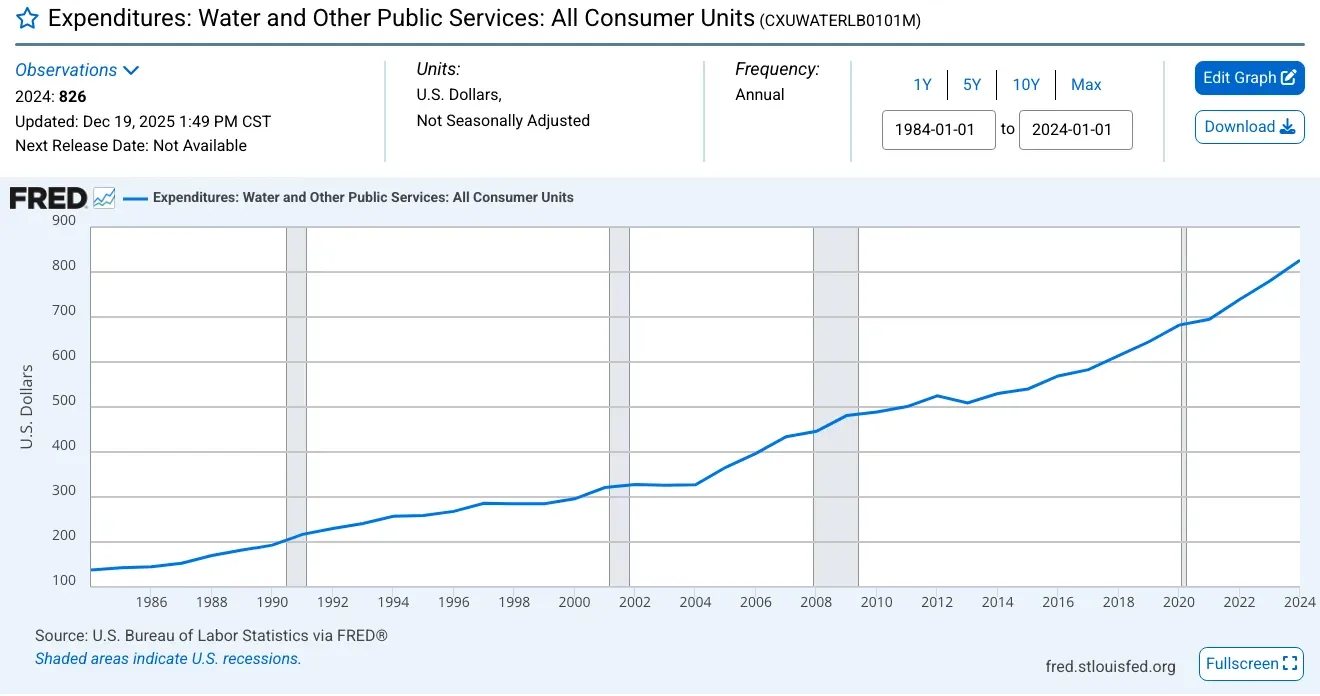 Figure 5: Household spending on water and other public services has climbed almost every year since the 1980s, so each wasted gallon costs more than it used to. Source: U.S. Bureau of Labor Statistics, Consumer Expenditure Survey, retrieved from FRED, Dec 2025. Screenshot of the source page, captured 21 Oct 2026.
How much of the bill is wasted water?
- Fixing easily corrected leaks can save about 10 percent on a water bill (EPA WaterSense, Mar 2026).
- The average family spends more than $1,000 a year on water (EPA WaterSense, Mar 2026).
- A drip irrigation malfunction leaking 1 gallon a minute can waste $5,700 a year (EPA WaterSense, Feb 2026).
- A 200-gallon-a-day leak can add $270 to $470 a year to a Denver Water bill (Denver Water, Mar 2023).
- A running toilet can waste up to 6,000 gallons a day and cost upwards of $100 a day in New York City (NYC Department of Environmental Protection, Mar 2026).
- One Portland apartment property cut water use by 12,500 gallons a day by repairing toilets, saving about $9,000 a month (Portland Water Bureau, Mar 2021).
- In San Francisco, a 10-gallon-an-hour leak that lasts 11.6 days makes the monthly bill 61 percent higher (Alliance for Water Efficiency, Mar 2023).
How fast are water rates rising?
- Combined US water and sewer bills rose 5.1 percent in 2025, a five-year high (Bluefield Research, Mar 2026).
- Water rates rose 6.0 percent in 2025, against 4.8 percent for wastewater rates (Bluefield Research, Mar 2026).
- Sewer charges have run $19.23 a month above water charges on average over five years (Bluefield Research, Mar 2026).
- Bills in 50 large cities are up 24.2 percent over five years (Bluefield Research, Mar 2026).
- Households in the Northeast pay $147 a month for water and sewer, and in the West $143 (Bluefield Research, Mar 2026).
- Water, sewer and trash prices rose 207 percent from January 2000 to December 2025, against 93 percent for all prices (Bluefield Research, Mar 2026).
- A monthly water and sewer bill takes about 11.5 hours of minimum-wage work to cover (Bluefield Research, Mar 2026).
- The consumer price index for water, sewer and trash collection services was up 4.8 percent over the 12 months to September 2026 (U.S. Bureau of Labor Statistics, Sep 2026).
Do utilities forgive the cost of a leak?
- 64 surveyed utilities had a courtesy bill adjustment policy for customers with a leak, and another 17 had one for certain cases (Alliance for Water Efficiency, Mar 2023).
- San Francisco credits 50 percent of the excess use for a visible leak and 100 percent for a concealed one, for no more than two billing periods (San Francisco Public Utilities Commission, Oct 2026).
- Customers there must apply within 15 days of the first high-bill notice, and a review can take up to 4 months (San Francisco Public Utilities Commission, Oct 2026).
How Do Homeowners Find Leaks, and How Well Do Utility Alerts Work?
The cheapest detector is the water meter, and the next cheapest is a utility that watches it for you. The best evidence on alerts comes from the Alliance for Water Efficiency’s study of four utilities.
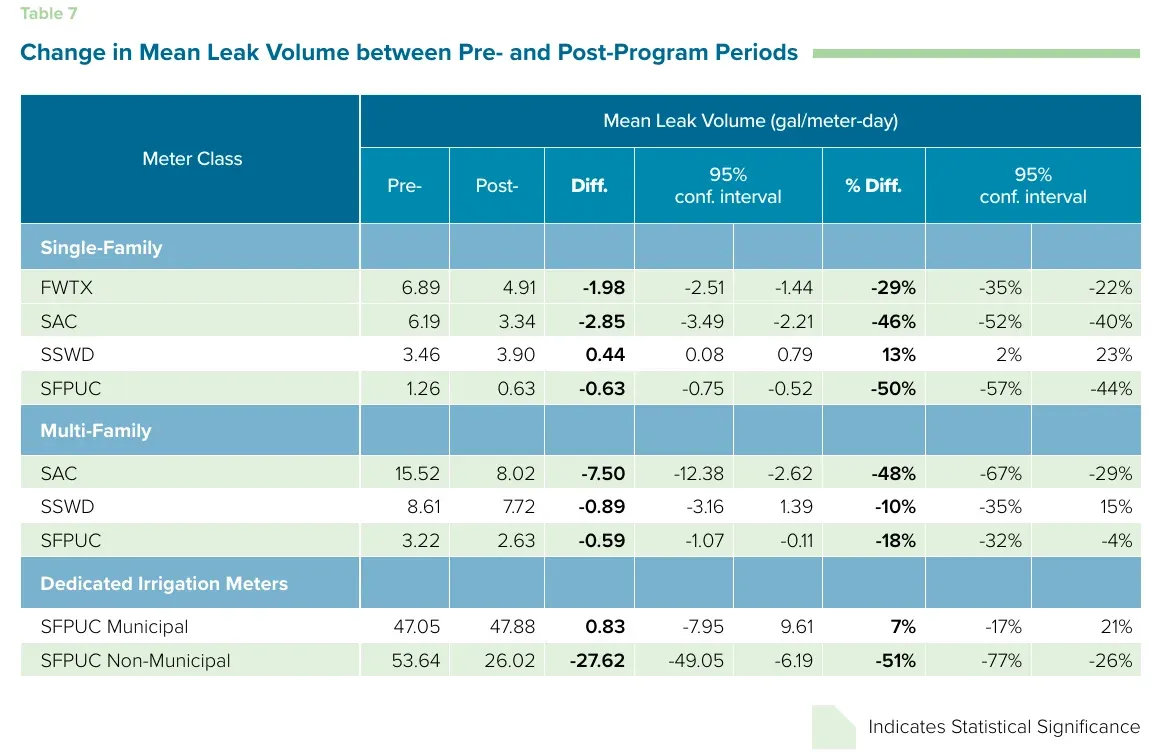 Figure 6: Three of four single-family alert programs cut leak volume by double digits, and the fourth, which sent notices only twice a month, did not. Source: Alliance for Water Efficiency, An Evaluation of AMI-enabled Proactive Leak Notification Programs, Table 7, Mar 2023. Screenshot of the source table, captured 21 Oct 2026.
What do alerts save?
- Single-family alerts saved 0.6 to nearly 3 gallons per meter per day (Alliance for Water Efficiency, Mar 2023).
- Annual savings from single-family alerts were 165.2 million gallons in Fort Worth, 127.1 million in Sacramento and 25.1 million in San Francisco (Alliance for Water Efficiency, Mar 2023).
- Those savings were 0.5 to 0.9 percent of mean daily use, because most homes never have a leak (Alliance for Water Efficiency, Mar 2023).
- Fort Worth’s alerts were linked to about 140,189 fewer leaks a year (Alliance for Water Efficiency, Mar 2023).
- San Francisco’s single-family leak formation rate fell 41 percent (Alliance for Water Efficiency, Mar 2023).
- Multifamily alert programs cut leak volume 48 percent in Sacramento and 18 percent in San Francisco (Alliance for Water Efficiency, Mar 2023).
- San Francisco’s multifamily alerts also cut the rate of new leaks by 24 percent (Alliance for Water Efficiency, Mar 2023).
- Automated daily alerts to non-municipal irrigation meters in San Francisco cut leak volume 51 percent (Alliance for Water Efficiency, Mar 2023).
What makes alerts fail?
- The program that sent notices only twice a month did not reduce leak volume (Alliance for Water Efficiency, Mar 2023).
- Leak duration dropped in five of the six programs that showed statistically significant savings (Alliance for Water Efficiency, Mar 2023).
- A Los Angeles toilet-sensor pilot took an average of 10 days to close each leak alert (Pacific Institute, Apr 2024).
- EPA warns that utility meter alerts can lag for days, so more water is wasted than with an in-home device (EPA WaterSense, Feb 2026).
How many utilities send alerts?
- 66 of 102 surveyed utilities had advanced metering for all or part of their accounts (Alliance for Water Efficiency, Mar 2023).
- 56 of those 66 contacted customers about possible leaks before the bill arrived (Alliance for Water Efficiency, Mar 2023).
- 41 of 55 utilities with advanced metering also sent high-flow notices (Alliance for Water Efficiency, Mar 2023).
- 70 percent of utilities that send text alerts require customers to opt in first (Alliance for Water Efficiency, Mar 2023).
- San Francisco sends up to three rounds of alerts over 10 weeks while the leak continues (San Francisco Public Utilities Commission, Oct 2026).
- About 76 percent of utilities said alerts reduced high-bill queries or complaints (Alliance for Water Efficiency, Mar 2023).
- Utilities that estimated savings reported an average of 7,600 gallons per account on the metering system (Alliance for Water Efficiency, Mar 2023).
- New York City is replacing over 600,000 meter-reading devices over three years, and 230,000 are done (NYC Department of Environmental Protection, Mar 2026).
- San Francisco alerts more than 170,000 meters, and sends one after 48 hours of nonstop use of 7.5 gallons an hour or more (San Francisco Public Utilities Commission, Oct 2026).
What can a homeowner check without any device?
- A family of four using more than 12,000 gallons a month in a cold month such as January could have a serious leak (EPA WaterSense, Mar 2026).
- If the meter moves during two hours with no water in use, there is probably a leak (EPA WaterSense, Mar 2026).
- Denver Water suggests a target of about 40 gallons per person per day, or 4,800 gallons a month for a family of four (Denver Water, Mar 2023).
Do Smart Leak Detectors Work, and Who Has One?
Detectors work where they are installed and watched. Most homes still have none, which is a plain opening for a plumber who can install one.
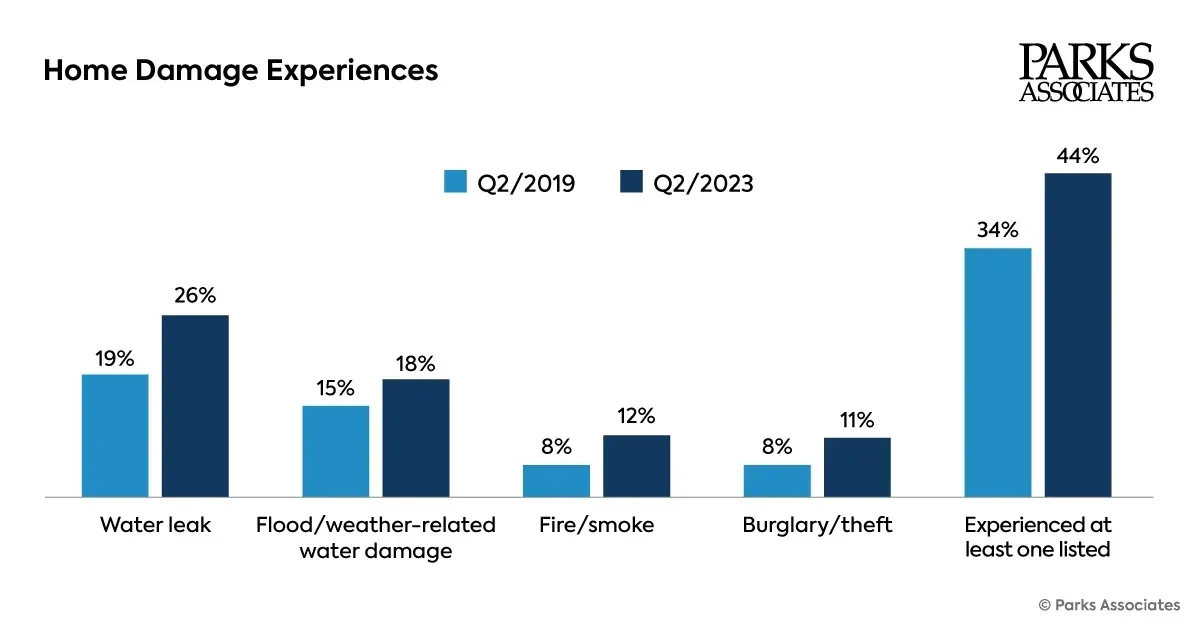 Figure 7: Reported water leak damage rose between 2019 and 2023 and is now more common than fire or burglary damage among US internet households. Source: Parks Associates and Johnson Controls, Home Damage Experiences, Mar 2026. Chart published by the source, captured 21 Oct 2026.
How many homes have a detector?
- 57 percent of multifamily owners and operators have smart leak detection in part of their portfolio (Parks Associates, Mar 2026).
- 29 percent of multifamily operators use it at their largest property (Parks Associates, Mar 2026).
- 44 percent of US internet households reported at least one type of home damage in Q2 2023, up from 34 percent in Q2 2019 (Parks Associates, Mar 2026).
- Independent agents ranked leak detectors first among tools that could cut home claims, at 39 percent, and automatic shut-off systems second, at 30 percent (Nationwide, Oct 2026).
- Only 43 percent of homeowners follow a preventive maintenance schedule, and 19 percent wait until something breaks (Nationwide, Oct 2026).
How much do detectors save?
- In one company’s data, 60 percent of homeowners who installed an in-line flow monitor with shut-off found leaks they did not know about (EPA WaterSense, Feb 2026).
- Homes with external flow monitors cut indoor water use 15 percent compared with average use (EPA WaterSense, Feb 2026).
- In Goodyear, Arizona, homes with flow monitors saved an average of 38 gallons per household per day (EPA WaterSense, Feb 2026).
- In four Los Angeles apartment properties with usable bill data, toilet sensors cut water use 11 percent (Pacific Institute, Apr 2024).
- The same pilot cut water and sewer costs 12 percent, or about $81 per sensor a year, and saved 3,469 gallons per sensor a year (Pacific Institute, Apr 2024).
- Each sensor cost $292, and the payback period was 3 years and 8 months (Pacific Institute, Apr 2024).
- A Pacific Institute project that installed 1,200 toilet sensors reported that one 183-unit senior housing community cut water use by more than 25 percent and saved more than 1 million gallons (Pacific Institute, Jun 2022).
What should a buyer know before installing one?
- In-line point-of-entry devices that watch the main line usually need a plumber to install (EPA WaterSense, Feb 2026).
- Leak detection devices cannot earn the WaterSense label, so EPA points buyers to the ANSI/CAN/IAPMO Z1349 standard (EPA WaterSense, Feb 2026).
Methodology and Sources
We include a figure only if it is published by the agency, utility, regulator or research group that produced it, and we open every link and read the number on the page or in the report. Where an official source gives two values for the same thing, we show both and say which we use. Some pages carry no date, such as San Francisco’s program pages, and we date those to the month we read them. Some of the oldest figures, such as the 2004 flapper study and the 2016 end-use study, are the latest field measurements of their kind. The page is reviewed every month.
Glossary
- AMI: advanced metering infrastructure, meters that send water use data to the utility several times a day.
- Flapper: the rubber seal at the bottom of a toilet tank that holds water in until the toilet is flushed.
- Fill valve: the valve that refills a toilet tank after a flush.
- gphd, gpcd: gallons per household per day, gallons per capita (person) per day.
- Point-of-entry device: a leak monitor installed on the main water line, where water enters the building.
- WaterSense: the EPA program that labels water-efficient products and runs Fix a Leak Week each March.
Sources
- EPA WaterSense, Fix a Leak Week
- EPA WaterSense, Statistics and Facts
- EPA WaterSense, Know Your Flow and Curb Water Waste guide
- EPA WaterSense, Detect and Chase Down Leaks checklist
- EPA, A Brief Guide to Mold, Moisture and Your Home
- Water Research Foundation, Residential End Uses of Water, Version 2
- Water Research Foundation, 2026 Residential End Uses of Water release
- Alliance for Water Efficiency, AMI-enabled Proactive Leak Notification Programs
- USGS, Does a little leak in my house really waste water?
- U.S. Census Bureau and HUD, 2023 American Housing Survey Housing Quality
- U.S. Bureau of Labor Statistics via FRED, Water and Other Public Services expenditures
- U.S. Bureau of Labor Statistics, CPI Table 2
- Bluefield Research, National Water and Sewer Bills Rise 5.1%
- Parks Associates and Johnson Controls, water leak damage research
- Nationwide, 2026 Homeowners survey
- Pacific Institute, Saving Water and Money Through Toilet Leak Detection
- Pacific Institute, Los Angeles Better Buildings Challenge award
- NYC Department of Environmental Protection, Fix a Leak Week 2026
- San Francisco Public Utilities Commission, Leaks Can Run, They Can’t Hide
- San Francisco Public Utilities Commission, Leak Alerts
- San Francisco Public Utilities Commission, Leak Allowance
- Portland Water Bureau, Fix the toilets in multifamily buildings
- Denver Water, Stop your running toilet during Fix a Leak Week
- University of Florida IFAS Extension, Frequency of Residential Irrigation Maintenance Problems
- California Water Efficiency Partnership, Toilet Flapper Study Final Report