Updated October 2026.
Plumbing industry statistics start with a counting problem. The federal government counts plumbing shops together with heating and air-conditioning shops under one code, NAICS 238220, so most figures on this page cover all three trades. Where a source splits plumbing out on its own, the text says so. For plumber pay, licensing and the shortage, see the plumbing statistics page.
Every number below comes from the agency, regulator or company that produced it, and every number has a date and a link. The sources are the Census Bureau, the Bureau of Labor Statistics, Statistics Canada, the USGS and the annual reports of public companies. The page covers sales, shops, jobs and growth first. Then it covers residential and commercial work, material costs, suppliers, demand and Canada.
The short version is simple. This is a large trade that is still adding shops and workers, and most of those shops are very small. Copper and brass prices have climbed hard, which puts pressure on any shop that reprices slowly.
Key Takeaways
- US plumbing, heating and air-conditioning contractors took in $297.6 billion in sales in 2022 (Census Bureau, 2022 Economic Census, Construction Summary, Dec 2024), up from $206.2 billion in 2017 (Census Bureau, 2017 Economic Census, Construction Summary, May 2021).
- Plumbing contractors alone reported $75.1 billion in sales in 2022 (Census Bureau, 2022 Economic Census, Kind of Business, Dec 2025).
- There were 111,207 shops with paid staff in 2023, and 64,871 of them had fewer than 5 employees (Census Bureau, County Business Patterns 2023, Jun 2025).
- Those shops employed 1,214,761 people in March 2023 (Census Bureau, County Business Patterns 2023 Employment, Jun 2025).
- Payroll jobs reached 1,338.6 thousand in August 2026 (BLS Current Employment Statistics, Plumbing, Heating and Air-Conditioning Contractors, Aug 2026).
- Another 189,085 solo operators with no employees filed as plumbing, heating and air-conditioning businesses in 2024 (Census Bureau, Nonemployer Statistics 2024, Sep 2026).
- 21,011 shops did not operate for the full year in 2022, which shows how many shops open or close in a year (Census Bureau, 2022 Economic Census, Establishments by Size, May 2025).
- Ferguson, a large North American distributor of plumbing and HVAC products, says residential and non-residential markets each make up about half of its sales (Ferguson Enterprises, Form 10-K FY2025, Sep 2025).
- Residential specialty trade employment fell to 2,340.3 thousand in September 2026, while nonresidential rose to 2,939.6 thousand (BLS Current Employment Statistics, Residential Specialty Trade Contractors, Sep 2026; BLS Current Employment Statistics, Nonresidential Specialty Trade Contractors, Sep 2026).
- The producer price index for copper and brass mill shapes reached 835.342 in September 2026, against 642.679 a year earlier (BLS Producer Price Index, Copper and Brass Mill Shapes, Sep 2026).
- Software spending by these contractors rose from $251 million in 2017 to $760 million in 2022 (Census Bureau, 2017 Economic Census, Software Expense, May 2021; Census Bureau, 2022 Economic Census, Software Expense, Dec 2024).
- Comfort Systems USA reported a backlog of $11.94 billion at the end of 2025, a 99.3% rise in one year (Comfort Systems USA, Form 10-K FY2025, Feb 2026).
- Canada had 16,754 plumbing, heating and air-conditioning businesses with employees in June 2026 (Statistics Canada, Table 33-10-1174-01, Aug 2026).
How Big Is the US Plumbing Market?
The market is big, and no single firm owns it. Federal surveys put sales near $300 billion, and plumbing contractors are one named slice of that. The rest belongs to heating, air-conditioning and mechanical work done by the same kind of shops.
 Figure 1: The Census Bureau counts 112,088 firms and 114,427 establishments in this industry code, and the table gives sales in thousands of dollars. Two groups of columns from one row of the table are joined here. Source: Census Bureau, 2022 Economic Census, Construction Summary, Dec 2024. Screenshot of the source page, captured 21 Oct 2026.
How much work do these contractors do?
- Contractors in this industry did $288.3 billion of construction work in 2022 (Census Bureau, 2022 Economic Census, Value of Construction Work, Dec 2025).
- They added $175.9 billion in value, the Census measure of what the industry adds after paying for materials and subcontract work (Census Bureau, 2022 Economic Census, Construction Summary Value Added, Dec 2024).
- A second Census count, which tracks whole companies, put receipts at $306.3 billion in 2022 (Census Bureau, Statistics of U.S. Businesses 2022, Apr 2025).
- Shops also subcontract. Work taken in from other contractors was worth $85.1 billion (Census Bureau, 2022 Economic Census, Subcontracted Work, Dec 2024).
How much of that is plumbing, and how much is heating and cooling?
- HVAC contractors reported $121.7 billion in sales within this industry code (Census Bureau, 2022 Economic Census, Kind of Business HVAC, Dec 2025).
- Mechanical contractors reported $54.4 billion (Census Bureau, 2022 Economic Census, Kind of Business Mechanical, Dec 2025).
- Building sprinkler installers reported $11.4 billion, refrigeration contractors $7.9 billion, and steam and pipe fitting contractors $4.7 billion (Census Bureau, 2022 Economic Census, Kind of Business Other Trades, Dec 2025).
How much do solo plumbers add?
- Solo operators with no paid staff took in $14.9 billion in 2024 (Census Bureau, Nonemployer Statistics 2024 Receipts, Sep 2026).
How big is the market that distributors say they serve?
- Ferguson sizes the residential and non-residential North American construction market it serves at $340 billion (Ferguson Enterprises, Form 10-K FY2025 Market Size, Sep 2025).
How Many Plumbing Shops Are There?
Most plumbing companies are small, and the count of shops keeps growing. A shop with a handful of people is the normal case, not the exception.
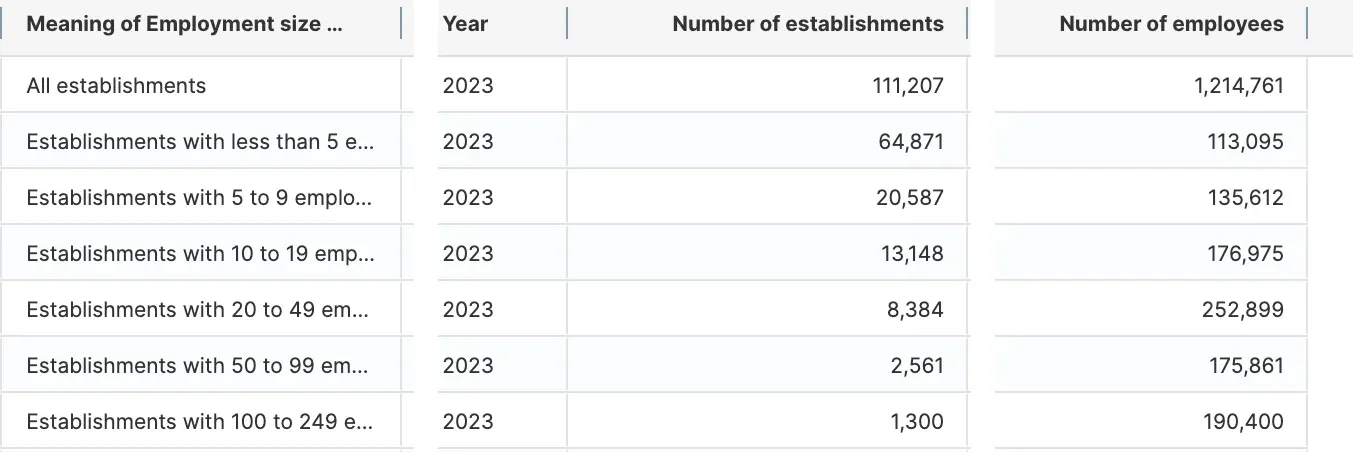 Figure 2: Shops with fewer than 5 employees make up most of the count, while shops with 20 to 49 employees hold the most jobs of any size class shown. Three columns of the table are joined here. Source: Census Bureau, County Business Patterns 2023, Jun 2025. Screenshot of the source page, captured 21 Oct 2026.
How many companies and locations does the Census count?
- The 2022 Economic Census counted 93,416 establishments that ran the whole year (Census Bureau, 2022 Economic Census, Establishments by Size Full Year, May 2025).
- The Statistics of U.S. Businesses file counted 107,004 firms in 2022 (Census Bureau, Statistics of U.S. Businesses 2022 Firms, Apr 2025).
- The Bureau of Labor Statistics counted 123,866 establishments on average in 2025, because its count covers every location in unemployment insurance records (BLS Quarterly Census of Employment and Wages 2025, Aug 2026).
How small is the typical shop?
- 20,587 shops had 5 to 9 employees, 13,148 had 10 to 19, and 8,384 had 20 to 49 (Census Bureau, County Business Patterns 2023 Mid-Size Shops, Jun 2025).
- Only 24 shops had 1,000 or more employees (Census Bureau, County Business Patterns 2023 Size Class 1,000 Plus, Jun 2025).
- Counted by company instead of by location, 63,588 firms had fewer than 5 employees, and 96,222 had fewer than 20 (Census Bureau, Statistics of U.S. Businesses 2022 Small Firms, Apr 2025).
- 106,789 firms had fewer than 500 employees, and only 39 firms had 5,000 or more (Census Bureau, Statistics of U.S. Businesses 2022 Large Firms, Apr 2025).
- 95 locations had 500 or more employees and ran all year (Census Bureau, 2022 Economic Census, Establishments by Size Large, May 2025).
How are these shops owned?
- 76,190 shops were S-corporations, and 15,841 were C-corporations (Census Bureau, County Business Patterns 2023 Corporations, Jun 2025).
- 11,821 shops were sole proprietorships, and 7,299 were partnerships (Census Bureau, County Business Patterns 2023 Proprietors and Partners, Jun 2025).
Which states have the most shops?
- California had 13,023 establishments in 2025 (BLS Quarterly Census of Employment and Wages 2025 California, Aug 2026).
- Florida had 10,921 (BLS Quarterly Census of Employment and Wages 2025 Florida, Aug 2026).
- Texas had 10,012 (BLS Quarterly Census of Employment and Wages 2025 Texas, Aug 2026).
- New York had 7,059 (BLS Quarterly Census of Employment and Wages 2025 New York, Aug 2026).
- Work done is also highest in these four states. Contractors reported $31.1 billion of work in California, $24.7 billion in Texas, $18.9 billion in Florida and $17.3 billion in New York (Census Bureau, 2022 Economic Census, Value of Construction Work by State, Dec 2025).
How Many People Work for Plumbing Shops?
More than a million people work in this trade, and not all of them are on a truck. Managers, dispatchers and office staff are a large group too.
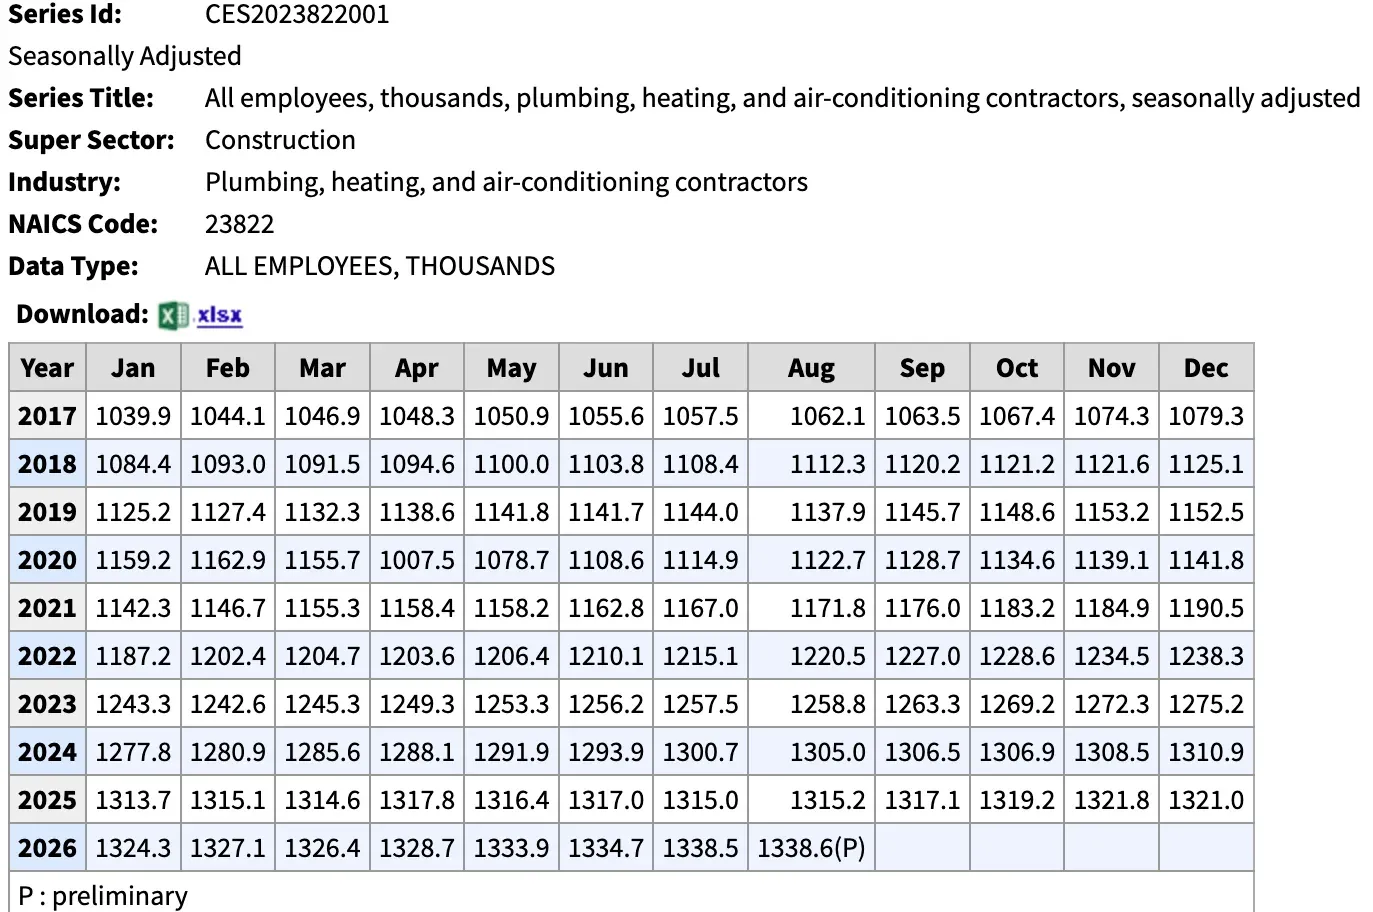 Figure 3: Payroll jobs at these contractors passed 1.3 million in 2025 and kept rising in 2026. The August 2026 figure is preliminary. Source: BLS Current Employment Statistics, Plumbing, Heating and Air-Conditioning Contractors, Aug 2026. Screenshot of the source page, captured 21 Oct 2026.
How many jobs do federal counts show?
- The Bureau of Labor Statistics counted 1,315,566 average annual jobs in 2025 (BLS Quarterly Census of Employment and Wages 2025 Jobs, Aug 2026).
- The 2022 Economic Census counted 1,169,692 employees (Census Bureau, 2022 Economic Census, Construction Summary Employees, Dec 2024).
- All specialty trade contractors, the wider group, employed 5,279.9 thousand people in September 2026 (BLS Current Employment Statistics, Specialty Trade Contractors, Sep 2026).
- California had 125,858 jobs in 2025, Texas had 121,180 and Florida had 106,398 (BLS Quarterly Census of Employment and Wages 2025 Jobs by State, Aug 2026).
- Jobs grew 3.7% in Texas and 2.5% in Florida in 2025, and fell 0.4% in California (BLS Quarterly Census of Employment and Wages 2025 State Job Growth, Aug 2026).
How many are field workers and how many are office staff?
- Construction workers numbered 932,302 in the pay period that included December 12, 2022, and other employees, such as managers, dispatchers and office staff, numbered 323,173 in the pay period that included March 12 (Census Bureau, 2022 Economic Census, Workers by Type, Dec 2024).
- Construction workers logged 1.69 billion hours in 2022 (Census Bureau, 2022 Economic Census, Hours Worked, Dec 2024).
What do these shops pay out?
- Annual payroll was $89.5 billion in 2023 (Census Bureau, County Business Patterns 2023 Payroll, Jun 2025).
- Wages in the unemployment insurance data totaled $108.1 billion in 2025 (BLS Quarterly Census of Employment and Wages 2025 Wages, Aug 2026).
- Employers paid $23.6 billion in fringe benefits in 2022 (Census Bureau, 2022 Economic Census, Benefits, Dec 2024).
Where do the jobs sit by company size?
- Firms with fewer than 20 employees held 409,383 jobs, and firms with fewer than 5 employees held 109,335 (Census Bureau, Statistics of U.S. Businesses 2022 Employment Under 20, Apr 2025).
- The 39 firms with 5,000 or more employees held 79,532 jobs (Census Bureau, Statistics of U.S. Businesses 2022 Employment 5,000 Plus, Apr 2025).
Plumbing Industry Growth Statistics
The trade has grown in almost every year since 2010. Shops, jobs, payroll and sales all rose over the period, and the one big dip, in spring 2020, was made up by mid-2021.
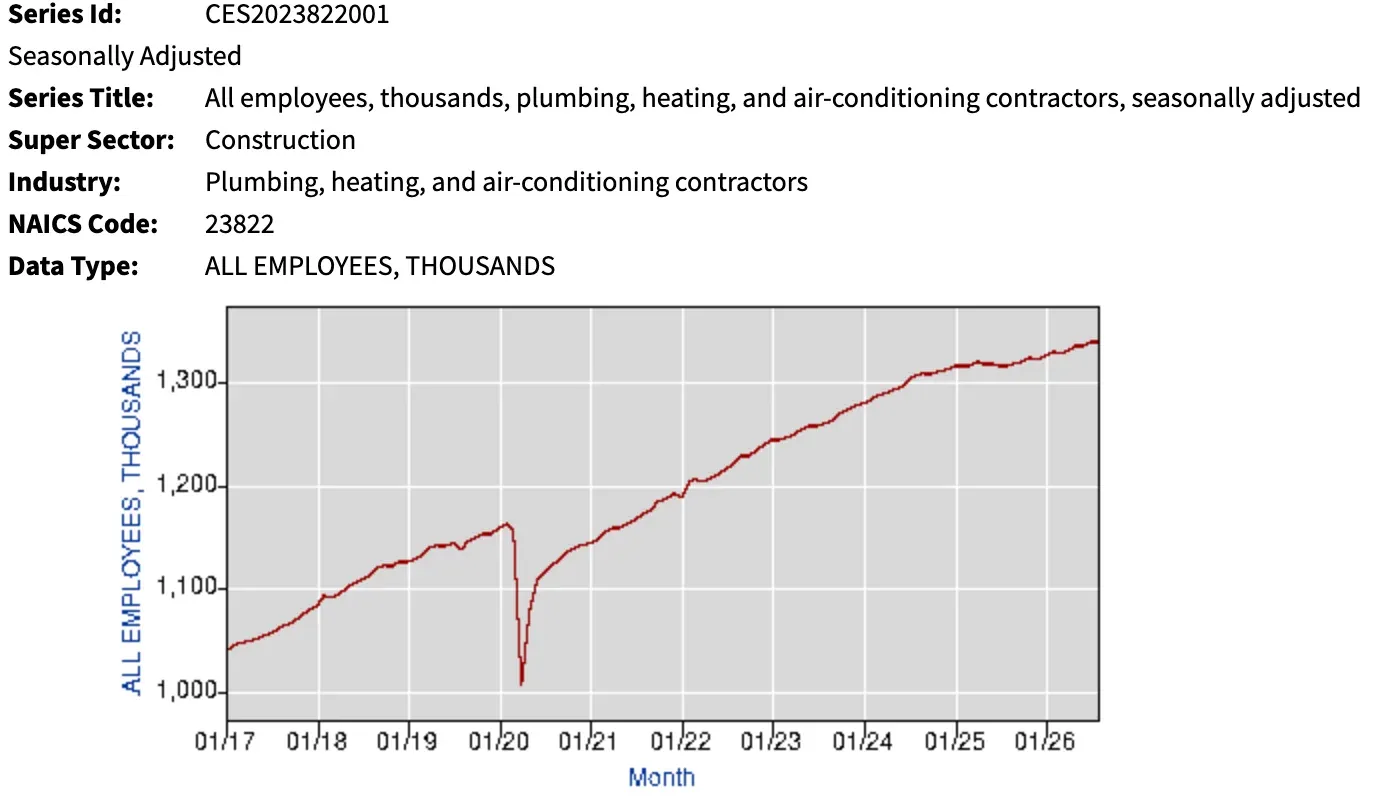 Figure 4: Jobs dropped sharply in spring 2020 and were back above their old peak by 2021, then climbed again each year since. Source: BLS Current Employment Statistics, Plumbing, Heating and Air-Conditioning Contractors, Aug 2026. Chart published by the source, captured 21 Oct 2026.
How many shops and jobs were there ten years ago?
- County Business Patterns counted 93,761 establishments in 2010 (Census Bureau, County Business Patterns 2010, Nov 2015).
- Employment was 828,137 in 2010 (Census Bureau, County Business Patterns 2010 Employment, Nov 2015).
- Payroll was $40.7 billion in 2010 (Census Bureau, County Business Patterns 2010 Payroll, Nov 2015).
- Employment reached 933,870 in 2015 (Census Bureau, County Business Patterns 2015, May 2017).
- The unemployment insurance count showed 958,143 jobs in 2015 (BLS Quarterly Census of Employment and Wages 2015, Nov 2017).
- Wages in that count were $53.5 billion in 2015 (BLS Quarterly Census of Employment and Wages 2015 Wages, Nov 2017).
How did the industry change between 2017 and 2022?
- The 2017 Economic Census counted 101,561 firms (Census Bureau, 2017 Economic Census, Construction Summary Firms, May 2021).
- It counted 1,020,861 employees (Census Bureau, 2017 Economic Census, Construction Summary Employees, May 2021).
- It counted $60.2 billion in annual payroll (Census Bureau, 2017 Economic Census, Construction Summary Payroll, May 2021).
How did the industry handle 2020?
- County Business Patterns showed 1,099,138 employees in 2019 (Census Bureau, County Business Patterns 2019, Apr 2021).
- It showed 1,116,145 in 2020 (Census Bureau, County Business Patterns 2020, Apr 2022).
- It showed 1,124,239 in 2021 (Census Bureau, County Business Patterns 2021, Apr 2023).
- Monthly payroll jobs stood at 1,155.7 thousand in March 2020 (BLS Current Employment Statistics, March 2020 Jobs, Mar 2020).
- They fell to 1,007.5 thousand in April 2020 (BLS Current Employment Statistics, April 2020 Jobs, Apr 2020).
- Jobs stood at 1,152.5 thousand in December 2019, before the drop, and were back above that level at 1,167.0 thousand by July 2021 (BLS Current Employment Statistics, December 2019 Jobs, Dec 2019).
- The unemployment insurance data showed a 1.8% drop in average jobs in 2020 (BLS Quarterly Census of Employment and Wages 2020, Aug 2021).
What is the most recent growth rate?
- Average establishments grew 1.3% in 2025 (BLS Quarterly Census of Employment and Wages 2025 Establishment Growth, Aug 2026).
- Total wages grew 7.3% in 2025 (BLS Quarterly Census of Employment and Wages 2025 Wage Growth, Aug 2026).
- Payroll jobs were 1,315.2 thousand in August 2025 (BLS Current Employment Statistics, August 2025 Jobs, Aug 2025).
- Jobs began 2017 at 1,039.9 thousand (BLS Current Employment Statistics, January 2017 Jobs, Jan 2017).
- Total US construction spending was 3.1% lower in the first eight months of 2026 than a year earlier (Census Bureau, Monthly Construction Spending, August 2026 Year to Date, Oct 2026).
How Much of Plumbing Work Is Residential and How Much Is Commercial?
The split is close to even, and the two sides are moving apart. Commercial work is growing, and home work has lost ground since late 2024. The Bureau of Labor Statistics splits all specialty trade contractors, not only plumbers, into residential and nonresidential, so the job lines below describe the whole group.
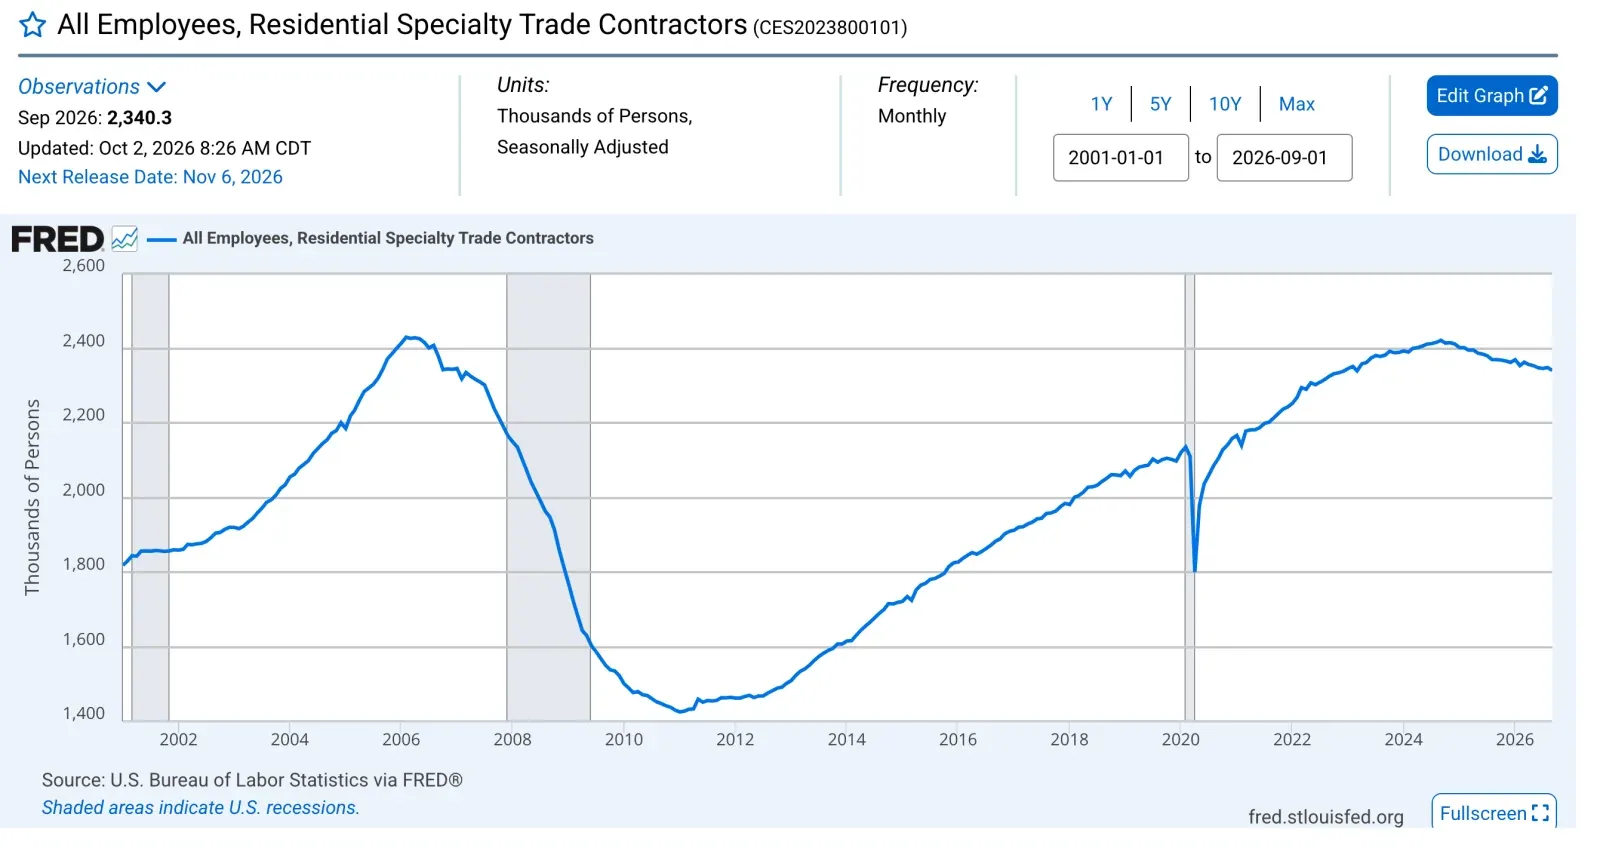 Figure 5: Residential specialty trade employment peaked in September 2024 and has slipped since, while the same data for nonresidential contractors kept rising. Source: U.S. Bureau of Labor Statistics, All Employees, Residential Specialty Trade Contractors, retrieved from FRED, Sep 2026. Screenshot of the source page, captured 21 Oct 2026.
Which way are the jobs moving?
- Residential specialty trade employment was 2,369.1 thousand in September 2025 (BLS Current Employment Statistics, Residential Specialty Trades One Year Earlier, Sep 2025), and nonresidential was 2,854.9 thousand (BLS Current Employment Statistics, Nonresidential Specialty Trades One Year Earlier, Sep 2025).
- Residential specialty trade employment peaked at 2,421.0 thousand in September 2024 (BLS Current Employment Statistics, Residential Specialty Trades Peak, Sep 2024).
What does a large distributor see?
- Ferguson’s US residential sales were $14,598 million in fiscal 2025 (Ferguson Enterprises, Form 10-K FY2025 Residential Sales, Sep 2025).
- Its US commercial sales were $10,088 million (Ferguson Enterprises, Form 10-K FY2025 Commercial Sales, Sep 2025).
- Its civil and infrastructure sales were $2,609 million (Ferguson Enterprises, Form 10-K FY2025 Civil Sales, Sep 2025).
- Its industrial sales were $1,974 million (Ferguson Enterprises, Form 10-K FY2025 Industrial Sales, Sep 2025).
- In the US, non-residential sales grew 6.8% in fiscal 2025, and residential sales grew 0.9% (Ferguson Enterprises, Form 10-K FY2025 Segment Growth, Sep 2025).
What does the Census say about who owns the projects?
- Privately owned projects accounted for $253.9 billion of the work in 2022, and government-owned projects for $34.5 billion (Census Bureau, 2022 Economic Census, Project Owners, Dec 2024).
- State and local government projects were $27.3 billion of the government total, and federal projects were $7.2 billion (Census Bureau, 2022 Economic Census, Government Projects, Dec 2024).
Is repair and remodel work bigger than new construction?
- Ferguson says repair, maintenance and improvement make up about two-thirds of its net sales, and new construction makes up about one-third (Ferguson Enterprises, Form 10-K FY2025 Repair and New Construction, Sep 2025).
- Comfort Systems USA, which works mostly on commercial, industrial and institutional buildings, drew 63.2% of its 2025 revenue from new buildings and 36.8% from renovation, repair and service (Comfort Systems USA, Form 10-K FY2025 Revenue Mix, Feb 2026).
- Mechanical services were 73.3% of Comfort Systems revenue (Comfort Systems USA, Form 10-K FY2025 Mechanical Share, Feb 2026).
- Zurn Elkay says demand for its products is driven by new institutional and commercial building and by retrofits, with residential building a smaller driver, and it reported net sales of $1,695.9 million in 2025 (Zurn Elkay Water Solutions, Form 10-K FY2025, Feb 2026).
- Repair work means many small jobs, and each one needs a quote, a record of parts and an invoice.
What Do Materials and Overhead Cost a Plumbing Shop?
Materials are the biggest cost, and the price of metal is the part a shop cannot control. Copper and brass prices have run well ahead of where they stood a few years ago. A shop that does not update its prices often will give away margin.
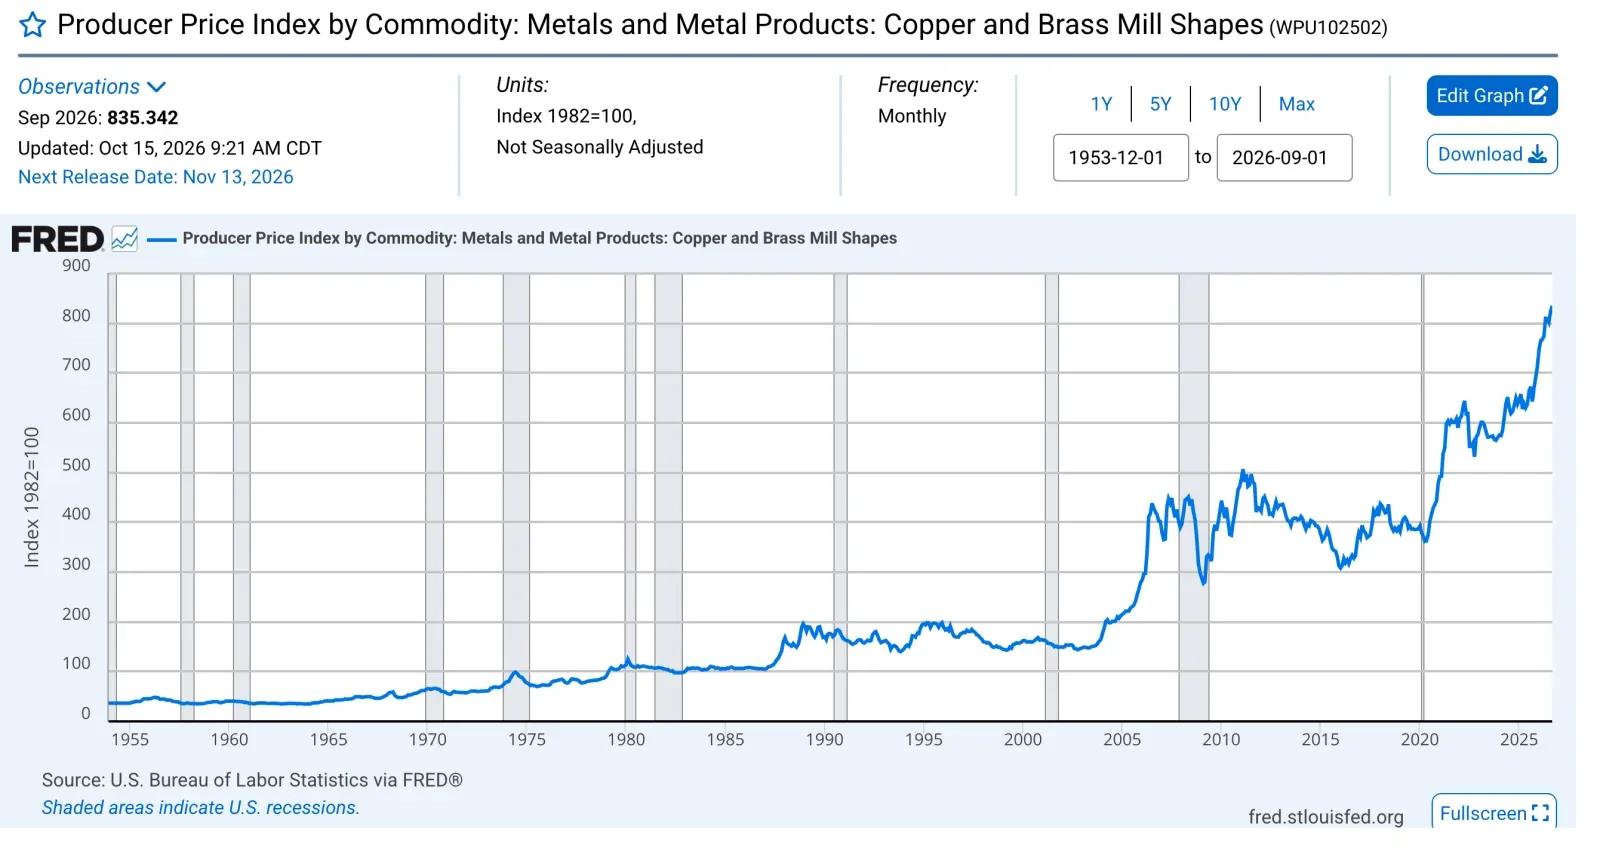 Figure 6: The index for copper and brass mill shapes, a main input for pipe, fittings and valves, reached its highest level on record in 2026. Source: U.S. Bureau of Labor Statistics, Producer Price Index by Commodity, Copper and Brass Mill Shapes, retrieved from FRED, Sep 2026. Screenshot of the source page, captured 21 Oct 2026.
How far have metal prices moved?
- The index stood at 386.7 in December 2019 (BLS Producer Price Index, Copper and Brass Mill Shapes December 2019, Dec 2019).
- It stood at 559.195 in September 2022 (BLS Producer Price Index, Copper and Brass Mill Shapes September 2022, Sep 2022).
- It stood at 747.384 in January 2026 (BLS Producer Price Index, Copper and Brass Mill Shapes January 2026, Jan 2026).
- USGS estimates that copper recovered from scrap supplied about 30% of the US copper supply in 2025 (USGS, Mineral Commodity Summaries 2026, Copper Scrap, Feb 2026).
- The average COMEX copper price was an estimated 480 cents a pound in 2025, against 421.6 in 2024 (USGS, Mineral Commodity Summaries 2026, Copper, Feb 2026).
- Net import reliance for copper rose to an estimated 57% in 2025 from 45% in 2024 (USGS, Mineral Commodity Summaries 2026, Copper Imports, Feb 2026).
- USGS, citing the Copper Development Association, says building construction takes 42% of the copper and copper alloy products used in the US (USGS, Mineral Commodity Summaries 2026, Copper Uses, Feb 2026).
- USGS lists plastics as the substitute for copper in drain pipe, plumbing fixtures and water pipe (USGS, Mineral Commodity Summaries 2026, Copper Substitutes, Feb 2026).
How are manufacturers passing it on?
- Mueller Industries, a maker of copper tube and fittings, booked $336.9 million of added sales in 2025 from higher net selling prices, mostly on copper tube, copper fittings and brass rod (Mueller Industries, Form 10-K FY2025, Feb 2026).
- Its Piping Systems segment sold $2,708.7 million, and $299.1 million of the rise came from higher prices (Mueller Industries, Form 10-K FY2025 Piping Systems, Feb 2026).
- Lower unit sales volume in the segment’s core product lines took $212.0 million off sales (Mueller Industries, Form 10-K FY2025 Volume, Feb 2026).
- Mueller’s total net sales were $4,178.5 million in 2025, up 10.9% (Mueller Industries, Form 10-K FY2025 Net Sales, Feb 2026).
- Mueller says its net selling prices generally move with the cost of raw materials (Mueller Industries, Form 10-K FY2025 Pricing, Feb 2026).
- Masco’s Plumbing Products segment sold $4,992 million in 2025, up 3% (Masco, Form 10-K FY2025, Feb 2026).
- Masco says higher selling prices added 3% while lower volume took away 1% (Masco, Form 10-K FY2025 Price and Volume, Feb 2026).
- Masco’s total net sales fell 3% to $7,562 million in 2025 (Masco, Form 10-K FY2025 Net Sales, Feb 2026).
- Zurn Elkay’s core sales grew 8% in 2025 (Zurn Elkay Water Solutions, Form 10-K FY2025 Core Sales, Feb 2026).
- Watts Water Technologies reported that its Americas net sales rose 11.0% in 2025, helped by price and volume (Watts Water Technologies, Form 10-K FY2025, Feb 2026).
What does a shop spend to run?
- Contractors spent $93.7 billion on materials, parts and supplies in 2022 (Census Bureau, 2022 Economic Census, Cost of Materials, Dec 2024).
- They spent $66.8 billion on materials in 2017 (Census Bureau, 2017 Economic Census, Cost of Materials, May 2021).
- They paid subcontractors $21.2 billion, spent $5.1 billion on gasoline and diesel fuel, and paid $4.6 billion in rent and lease payments (Census Bureau, 2022 Economic Census, Other Costs, Dec 2024).
What do shops spend on marketing and technology?
- Advertising and promotion cost $1.85 billion in 2022 (Census Bureau, 2022 Economic Census, Advertising, Dec 2024).
- The same cost was $1.06 billion in 2017 (Census Bureau, 2017 Economic Census, Advertising, May 2021).
- Communication services cost $1.54 billion, expensed computer hardware cost $807 million, and data processing and purchased computer services cost $388 million (Census Bureau, 2022 Economic Census, Communication and Computer Costs, Dec 2024).
Who Supplies Plumbing Shops?
A thin layer of distributors, makers and home centers stands between the mill and the truck. Prices at this layer set the cost of every job.
 Figure 7: Wholesalers of plumbing and heating equipment and supplies run far fewer locations than the contractors they sell to. Several columns of the table are joined here. Source: Census Bureau, 2022 Economic Census, Wholesale Trade Summary, Dec 2024. Screenshot of the source page, captured 21 Oct 2026.
How big is the wholesale layer?
- Wholesalers of plumbing and heating equipment and supplies employed 81,233 people in 2022 (Census Bureau, 2022 Economic Census, Wholesale Trade Employees, Dec 2024).
- Independent merchant wholesalers sold $83.7 billion, and manufacturers’ own sales branches sold $14.1 billion (Census Bureau, 2022 Economic Census, Wholesale Trade Channels, Dec 2024).
- Ferguson had net sales of $30.8 billion in fiscal 2025 (Ferguson Enterprises, Form 10-K FY2025 Net Sales, Sep 2025).
- Ferguson’s US segment made up 95% of its net sales (Ferguson Enterprises, Form 10-K FY2025 US Share, Sep 2025).
- Ferguson ran 1,519 branches in the US (Ferguson Enterprises, Form 10-K FY2025 Branches, Sep 2025).
- Its US network has about 32,000 associates (Ferguson Enterprises, Form 10-K FY2025 Associates, Sep 2025).
- Watts employed about 5,700 people worldwide at the end of 2025 (Watts Water Technologies, Form 10-K FY2025 Employees, Feb 2026).
- Watts says 66% of its 2025 net sales went to wholesale distributors (Watts Water Technologies, Form 10-K FY2025 Wholesale Share, Feb 2026).
What do manufacturers make?
- Plumbing fixture fitting and trim makers sold $6.6 billion in 2022, and makers of ceramic plumbing fixtures sold $2.65 billion (Census Bureau, 2022 Economic Census, Manufacturing Summary Fixtures, Aug 2025).
- Makers of fabricated pipe and pipe fittings sold $8.0 billion (Census Bureau, 2022 Economic Census, Manufacturing Summary Pipe, Aug 2025).
- Watts Water Technologies sold $2,438.5 million worldwide in 2025 (Watts Water Technologies, Form 10-K FY2025 Net Sales, Feb 2026).
- Fortune Brands’ Water segment, which includes Moen, sold $2,447.6 million in 2025, a 4.6% drop (Fortune Brands Innovations, Form 10-K FY2025, Feb 2026).
How much do home centers sell?
- Sales to Home Depot and Lowe’s together made up about 21% of the Water segment’s net sales at Fortune Brands (Fortune Brands Innovations, Form 10-K FY2025 Home Centers, Feb 2026).
- Sales to all US home centers made up about 26% of Fortune Brands’ net sales (Fortune Brands Innovations, Form 10-K FY2025 Home Center Share, Feb 2026).
- Home Depot took 38% of Masco’s net sales, or $2.9 billion (Masco, Form 10-K FY2025 Home Depot, Feb 2026).
- Lowe’s sold $5,107 million in its Rough Plumbing category in fiscal 2025 (Lowe’s Companies, Form 10-K FY2025, Mar 2026).
- That was 5.9% of Lowe’s net sales (Lowe’s Companies, Form 10-K FY2025 Category Share, Mar 2026).
- Home Depot reported net sales of $164.7 billion in fiscal 2025 (The Home Depot, Form 10-K FY2025, Mar 2026).
- Home Depot says its Plumbing department posted positive comparable sales in fiscal 2025 (The Home Depot, Form 10-K FY2025 Plumbing Department, Mar 2026).
What Do Spending and Backlogs Say About Demand?
Large commercial and public projects keep the biggest mechanical contractors busy. Their backlogs grew sharply in 2025, while total construction spending is slightly lower than a year ago.
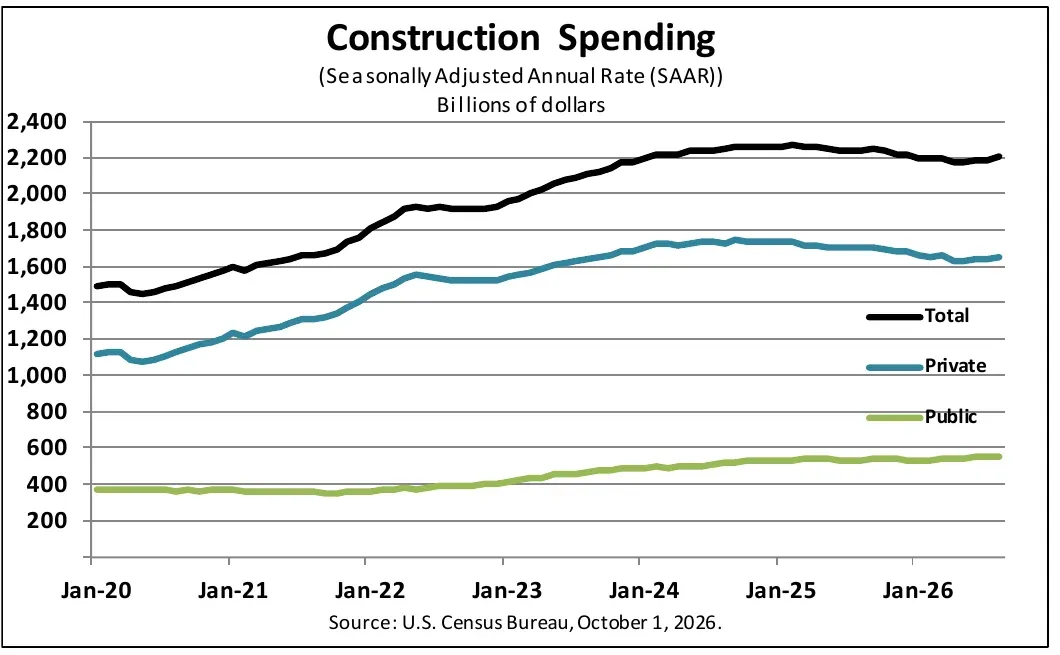 Figure 8: Total US construction spending rose through 2024 and has eased since, while public spending kept climbing. Source: Census Bureau, Monthly Construction Spending, August 2026, Oct 2026. Chart published by the source, captured 21 Oct 2026.
How much is being spent on nonresidential and public buildings?
- Private nonresidential construction ran at $773.0 billion a year in August 2026 (Census Bureau, Monthly Construction Spending, August 2026 Private Nonresidential, Oct 2026).
- Public construction ran at $547.8 billion (Census Bureau, Monthly Construction Spending, August 2026 Public, Oct 2026).
- Public educational construction ran at $113.1 billion (Census Bureau, Monthly Construction Spending, August 2026 Educational, Oct 2026).
- Private office construction ran at $134.1 billion, and private health care construction at $57.0 billion (Census Bureau, Monthly Construction Spending, August 2026 Private Buildings, Oct 2026).
- Water supply construction, public and private together, ran at $36.8 billion, and sewage and waste disposal construction at $53.8 billion (Census Bureau, Monthly Construction Spending, August 2026 Water and Sewage, Oct 2026).
What are the big mechanical contractors reporting?
- EMCOR had revenue of $16.99 billion in 2025 (EMCOR Group, Form 10-K FY2025, Feb 2026).
- Its US mechanical construction and facilities services segment had revenue of $7.05 billion (EMCOR Group, Form 10-K FY2025 Mechanical Revenue, Feb 2026).
- That segment’s remaining performance obligations, work signed but not yet done, were $6.93 billion at the end of 2025 (EMCOR Group, Form 10-K FY2025 Mechanical Backlog, Feb 2026).
- EMCOR’s total was $13.25 billion, against $10.10 billion a year earlier (EMCOR Group, Form 10-K FY2025 Total Backlog, Feb 2026).
- Comfort Systems USA’s mechanical segment backlog was $9.03 billion (Comfort Systems USA, Form 10-K FY2025 Mechanical Backlog, Feb 2026).
How Big Is the Plumbing Trade in Canada?
Canada has a smaller version of the same trade. It is made of small shops, it is concentrated in Ontario, and it has grown since 2022. Federal data counts it under the same code as in the US.
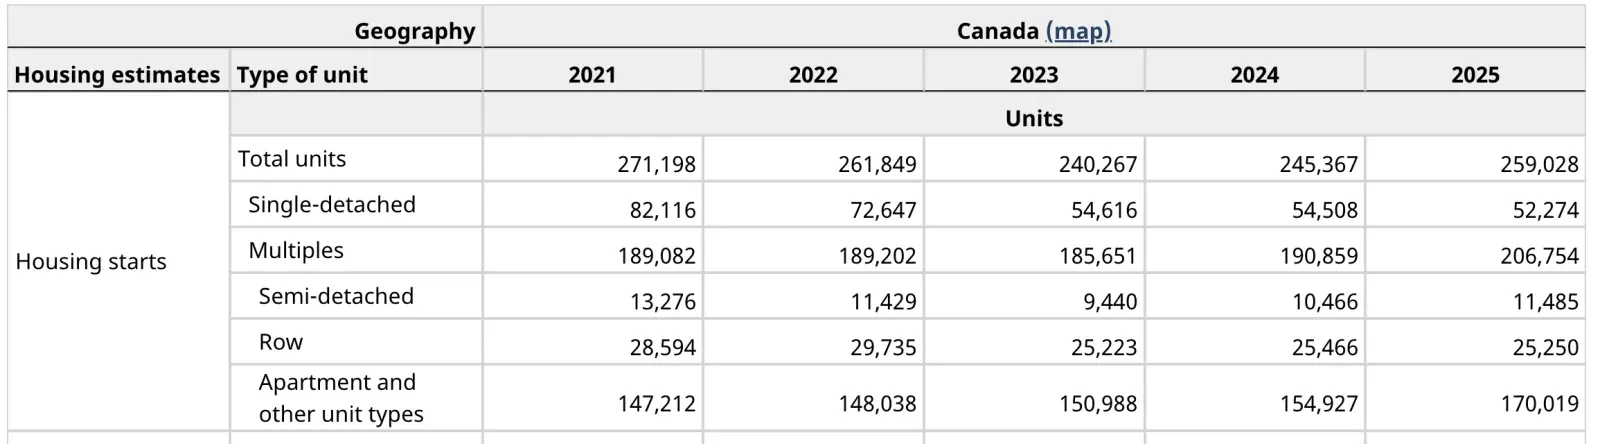 Figure 9: Housing starts in Canada rose in 2025, led by apartments and other multiple-unit buildings. Source: Statistics Canada, Table 34-10-0126-01, Canada Mortgage and Housing Corporation housing starts, Jan 2026. Screenshot of the source page, captured 21 Oct 2026.
How many plumbing businesses does Canada have?
- Canadian Business Counts for June 2026 shows 13,244 plumbing, heating and air-conditioning businesses with no employees (Statistics Canada, Table 33-10-1175-01, Aug 2026).
- The December 2025 count of businesses with employees was 16,621 (Statistics Canada, Table 33-10-1095-01, Feb 2026).
- The December 2022 count was 15,602 (Statistics Canada, Table 33-10-0661-01, Feb 2023).
- The count without employees was 10,999 in December 2022 (Statistics Canada, Table 33-10-0662-01, Feb 2023).
- Canada had 159,672 construction businesses with employees (Statistics Canada, Table 33-10-1174-01 Construction, Aug 2026) and 262,066 without (Statistics Canada, Table 33-10-1175-01 Construction, Aug 2026).
- The wider group of building equipment contractors had 35,094 businesses with employees in June 2026 (Statistics Canada, Table 33-10-1174-01 Building Equipment Contractors, Aug 2026).
How big are Canadian shops?
- Among businesses with employees, 9,646 had 1 to 4 employees (Statistics Canada, Table 33-10-1174-01 Size 1 to 4, Aug 2026).
- 3,187 had 5 to 9 employees (Statistics Canada, Table 33-10-1174-01 Size 5 to 9, Aug 2026).
- 1,988 had 10 to 19 employees (Statistics Canada, Table 33-10-1174-01 Size 10 to 19, Aug 2026).
- 1,262 had 20 to 49 employees (Statistics Canada, Table 33-10-1174-01 Size 20 to 49, Aug 2026).
- Only 13 had 500 or more employees (Statistics Canada, Table 33-10-1174-01 Size 500 Plus, Aug 2026).
Where are the Canadian shops?
- Ontario had 6,525 plumbing, heating and air-conditioning businesses with employees (Statistics Canada, Table 33-10-1174-01 Ontario, Aug 2026).
- Quebec had 2,983 (Statistics Canada, Table 33-10-1174-01 Quebec, Aug 2026).
- British Columbia had 2,933 (Statistics Canada, Table 33-10-1174-01 British Columbia, Aug 2026).
- Alberta had 2,097 (Statistics Canada, Table 33-10-1174-01 Alberta, Aug 2026).
How many people work for them and how is demand?
- Building equipment contractors in Canada had 336,557 employees on payroll in July 2026 (Statistics Canada, Table 14-10-0201-01, Sep 2026).
- That compares with 330,961 in July 2025 (Statistics Canada, Table 14-10-0201-01 July 2025, Sep 2026).
- It compares with 265,538 in July 2015 (Statistics Canada, Table 14-10-0201-01 July 2015, Sep 2026).
- All Canadian construction had 1,246,333 employees in July 2026 (Statistics Canada, Table 14-10-0201-01 Construction, Sep 2026).
- Construction output was $171.75 billion at an annual rate in July 2026, in 2017 dollars (Statistics Canada, Table 36-10-0434-01, Sep 2026).
- Repair construction was $31.65 billion of that (Statistics Canada, Table 36-10-0434-01 Repair Construction, Sep 2026).
- Residential building construction was $54.79 billion (Statistics Canada, Table 36-10-0434-01 Residential Building, Sep 2026).
- Housing starts were 259,028 in 2025, up from 245,367 in 2024 (Statistics Canada, Table 34-10-0126-01, Jan 2026).
- Multi-unit starts reached 206,754 in 2025 (Statistics Canada, Table 34-10-0126-01 Multiples, Jan 2026).
- Ferguson’s Canada segment had net sales of $1,493 million and 227 branches (Ferguson Enterprises, Form 10-K FY2025 Canada, Sep 2025).
Glossary
- NAICS: North American Industry Classification System, the code that sorts firms by what they do. Plumbing, heating and air-conditioning contractors are code 238220 in the US and the same code in Canada.
- Establishment: one physical location. A firm with three shops has three establishments.
- Firm: a company, however many locations it has.
- Nonemployer: a business with no paid staff, such as a solo plumber.
- CBP: County Business Patterns, the Census Bureau’s yearly count of establishments, jobs and payroll.
- SUSB: Statistics of U.S. Businesses, the Census Bureau’s company-level count.
- QCEW: Quarterly Census of Employment and Wages, the Bureau of Labor Statistics count built from unemployment insurance records.
- CES: Current Employment Statistics, the Bureau of Labor Statistics monthly payroll survey.
- PPI: Producer Price Index, which tracks the prices makers receive.
- COMEX: the New York commodity exchange where copper is priced.
Methodology and Sources
The stats come from agencies, regulators and company filings only. Each number was read from the original data file, table or filing, not from a news story or a roundup, and each carries the month the data or the release was published. Census and BLS numbers were read from the source data files. Public company numbers come from annual reports filed with the SEC. Figures are in US dollars unless a line says Canada. The Census groups plumbing with heating and air-conditioning, so most counts cover all three trades. The page is checked and refreshed every month.
Sources
- BLS, Current Employment Statistics, Nonresidential Specialty Trade Contractors
- BLS, Current Employment Statistics, Plumbing, Heating and Air-Conditioning Contractors
- BLS, Current Employment Statistics, Residential Specialty Trade Contractors
- BLS, Current Employment Statistics, Specialty Trade Contractors
- BLS, Producer Price Index, Copper and Brass Mill Shapes
- BLS, Quarterly Census of Employment and Wages 2015, NAICS 23822
- BLS, Quarterly Census of Employment and Wages 2020, NAICS 23822
- BLS, Quarterly Census of Employment and Wages 2025, NAICS 23822
- Census Bureau, 2017 Economic Census, Construction, basic statistics
- Census Bureau, 2022 Economic Census, Construction, basic statistics
- Census Bureau, 2022 Economic Census, Construction, establishments by employment size
- Census Bureau, 2022 Economic Census, Construction, kind of business
- Census Bureau, 2022 Economic Census, Construction, value of construction work by state
- Census Bureau, 2022 Economic Census, Manufacturing, basic statistics
- Census Bureau, 2022 Economic Census, Wholesale Trade, basic statistics
- Census Bureau, 2022 Economic Census, Wholesale Trade, table EC2242BASIC
- Census Bureau, 2022 Economic Census, table EC2200BASIC
- Census Bureau, County Business Patterns 2010
- Census Bureau, County Business Patterns 2015
- Census Bureau, County Business Patterns 2019
- Census Bureau, County Business Patterns 2020
- Census Bureau, County Business Patterns 2021
- Census Bureau, County Business Patterns 2023
- Census Bureau, County Business Patterns 2023, table CB2300CBP
- Census Bureau, Monthly Construction Spending, August 2026 (Table 1)
- Census Bureau, Monthly Construction Spending, August 2026 (release)
- Census Bureau, Nonemployer Statistics 2024
- Census Bureau, Statistics of U.S. Businesses 2022, detailed enterprise sizes
- Comfort Systems USA, Form 10-K, fiscal year 2025
- EMCOR Group, Form 10-K, fiscal year 2025
- Federal Reserve Bank of St. Louis (FRED), BLS series CES2023800101
- Federal Reserve Bank of St. Louis (FRED), BLS series WPU102502
- Ferguson Enterprises, Form 10-K, fiscal year 2025
- Fortune Brands Innovations, Form 10-K, fiscal year 2025
- Lowe’s Companies, Form 10-K, fiscal year 2025
- Masco, Form 10-K, fiscal year 2025
- Mueller Industries, Form 10-K, fiscal year 2025
- Statistics Canada, Table 14-10-0201-01, Employment by industry, monthly
- Statistics Canada, Table 33-10-0661-01, Canadian Business Counts, with employees, December 2022
- Statistics Canada, Table 33-10-0662-01, Canadian Business Counts, without employees, December 2022
- Statistics Canada, Table 33-10-1095-01, Canadian Business Counts, with employees, December 2025
- Statistics Canada, Table 33-10-1174-01, Canadian Business Counts, with employees, June 2026
- Statistics Canada, Table 33-10-1175-01, Canadian Business Counts, without employees, June 2026
- Statistics Canada, Table 34-10-0126-01, CMHC housing starts, under construction and completions
- Statistics Canada, Table 36-10-0434-01, GDP at basic prices by industry, monthly
- The Home Depot, Form 10-K, fiscal year 2025
- USGS, Mineral Commodity Summaries 2026, Copper
- Watts Water Technologies, Form 10-K, fiscal year 2025
- Zurn Elkay Water Solutions, Form 10-K, fiscal year 2025