Water filter statistics are scattered. No agency publishes a current count of the filters, softeners and reverse osmosis units in US homes, so this page pulls the numbers from the people who produced them: the Census Bureau, EPA, USGS, CDC, NSF’s official listings, state agencies, peer reviewed studies and company annual reports.
It covers who treats their water and why, how hard US water is, what softeners use and send down the drain, which local rules limit them, what certification means, whether certified filters remove lead and PFAS, and what the filings say about the market. Where a number comes from one state or one small study, the text says so.
For a plumbing shop, the pattern is simple. Hardness and salt rules decide the softener jobs, certification claims decide which filter is worth installing, and every unit needs salt, a cartridge or a membrane on a schedule. Every figure below is dated and linked to the page or file it came from. Updated October 2026.
For the wider trade, see plumbing industry numbers and plumber workforce numbers. For related water topics, see drinking water, water heaters, septic systems and water use at home.
Key Takeaways
- Of the 57.2 million households that answered a 2015 Census Bureau question on tap water safety, 7.4% said their water was not safe to drink, and 64% of those households drank commercial bottled water while 27% drank filtered tap water (Census Bureau, American Housing Survey 2015 national public use file, Nov 2020).
- No federal regulation covers residential water filters, purifiers and reverse osmosis systems, so voluntary NSF standards set the minimum for safety and performance (NSF, Standards for Water Treatment Systems, Oct 2026).
- A water softener was the most common treatment reported by Wisconsin private well owners, at 42.0% of 460 respondents (Malecki et al., Science of the Total Environment, Jun 2017).
- Of 1,176 monitored Minnesota drinking water wells, 91% had hard or very hard water (University of Minnesota Water Resources Center and MPCA, Chloride Contributions report, Jan 2019).
- A typical softener uses 20 to 70 gallons of water per regeneration cycle, and some larger systems use up to 200 gallons (EPA WaterSense, Soften Water Without Wasting It guide, May 2026).
- Water softeners were estimated to supply 65% of the chloride that reaches Minnesota’s 613 municipal wastewater treatment plants (Overbo et al., Science of the Total Environment, Apr 2021).
- Santa Clarita Valley voters passed Measure S on Nov 4, 2008, which required removal of every residential automatic water softener that discharges chloride to the sewer by Jun 30, 2009 (Los Angeles County Sanitation Districts, Santa Clarita Valley Chloride Control, Oct 2026).
- California requires a sewer-connected softener installed on or after Jan 1, 2002 to carry a certified salt efficiency rating of at least 4,000 grains of hardness removed per pound of salt (California Legislature, Health and Safety Code 116785, Jan 2000).
- NSF’s official listings show 1,028 products from 71 manufacturers certified to NSF/ANSI 53 for lead reduction (NSF, Official Listings for lead reduction under NSF/ANSI 53, Oct 2026).
- In field studies, 99% of NSF/ANSI 53 certified filters (1,512 of 1,528) removed lead to the certification benchmark, against 61% (91 of 150) in laboratory studies (Tang et al., Water Research, Jul 2023).
- The NSF/ANSI certification level for PFOA and PFOS removal was 20 nanograms per liter when EPA wrote its April 2024 rule, against a drinking water limit of 4.0 nanograms per liter (EPA, PFAS rule in the Federal Register, Apr 2024).
- A home PFAS filter can cost as little as $20 or more than $1,000, not counting maintenance (EPA, Reducing PFAS in Your Drinking Water with a Home Filter, Apr 2024).
- A typical point-of-use reverse osmosis system sends five gallons or more of reject water to the drain for every gallon of treated water it makes (EPA WaterSense, Point-of-Use Reverse Osmosis Systems, Aug 2026).
- Pentair’s Water Solutions segment reported 2025 net sales of $1,062.1 million, down 6.1% from 2024 (Pentair, Form 10-K for 2025, Feb 2026).
Home Water Filtration Statistics: How Many Homes Treat Their Water?
Nobody counts home water filters well. The one federal question that comes close was asked in 2015 and reached only households that distrust their tap, so most of the picture below comes from state surveys and small studies.
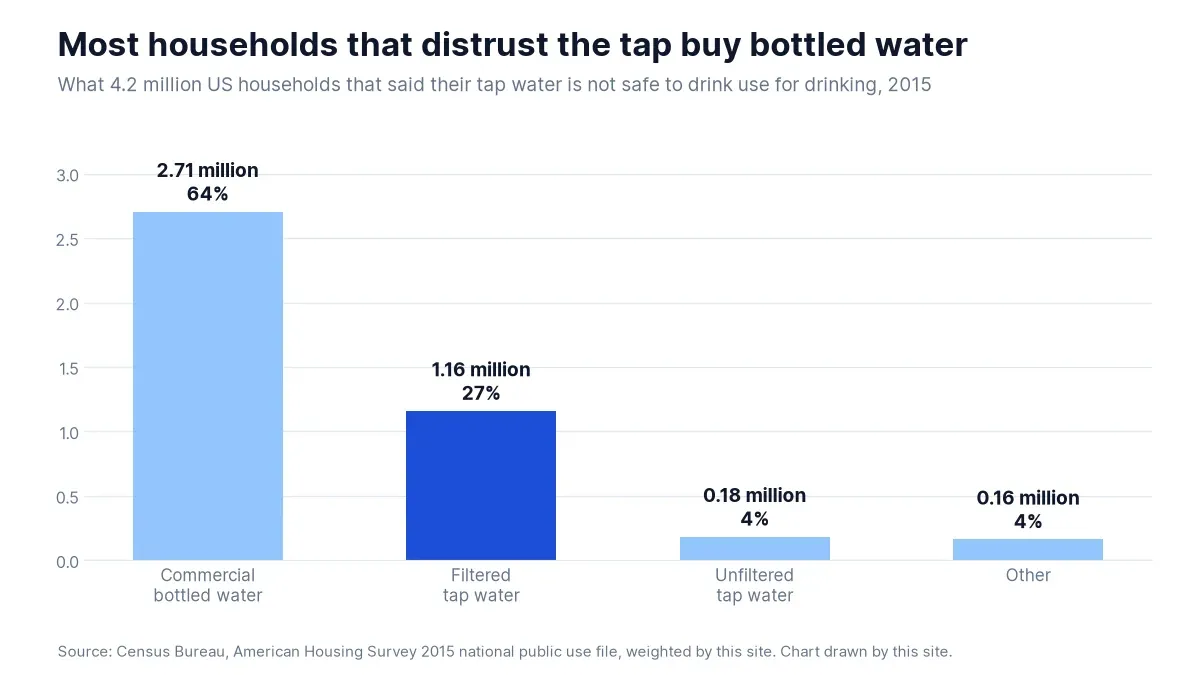 Figure 1: Of the households that said their tap water was not safe, about two in three bought bottled water and about one in four filtered the tap. Source: Census Bureau, American Housing Survey 2015 national public use file, Nov 2020. Chart drawn by this site from the source data, captured 21 Oct 2026.
Which households say their tap water is not safe?
- The 2015 survey asked “Where do you get your water for drinking?” and offered four answers: unfiltered tap water, filtered tap water, commercial bottled water and other (Census Bureau, 2015 AHS Items Booklet, Nov 2016).
- In the public use file, only households that answered no to “is the water safe for cooking and drinking” have an answer to that question, which is why the filter count covers 4.2 million households and not all of them (Census Bureau, American Housing Survey 2015 national public use file, Nov 2020).
- By this site’s weighted count of the same file, 7.7% of households on a public supply said the water was not safe, against 4.5% of households on a well (Census Bureau, American Housing Survey 2015 national public use file, Nov 2020).
- Of the households that said no, 4.3% kept drinking unfiltered tap water and 3.9% named another source (Census Bureau, American Housing Survey 2015 national public use file, Nov 2020).
Who drinks filtered tap water?
- Among 2,280 pregnant women in three southern US study areas, filtered tap water supplied 19% of mean water intake, against 52% for unfiltered tap water and 28% for bottled water (EPA, Exposure Factors Handbook Chapter 3 update, Feb 2019).
- Women with household income above $80,000 got 29% of their intake from filtered tap water, against 11% for women at $40,000 or less (EPA, Exposure Factors Handbook Chapter 3 update, Feb 2019).
- Women with a four-year college degree got 27% of their intake from filtered tap water, against 8% for women with a high school education or less (EPA, Exposure Factors Handbook Chapter 3 update, Feb 2019).
- In a small Colorado study from 1996 and 1997, 16.3% of nonpregnant women named filtered water as their principal source of drinking water at home, against 11.3% of pregnant women (EPA, Exposure Factors Handbook Chapter 3 update, Feb 2019).
How common is softening and treatment in small studies?
- A Minnesota survey of 191 water conditioning and plumbing professionals, an 11% response rate, put household softening at 72% of the state population (University of Minnesota Water Resources Center and MPCA, Chloride Contributions report, Jan 2019).
- The same survey estimated that 35% of households soften even where the city already softens its water, and 52% in northeastern Minnesota, where water is softer (University of Minnesota Water Resources Center and MPCA, Chloride Contributions report, Jan 2019).
- In a rural Arizona community, about 42% of 31 sampled homes treated their water (Lothrop et al., Water, Mar 2015).
- Higher income and more education went with treating the water, with odds ratios of 1.25 and 1.49 (Lothrop et al., Water, Mar 2015).
Which Treatment Do Private Well Owners Install?
In Wisconsin, salt beats every filter on private wells, and the stated reason is rust and scale, not health. That matters to a shop: the first call is usually a softener or an iron problem.
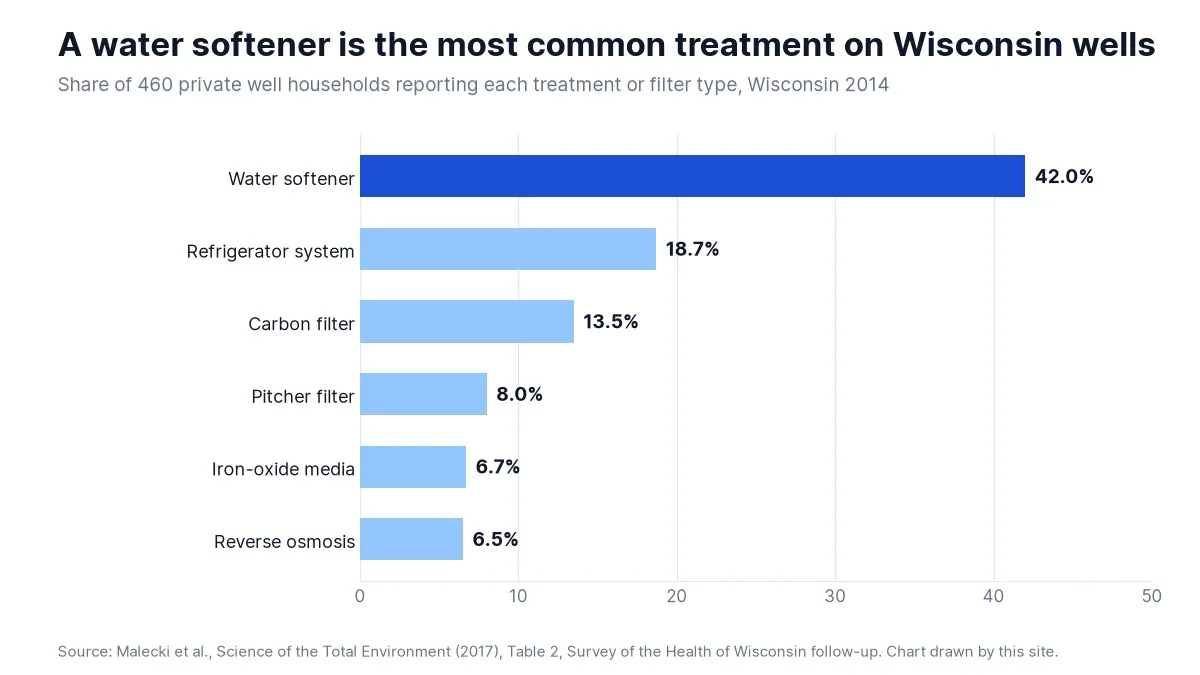 Figure 2: A water softener was reported by 42.0% of Wisconsin private well households, well ahead of refrigerator systems, carbon filters and pitchers. Source: Malecki et al., Science of the Total Environment, Jun 2017. Chart drawn by this site from the source data, captured 21 Oct 2026.
What do well households use?
- The mailed survey followed up 726 private well households from the Survey of the Health of Wisconsin and drew 460 responses (Malecki et al., Science of the Total Environment, Jun 2017).
- A total of 265 households said they treat or filter their well water and 159 said they do not (Malecki et al., Science of the Total Environment, Jun 2017).
- After softeners came refrigerator systems at 18.7%, carbon filters at 13.5% and pitcher filters at 8.0% (Malecki et al., Science of the Total Environment, Jun 2017).
- Iron-oxide media were reported by 6.7% of households and reverse osmosis by 6.5% (Malecki et al., Science of the Total Environment, Jun 2017).
Why do they treat, and why not?
- Hardness or iron was the main reason for treating, cited by 73.2% of households that treat (Malecki et al., Science of the Total Environment, Jun 2017).
- A belief that treated water is healthier and safer was cited by 36.4%, and better taste or smell by 32.7% (Malecki et al., Science of the Total Environment, Jun 2017).
- Among households that do not treat, 78% said the water does not smell or taste bad and 77% said they had drunk it for years without a problem (Malecki et al., Science of the Total Environment, Jun 2017).
- Only 15% named cost as the reason they do not treat (Malecki et al., Science of the Total Environment, Jun 2017).
Do testing and treatment go together?
- Households in the Southeast and Southern health regions were 2.9 and 2.3 times as likely to treat as those in the Western region (Malecki et al., Science of the Total Environment, Jun 2017).
- Households above $99,999 in income were 2.5 times as likely to treat or filter as those below $25,000 (Malecki et al., Science of the Total Environment, Jun 2017).
- About 26% treated their water but had not tested it in the last ten years, while 37% had done both (Malecki et al., Science of the Total Environment, Jun 2017).
- EPA advises well owners to test annually for total coliform bacteria, nitrates, total dissolved solids and pH (EPA, Protect Your Home’s Water, Feb 2026).
How Hard Is Water Across the United States?
Hardness is local, and the only national picture is a USGS map of about 2,100 domestic wells. Nearly every sizing decision for a softener starts with a hardness number for the street, not for the state.
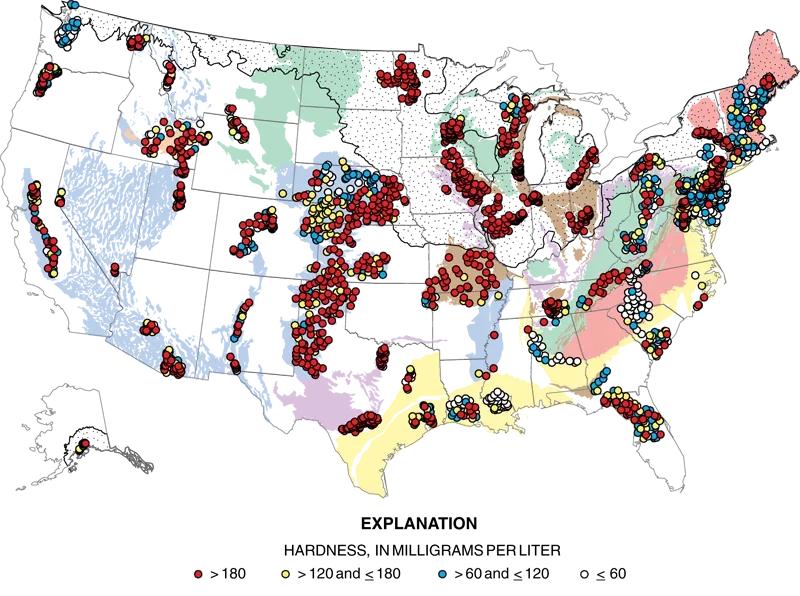 Figure 3: Red dots mark domestic wells with hardness above 180 milligrams per liter, and they cluster across the center and west of the country. Source: USGS, Hardness of Water, Aug 2026. Chart published by the source, captured 21 Oct 2026.
What counts as hard water?
- USGS classes water as soft at 0 to 60 mg/L as calcium carbonate, moderately hard at 61 to 120, hard at 121 to 180 and very hard above 180 (USGS, Hardness of Water, Aug 2026).
- A table adapted from the Water Quality Association adds a slightly hard class and runs from soft at 0 to 17 mg/L (0 to 1.0 grains per gallon) to very hard at 180 mg/L and over (10.5 grains per gallon and over) (University of Nebraska-Lincoln Extension, NebGuide G1491, Sep 2014).
- WaterSense says water above 120 mg/L, or 7 grains per gallon, is generally considered hard (EPA WaterSense, Soften Water Without Wasting It guide, May 2026).
- It adds that softeners are often recommended when hardness passes 180 mg/L, or 10 grains per gallon (EPA WaterSense, Soften Water Without Wasting It guide, May 2026).
Where is water hardest?
- The USGS domestic well study assessed water quality at about 2,100 wells across the country (USGS, Hardness of Water, Aug 2026).
- USGS found hard water prevalent in the east-central and western United States, which tracks carbonate aquifers and aquifers high in dissolved solids (USGS, Hardness of Water, Aug 2026).
- WaterSense says hard water is most common in the Southwest and Midwest, and in other areas that rely mainly on groundwater (EPA WaterSense, Water-Efficient Home Water Softeners fact sheet, May 2026).
- USGS warns that its national surface-water hardness map uses 1975 data and is not meant for decisions at the scale of a single home (USGS, Hardness of Water, Aug 2026).
What do state well studies show?
- In Minnesota, 84% of the 1,176 monitored drinking water wells had very hard water (University of Minnesota Water Resources Center and MPCA, Chloride Contributions report, Jan 2019).
- Average hardness across those wells was 350 mg/L (20 grains per gallon), with a median of 289 mg/L (17 grains per gallon) (University of Minnesota Water Resources Center and MPCA, Chloride Contributions report, Jan 2019).
- The hardest water was in the Sioux Quartzite aquifer of southwestern Minnesota (University of Minnesota Water Resources Center and MPCA, Chloride Contributions report, Jan 2019).
- At the other end, 84% of 962 mother and infant pairs in a New Hampshire birth cohort had naturally soft water at home, at or below 60 mg/L (Ezzamouri et al., Clinical and Experimental Allergy, Dec 2022).
What Does Hard Water Do to Homes, Plumbing and Skin?
Hard water is a nuisance, and every agency says so before it says anything else. The cost shows up as scale, soap scum and tired water heaters, not as a health problem.
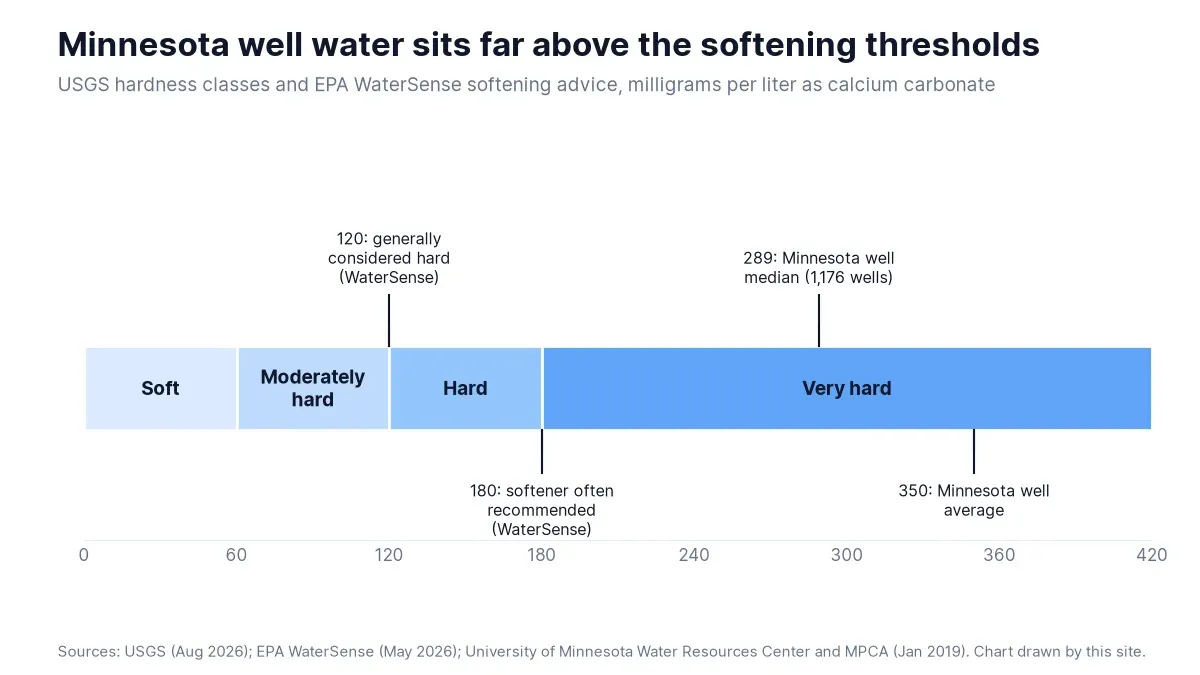 Figure 4: Minnesota’s well median sits deep in the very hard class, well past the level where WaterSense says softeners are often recommended. Source: USGS, Hardness of Water, Aug 2026. Chart drawn by this site from the source data, captured 21 Oct 2026.
Is hard water a health risk?
- USGS describes hardness as a property of water that is not a health concern but can be a nuisance (USGS, Hardness of Water, Aug 2026).
- The Nebraska extension guide calls hard water a nuisance problem and says removing hardness ions is not necessary for health reasons (University of Nebraska-Lincoln Extension, NebGuide G1491, Sep 2014).
- A New Hampshire birth cohort of 962 mother and infant pairs found little evidence of a link between water hardness and eczema overall, with parent-reported eczema at 28% in the first year (Ezzamouri et al., Clinical and Experimental Allergy, Dec 2022).
- In a UK pilot trial of softeners for infants at risk of eczema, 28% of 149 eligible families (41) could not have a softener installed, for technical reasons or lack of landlord approval (Jabbar-Lopez et al., SOFTER trial, Dec 2021).
- At six months, 33% of infants in the softener group (12 of 36) had visible eczema, against 48% in the control group (15 of 31), a difference the pilot was not built to test (Jabbar-Lopez et al., SOFTER trial, Dec 2021).
What does scale do to plumbing and water heaters?
- USGS says scale from heated hard water can reduce the life of equipment, raise heating costs, lower the efficiency of electric water heaters and clog pipes (USGS, Hardness of Water, Aug 2026).
- WaterSense says scale impedes flow and decreases heat conductivity, and that hard water can shorten the life of water heaters, toilet components and washing machines (EPA WaterSense, Soften Water Without Wasting It guide, May 2026).
- In a water heater, heat drives calcium and magnesium carbonate out of the water as scale, which slows heating and raises energy use (University of Nebraska-Lincoln Extension, NebGuide G1491, Sep 2014).
- The University of Minnesota Water Resources Center lists longer appliance life, less scale on fixtures, lower water heater energy use and less cleaning product as benefits of softening (University of Minnesota Water Resources Center, Residential softening, Oct 2026).
- EPA’s secondary limit for total dissolved solids is 500 mg/L, and above it water can show hardness, deposits, colored water, staining and a salty taste (EPA, Secondary Drinking Water Standards, May 2026).
What else has to be handled along with hardness?
- EPA’s secondary standards are non-mandatory guidelines for 15 contaminants, and EPA does not enforce them (EPA, Secondary Drinking Water Standards, May 2026).
- The secondary levels are 0.3 mg/L for iron, which causes rusty color and orange staining, and 0.05 mg/L for manganese, which causes black to brown color (EPA, Secondary Drinking Water Standards, May 2026).
- Softeners may remove as much as 5 to 10 ppm of iron and manganese, but iron above 5 ppm can reduce a softener’s effectiveness (University of Nebraska-Lincoln Extension, NebGuide G1491, Sep 2014).
- EPA tells well owners to test for hardness when residues are scaly and soap will not lather, and for manganese and iron when a softener is needed (EPA, Protect Your Home’s Water, Feb 2026).
- Softening adds sodium at about 8 mg/L for each grain per gallon of hardness, so 10 grains per gallon of hardness leaves about 80 mg/L of sodium (University of Nebraska-Lincoln Extension, NebGuide G1491, Sep 2014).
Water Softener Statistics: How Much Salt and Water Do They Use?
A softener is a salt and water appliance first. The gap between an old time-clock unit and an efficient one is wide enough to change the quote on every job.
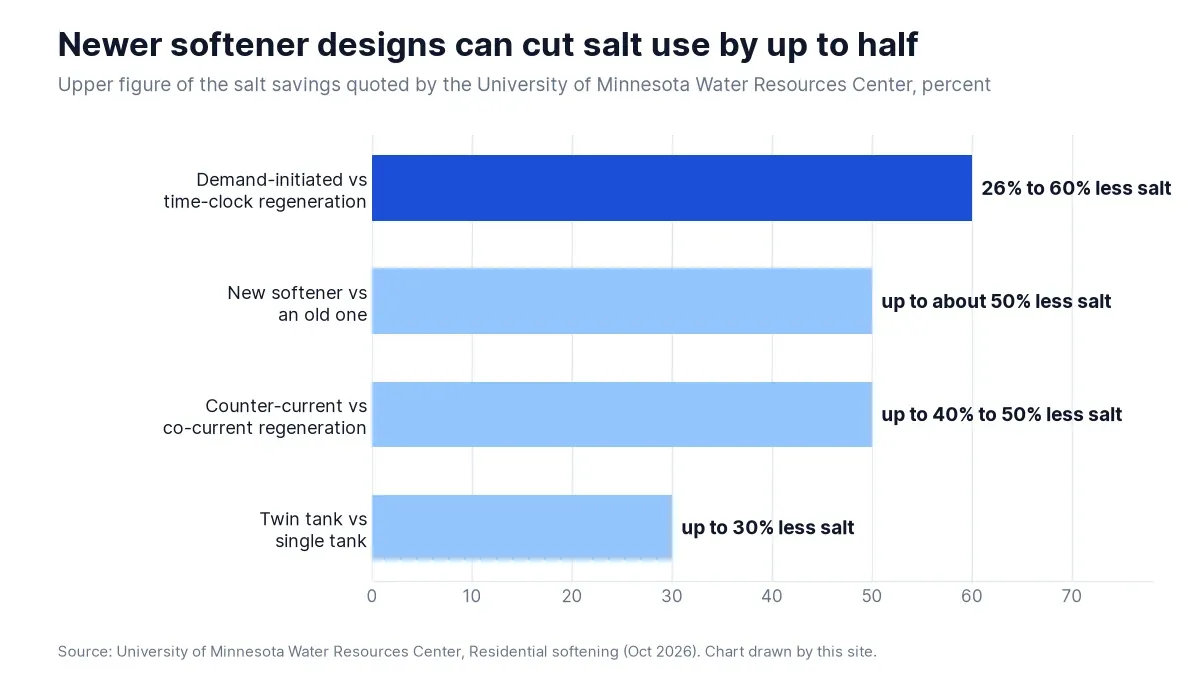 Figure 5: Every upgrade the center lists cuts salt use, and demand-initiated regeneration has the widest range. Source: University of Minnesota Water Resources Center, Residential softening, Oct 2026. Chart drawn by this site from the source data, captured 21 Oct 2026.
How much water does a regeneration cycle use?
- Efficient softeners can use 4 gallons of water or less per 1,000 grains of hardness removed (EPA WaterSense, Soften Water Without Wasting It guide, May 2026).
- The voluntary NSF/ANSI 44 efficiency rating requires a softener to use 5.0 gallons of water or fewer per 1,000 grains of hardness removed (EPA WaterSense, Guide to Selecting Water Treatment Systems, Nov 2024).
- Regeneration uses about 50 gallons of water, roughly one load in an older washing machine (University of Nebraska-Lincoln Extension, NebGuide G1491, Sep 2014).
- Sixty to 120 minutes pass while brine moves through the unit and flushes the tank before soft water is available again (University of Nebraska-Lincoln Extension, NebGuide G1491, Sep 2014).
- WaterSense’s softener page says regeneration can use 25 gallons of water or more a day, or up to 10,000 gallons a year (EPA WaterSense, Cation Exchange Water Softeners, May 2026).
How much salt does a household use?
- Households that soften used an average of 25 pounds of salt per household per month in the Minnesota estimate (University of Minnesota Water Resources Center and MPCA, Chloride Contributions report, Jan 2019).
- The report calls that conservative, noting vendor estimates of 54 pounds a month in Rochester and a survey in Alexandria that put timer-based softeners at 100 pounds a month (University of Minnesota Water Resources Center and MPCA, Chloride Contributions report, Jan 2019).
- Household softening put 132,500 metric tons of chloride a year into Minnesota’s wastewater, close to an Illinois estimate of 135,000 tons from softening (University of Minnesota Water Resources Center and MPCA, Chloride Contributions report, Jan 2019).
- Timer-based units were an estimated 26% of softeners but 42% of the chloride load from softening (University of Minnesota Water Resources Center and MPCA, Chloride Contributions report, Jan 2019).
- Less than 5% of the softening chloride load came from communities with slightly to moderately hard water (University of Minnesota Water Resources Center and MPCA, Chloride Contributions report, Jan 2019).
Which upgrades save the most?
- Demand-initiated regeneration uses 26% to 60% less salt and 25% to 40% less water than time-clock regeneration (University of Minnesota Water Resources Center, Residential softening, Oct 2026).
- A twin-tank softener uses up to 30% less salt and 15% less water than a single tank, at a price about 30% higher (University of Minnesota Water Resources Center, Residential softening, Oct 2026).
- Counter-current regeneration uses up to 40% to 50% less salt and up to 30% less water than co-current regeneration (University of Minnesota Water Resources Center, Residential softening, Oct 2026).
- Replacing an old softener can cut salt use by up to about 50% (University of Minnesota Water Resources Center, Residential softening, Oct 2026).
What Do Softeners Do to Wastewater and Streams?
Softening moves hardness out of the pipes and chloride into the sewer. Treatment plants do not remove it, so where it lands is a rules question, not a plumbing one.
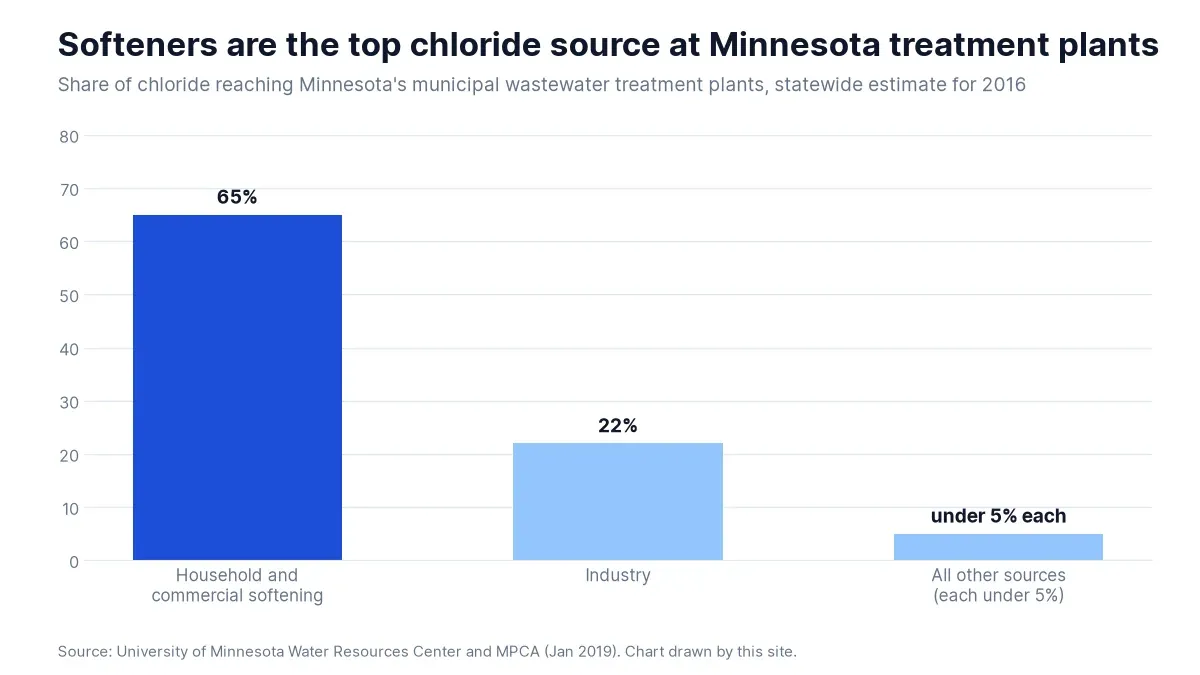 Figure 6: Household and commercial softening was the largest source of chloride reaching Minnesota’s municipal treatment plants, ahead of industry. Source: University of Minnesota Water Resources Center and MPCA, Chloride Contributions report, Jan 2019. Chart drawn by this site from the source data, captured 21 Oct 2026.
How big a chloride source are softeners?
- Industry supplied 22% of the statewide chloride load at Minnesota treatment plants (University of Minnesota Water Resources Center and MPCA, Chloride Contributions report, Jan 2019).
- A mass balance of 96 plants that discharged 114,600 metric tons of chloride in 2016 put softening at 58% of the load and industry at 26% (University of Minnesota Water Resources Center and MPCA, Chloride Contributions report, Jan 2019).
- Road salt was still the largest chloride source statewide, at 403,600 metric tons applied in 2016 (University of Minnesota Water Resources Center and MPCA, Chloride Contributions report, Jan 2019).
- Of the 33,100 metric tons of chloride from residential septic systems, 29,600 came from water softening (University of Minnesota Water Resources Center and MPCA, Chloride Contributions report, Jan 2019).
What does the salt do downstream?
- The MPCA says one teaspoon of salt can permanently pollute five gallons of water, and chloride cannot feasibly be removed once it is in the water (MPCA, Chloride, Oct 2026).
- The MPCA says chloride in wastewater appears to be a problem in almost 90 Minnesota communities (MPCA, Chloride, Oct 2026).
- The University of Minnesota Water Resources Center counts approximately 100 communities with chloride in treatment plant discharge that may exceed state standards (University of Minnesota Water Resources Center, Water softening, Oct 2026).
- Fifty Minnesota lakes and streams exceed the chloride standard for aquatic life, and 75 more water bodies are near it (MPCA, Chloride, Oct 2026).
- EPA’s 1988 aquatic life criteria for chloride are 860 mg/L for acute exposure and 230 mg/L for chronic exposure (EPA, Aquatic Life Criteria Table, Jun 2026).
- EPA’s secondary standard for chloride in drinking water is 250 mg/L, above which water can taste salty (EPA, Secondary Drinking Water Standards, May 2026).
- In the Twin Cities metro area, 27% of monitoring wells in shallow aquifers exceeded EPA’s drinking water guideline for chloride (MPCA, Chloride, Oct 2026).
What would it cost to fix, and what about septic systems?
- Across 84 Minnesota cities, softening centrally with reverse osmosis or lime cost about one third to one quarter as much as home softening plus end-of-pipe chloride treatment (Bakshi et al., PLOS ONE, Feb 2021).
- Reverse osmosis softening at the water plant cost only 1.1 times the business-as-usual option (Bakshi et al., PLOS ONE, Feb 2021).
- EPA issued a notice of intent in November 2010 to develop a WaterSense softener specification, then chose not to proceed because of concerns about softener discharge and wastewater treatment (EPA WaterSense, Cation Exchange Water Softeners, May 2026).
- The Water Quality Association tells installers to keep the predicted monovalent to divalent cation ratio at or below 5 when softener discharge goes to a septic system (Water Quality Association, Water Softeners and Septic Systems, Oct 2026).
Which Local Rules Limit Water Softeners?
A few places treat the softener as a pollution source and write rules for it. California is the clearest case, and a shop working there needs the install conditions as well as the bans.
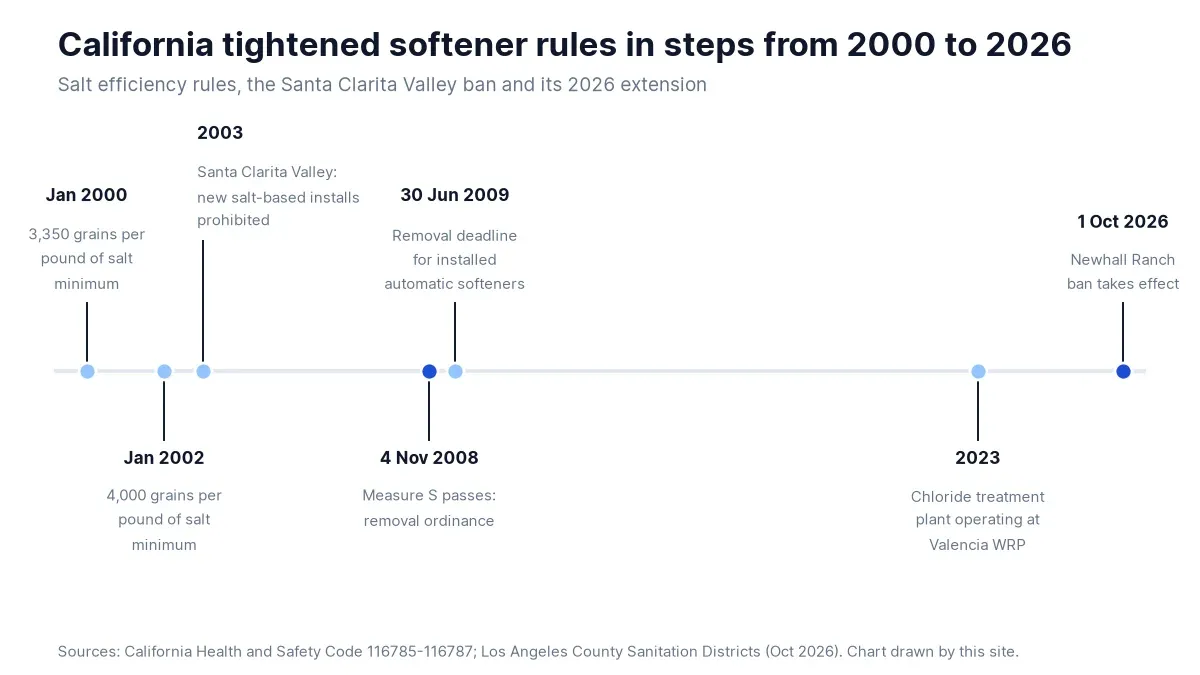 Figure 7: California set salt efficiency minimums in 2000 and 2002, the Santa Clarita Valley banned new salt-based installs in 2003, and the ban reached Newhall Ranch in 2026. Source: Los Angeles County Sanitation Districts, Santa Clarita Valley Chloride Control, Oct 2026. Chart drawn by this site from the source data, captured 21 Oct 2026.
What must a new California softener meet?
- The Legislature found that variation in water hardness often requires onsite softening to be available to households, but only as the article authorizes (California Legislature, Health and Safety Code 116775, Jan 2000).
- A sewer-connected softener must start regeneration by demand control (California Legislature, Health and Safety Code 116785, Jan 2000).
- Softeners installed on or after Jan 1, 2000 needed a certified rating of no less than 3,350 grains of hardness removed per pound of salt (California Legislature, Health and Safety Code 116785, Jan 2000).
- The install must come with faucet flow restrictors, shower head restrictors and toilet reservoir dams on every fixture using softened water (California Legislature, Health and Safety Code 116785, Jan 2000).
- Piping must carry untreated water to hose bibs and sill cocks, with bypass valves allowed on slab foundations, condominiums and where piping is physically inhibited (California Legislature, Health and Safety Code 116785, Jan 2000).
When can a city or district limit softeners?
- A local agency may limit or prohibit installs of sewer-connected residential softeners only after findings tied to waste discharge or water reclamation requirements (California Legislature, Health and Safety Code 116786, Jan 2004).
- The findings must rest on an independent study of every source of salinity, including industry and commercial discharge (California Legislature, Health and Safety Code 116786, Jan 2004).
- Such an ordinance is prospective and may not require removal of softeners installed before it takes effect (California Legislature, Health and Safety Code 116786, Jan 2004).
- The Santa Clarita Valley Sanitation District alone may require removal, after a voter referendum and not before Jan 1, 2009 (California Legislature, Health and Safety Code 116787, Jan 2022).
- Owners get compensation for 100% of the appliance value and removal cost under the voluntary program, and 75% once the ordinance takes effect (California Legislature, Health and Safety Code 116787, Jan 2022).
- One required finding cites the chloride total maximum daily load (TMDL) for Reaches 5 and 6 of the Santa Clara River, which took effect on May 4, 2005 (California Legislature, Health and Safety Code 116787, Jan 2022).
What happened in the Santa Clarita Valley?
- New installs of these softeners have been prohibited in the valley since 2003 (Los Angeles County Sanitation Districts, Santa Clarita Valley Chloride Control, Oct 2026).
- The ban covers automatic, self-regenerating softeners that use rock salt, sodium chloride or potassium chloride, regenerate on site and discharge brine to the sewer (Los Angeles County Sanitation Districts, Santa Clarita Valley Chloride Control, Oct 2026).
- Exchange-tank softeners, salt-free conditioners, reverse osmosis and carbon filtration are the listed alternatives (Los Angeles County Sanitation Districts, Santa Clarita Valley Chloride Control, Oct 2026).
- A specialized advanced treatment facility at the Valencia Water Reclamation Plant has removed chloride since 2023 (Los Angeles County Sanitation Districts, Santa Clarita Valley Chloride Control, Oct 2026).
- The Newhall Ranch Sanitation District adopted its own ban on Sep 1, 2026, effective Oct 1, 2026 (Los Angeles County Sanitation Districts, Santa Clarita Valley Chloride Control, Oct 2026).
- WaterSense warns that some local jurisdictions prohibit installing and using ion exchange softeners and tells buyers to check local restrictions first (EPA WaterSense, Soften Water Without Wasting It guide, May 2026).
What Do NSF Standards Certify, and How Many Products Carry Them?
Certification is the only quality gate for home filters, and it is voluntary. The numbers in the standard names are history, not a ranking, and the listings show how lopsided the market is toward taste and odor.
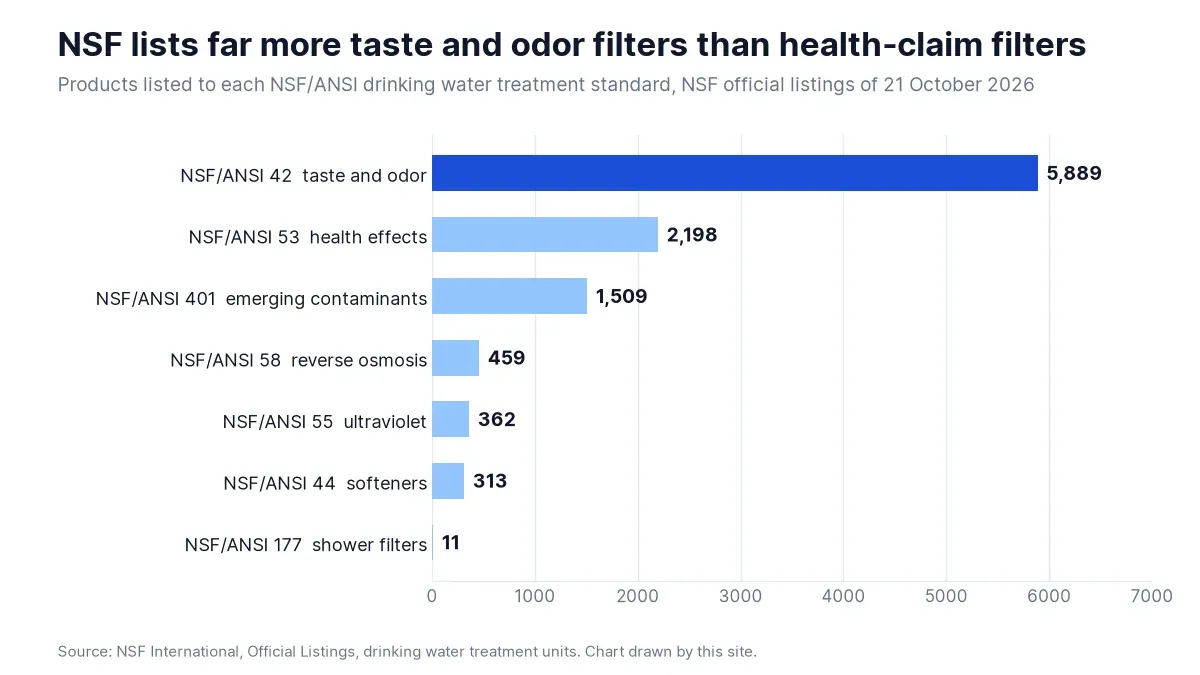 Figure 8: Taste and odor filters dominate NSF’s official listings, and softeners are a small group by comparison. Source: NSF, Official Listings for NSF/ANSI 42, Oct 2026. Chart drawn by this site from the source data, captured 21 Oct 2026.
What do the main standards cover?
- NSF says the numbers in the standard names reflect the order in which each standard was developed and are not a ranking or rating system (NSF, Standards for Water Treatment Systems, Oct 2026).
- NSF/ANSI 42 certifies reduction of aesthetic impurities such as chlorine, taste and odor, and NSF/ANSI 53 certifies reduction of a contaminant with a health effect (NSF, Standards for Water Treatment Systems, Oct 2026).
- NSF/ANSI 44 covers softeners that use a cation exchange resin regenerated with sodium or potassium chloride (NSF, Standards for Water Treatment Systems, Oct 2026).
- NSF/ANSI 55 covers ultraviolet systems, NSF/ANSI 58 covers reverse osmosis and NSF/ANSI 62 covers distillation (NSF, Standards for Water Treatment Systems, Oct 2026).
- NSF/ANSI 177 shower filters are certified only to reduce free available chlorine (NSF, Standards for Water Treatment Systems, Oct 2026).
- NSF/ANSI 401 covers systems verified to reduce one or more of 15 emerging contaminants (NSF, Standards for Water Treatment Systems, Oct 2026).
- NSF launched Protocol 549 on Oct 14, 2026, the first standard worldwide to validate glyphosate reduction by water filtration products (NSF, Standards for Water Treatment Systems, Oct 2026).
How many products does NSF list?
- NSF/ANSI 42 lists 5,889 products from 205 manufacturers (NSF, Official Listings for NSF/ANSI 42, Oct 2026).
- NSF/ANSI 53 lists 2,198 products from 115 manufacturers (NSF, Official Listings for NSF/ANSI 53, Oct 2026).
- NSF/ANSI 401 lists 1,509 products from 62 manufacturers (NSF, Official Listings for NSF/ANSI 401, Oct 2026).
- NSF/ANSI 58 lists 459 products from 57 manufacturers (NSF, Official Listings for NSF/ANSI 58, Oct 2026).
- NSF/ANSI 55 lists 362 products from 19 manufacturers (NSF, Official Listings for NSF/ANSI 55, Oct 2026).
- NSF/ANSI 44 lists 313 softener products from 13 manufacturers (NSF, Official Listings for NSF/ANSI 44, Oct 2026).
- NSF/ANSI 177 lists 11 shower filter products from 7 manufacturers (NSF, Official Listings for NSF/ANSI 177, Oct 2026).
What does a certification not tell you?
- NSF says certification does not mean a filter, purifier or treatment system will reduce all possible contaminants (NSF, Standards for Water Treatment Systems, Oct 2026).
- Manufacturers choose which contaminants a product will reduce, so the label has to show both the standard and the specific claim, such as lead (NSF, Home Water Treatment, Oct 2026).
- A non-certified replacement cartridge can look the same, yet even the smallest size difference could let water go around the cartridge instead of through it (NSF, Changing Water Filters, Oct 2026).
- Minnesota’s health department points buyers to units certified by NSF, UL or the Water Quality Association, and notes these groups do not certify units for every contaminant (Minnesota Department of Health, Home Water Treatment Facts, Aug 2024).
- CDC lists NSF standard 42 for taste and odor, 53 for cyst reduction, 58 for reverse osmosis and 62 for distillation among the standards related to water treatment (CDC, About Choosing Home Water Filters, Apr 2024).
Do Certified Filters Remove Lead?
For lead, the evidence is better than for almost any other filter claim, and much of it comes from EPA’s own field tests. The failures are specific: filters pushed past what they were certified for, or clogged by iron.
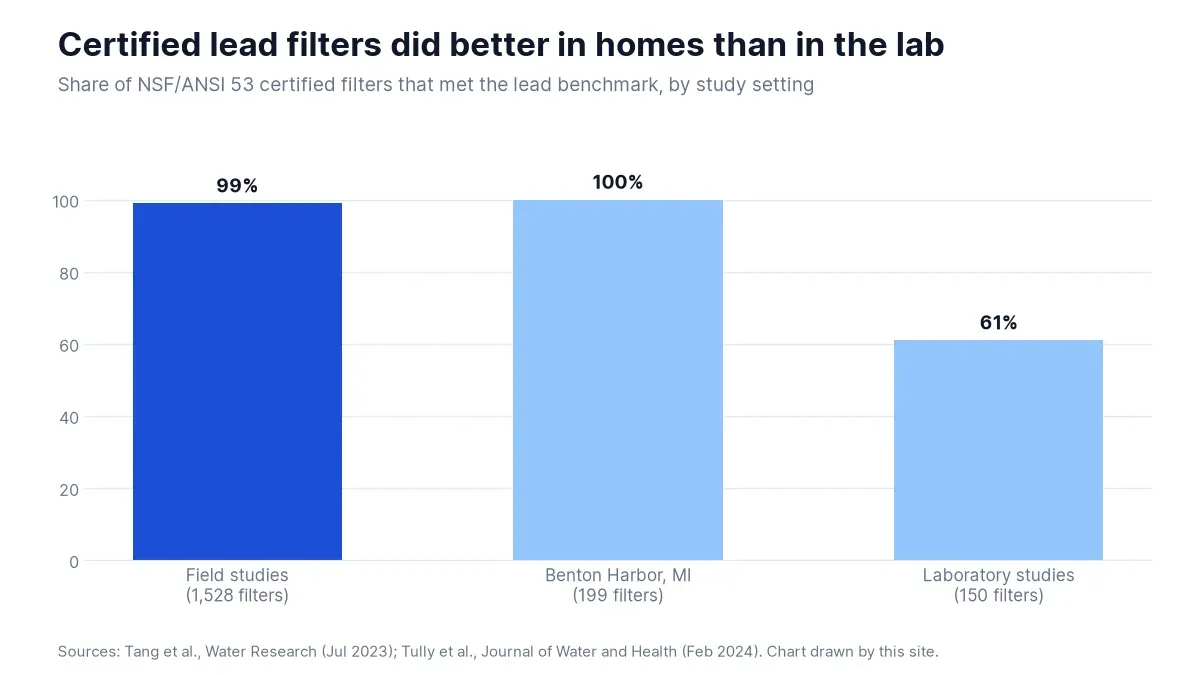 Figure 9: Certified filters met the lead benchmark in nearly every home test, and laboratory tests that went beyond certification conditions produced more failures. Source: Tang et al., Water Research, Jul 2023. Chart drawn by this site from the source data, captured 21 Oct 2026.
What do EPA and NSF say about lead filters?
- EPA’s consumer tool covers point-of-use and pitcher filters evaluated for lead reduction to 5 ppb or less and Class I particulate reduction under both NSF/ANSI 53 and 42 (EPA, Consumer Tool for Point-of-Use and Pitcher Filters Certified to Reduce Lead, Jun 2024).
- NSF/ANSI 58 lists 148 products from 36 manufacturers for lead reduction (NSF, Official Listings for lead reduction under NSF/ANSI 58, Oct 2026).
- EPA says to use a filter certified to remove lead, to replace the cartridge on schedule and never to run hot water through the filter (EPA, Basic Information about Lead in Drinking Water, Jun 2026).
How did filters perform in Flint and Benton Harbor?
- In 2016, researchers collected filtered and unfiltered samples at over 345 locations in Flint, Michigan (Bosscher et al., Journal of Environmental Science and Health, May 2019).
- Over 97% of filtered samples held lead below 0.5 micrograms per liter, and the highest filtered result was 2.9 (Bosscher et al., Journal of Environmental Science and Health, May 2019).
- Benton Harbor, Michigan, had six lead action level exceedances between 2018 and 2021 (Tully et al., Journal of Water and Health, Feb 2024).
- EPA tested 199 properly installed faucet and pitcher filters in homes between 9 November and 17 December 2021, and every one held lead below 5 ppb, with a maximum of 2.5 (Tully et al., Journal of Water and Health, Feb 2024).
Where do lead filters fail?
- A review of 23 studies covered 1,486 faucet-mounted, 25 under-the-sink and 167 pitcher filters (Tang et al., Water Research, Jul 2023).
- Laboratory filters were often tested beyond what they were certified to handle, and the NSF/ANSI 53 challenge water level is 150 micrograms per liter (Tang et al., Water Research, Jul 2023).
- In Louisiana homes known to have lead above 5 micrograms per liter at times, certified faucet filters always cut lead below 1 (Purchase et al., ACS ES&T Water, May 2025).
- In a test home with a disturbed lead service line, influent particulate lead ran from 9 to 3,053 micrograms per liter, and the filters did not consistently reach below 10 (Purchase et al., ACS ES&T Water, May 2025).
- In one Louisiana city, iron and manganese in the water clogged the filters before they reached half their rated capacity (Purchase et al., ACS ES&T Water, May 2025).
Can Home Filters Remove PFAS?
PFAS filters work, but when EPA wrote its rule the certification bar sat above the federal limit. A shop should sell what the label supports, say plainly what it does not, and check the current standard before quoting a level.
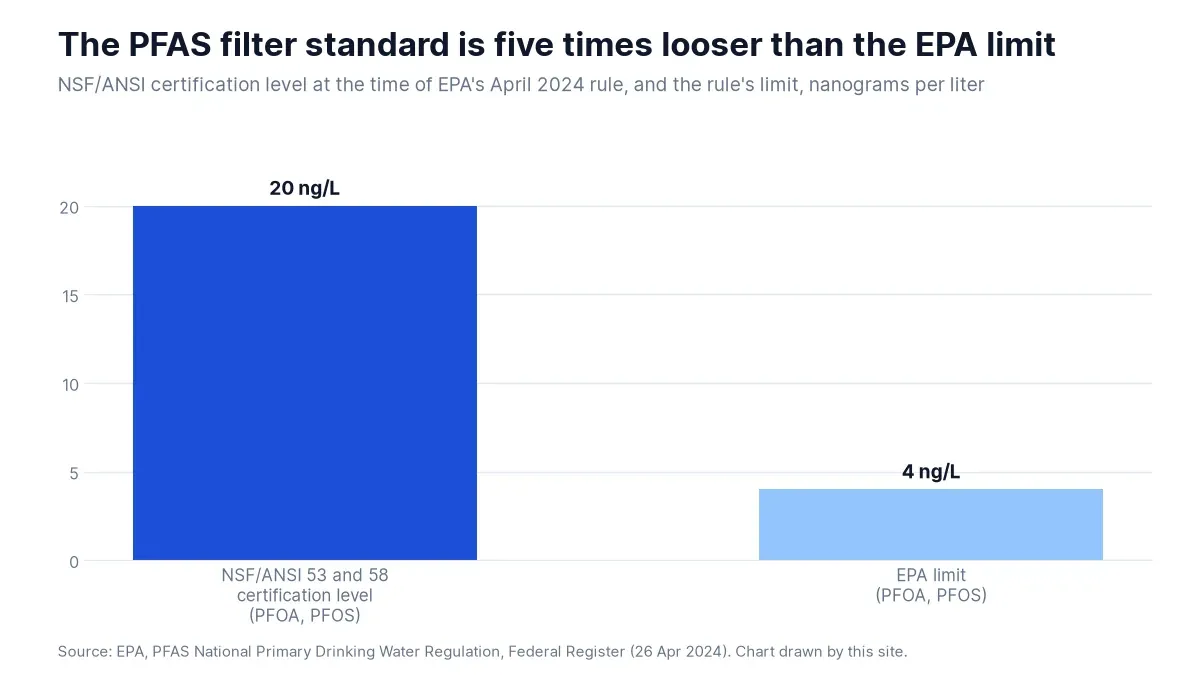 Figure 10: When EPA wrote its 2024 rule, filters could be certified at a level five times looser than the limit for PFOA and PFOS. Source: EPA, PFAS rule in the Federal Register, Apr 2024. Chart drawn by this site from the source data, captured 21 Oct 2026.
What do certified PFAS filters have to meet?
- For PFHxS, the certification level is 20 nanograms per liter against a limit of 10 (EPA, PFAS rule in the Federal Register, Apr 2024).
- The total PFAS certification level is 20 nanograms per liter of effluent, covering PFOA, PFOS, PFHxS, PFHxA and PFDA (EPA, PFAS rule in the Federal Register, Apr 2024).
- PFBS and HFPO-DA had no certification standard when the rule was written (EPA, PFAS rule in the Federal Register, Apr 2024).
- Five ANSI-accredited certification bodies evaluate filters for PFAS, and as of April 2024 their certifications focus on PFOA and PFOS (EPA, Reducing PFAS in Your Drinking Water with a Home Filter, Apr 2024).
- NSF lists 65 products from 11 manufacturers under NSF/ANSI 53 for PFOA and PFOS reduction (NSF, Official Listings for PFOA and PFOS reduction under NSF/ANSI 53, Oct 2026).
Which technologies does EPA say work?
- EPA names granular activated carbon, anion exchange, reverse osmosis and nanofiltration as the best available technologies for the regulated PFAS (EPA, PFAS rule in the Federal Register, Apr 2024).
- EPA says point-of-use reverse osmosis devices can reasonably be expected to remove the majority of PFAS when properly designed and maintained (EPA, PFAS rule in the Federal Register, Apr 2024).
- EPA says a filter may not be useful if PFAS have not been measured in your water or are below federal limits (EPA, Reducing PFAS in Your Drinking Water with a Home Filter, Apr 2024).
- EPA says showering, bathing and washing dishes in water with PFAS are unlikely to significantly raise risk, since little PFAS enters the body through skin (EPA, Meaningful and Achievable Steps to Reduce PFAS Risk, Jul 2026).
What did EPA’s bench test of home systems find?
- EPA tested three commercial reverse osmosis systems and two granular activated carbon media, and analyzed 188 PFAS samples (Patterson et al., AWWA Water Science, Mar 2019).
- The test water was held at pH 8.2, 500 mg/L total dissolved solids and 300 mg/L hardness to match the highest values seen in a Colorado aquifer (Patterson et al., AWWA Water Science, Mar 2019).
- All PFAS in the effluent of one reverse osmosis unit stayed below the detection limit for the whole test, and that unit’s recovery was about 28% (Patterson et al., AWWA Water Science, Mar 2019).
- Another reverse osmosis unit recovered about 44% of its feed water (Patterson et al., AWWA Water Science, Mar 2019).
- In a small-scale carbon column test, no PFAS showed up in the first hour, individual PFAS broke through from 1.5 hours and all were detected by 3.5 hours (Patterson et al., AWWA Water Science, Mar 2019).
- A representative whole-house carbon unit of 30 pounds (1 cubic foot), rated 4 gallons per minute and 150,000 gallons, would give only 2 minutes of contact time, against the 10 minutes vendors recommend (Patterson et al., AWWA Water Science, Mar 2019).
What Do Reverse Osmosis, Carbon and Other Filters Remove?
Each treatment type solves a different problem, and none solves all of them. The costly mistakes come from using a taste filter on a germ problem, or a germ filter on a chemical one.
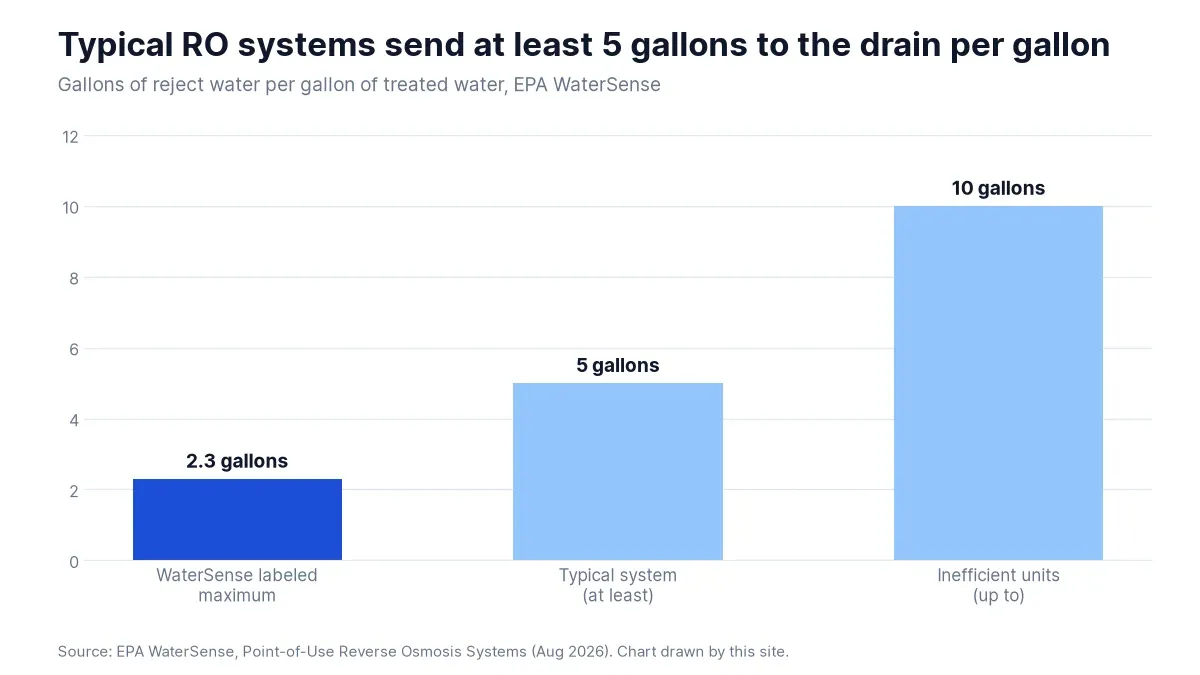 Figure 11: Reverse osmosis systems turn most of the feed water into reject water, and the WaterSense label caps the waste at 2.3 gallons per gallon treated. Source: EPA WaterSense, Point-of-Use Reverse Osmosis Systems, Aug 2026. Chart drawn by this site from the source data, captured 21 Oct 2026.
How much water does reverse osmosis waste?
- WaterSense labeled point-of-use reverse osmosis systems must send 2.3 gallons or less to the drain per gallon of treated water, while some inefficient units send up to 10 (EPA WaterSense, Point-of-Use Reverse Osmosis Systems, Aug 2026).
- Replacing a typical system with a labeled one saves more than 3,100 gallons a year, or 47,000 gallons over the life of the system (EPA WaterSense, Point-of-Use Reverse Osmosis Systems, Aug 2026).
- If every system sold in the United States were labeled, the savings would top 3.1 billion gallons a year, the annual water use of nearly 41,000 homes (EPA WaterSense, Point-of-Use Reverse Osmosis Systems, Aug 2026).
- Labeled systems must also show a membrane life of at least one year (EPA WaterSense, Point-of-Use Reverse Osmosis Systems, Aug 2026).
- A household reverse osmosis membrane makes about 10 to 35 gallons of treated water a day, and most household systems are designed for a 20% to 30% recovery rate (University of Nebraska-Lincoln Extension, NebGuide G1490, Sep 2014).
- Output falls 1% to 2% for every degree below 77 degrees Fahrenheit, so 45 degree well water yields about half as much (University of Nebraska-Lincoln Extension, NebGuide G1490, Sep 2014).
- The storage tank holds 2 to 5 gallons (University of Nebraska-Lincoln Extension, NebGuide G1490, Sep 2014).
What do pore sizes mean?
- CDC puts microfiltration at about 0.1 micron, ultrafiltration at about 0.01 micron and reverse osmosis at about 0.0001 micron (CDC, About Home Water Treatment Systems, Apr 2024).
- To remove parasites, CDC says to look for an absolute pore size of 1 micron or smaller, and for bacteria 0.3 micron or smaller (CDC, About Choosing Home Water Filters, Apr 2024).
- Most home filters, such as pitcher and refrigerator filters, are not designed to remove germs and typically use carbon to improve taste or remove heavy metals like lead (CDC, About Choosing Home Water Filters, Apr 2024).
- Reverse osmosis removes some chemicals, including lead, copper, chromium, chloride and sodium, and may also reduce arsenic, fluoride, nitrate and others (CDC, About Home Water Treatment Systems, Apr 2024).
What does activated carbon miss?
- Activated carbon filters do not remove bacteria, viruses, hardness minerals, fluoride or nitrate (University of Nebraska-Lincoln Extension, NebGuide G1489, Nov 2013).
- Tests cited by the guide found filter performance dropped significantly after 75% of the manufacturer’s recommended lifetime (University of Nebraska-Lincoln Extension, NebGuide G1489, Nov 2013).
- Carbon can reduce chlorine, chloramines and some disinfection byproducts, and EPA caps trihalomethanes at 80 parts per billion in treated water (University of Nebraska-Lincoln Extension, NebGuide G1489, Nov 2013).
- A whole-home filter that strips chlorine can let more germs grow in the plumbing (CDC, Preventing Waterborne Germs at Home, Mar 2024).
- Of nine popular pitcher filters tested, only two lowered fluoride, and none removed it completely, against the claims of three manufacturers (Hazzazi et al., Journal of Public Health Dentistry, Nov 2024).
- Seven of those nine pitchers lowered calcium in the tap water (Hazzazi et al., Journal of Public Health Dentistry, Nov 2024).
What Do Company Filings Say About the Water Treatment Market?
Filings give the only hard market numbers, and they describe a mature, dealer-driven business. Residential water treatment is a slice of bigger water companies, not an industry with its own census.
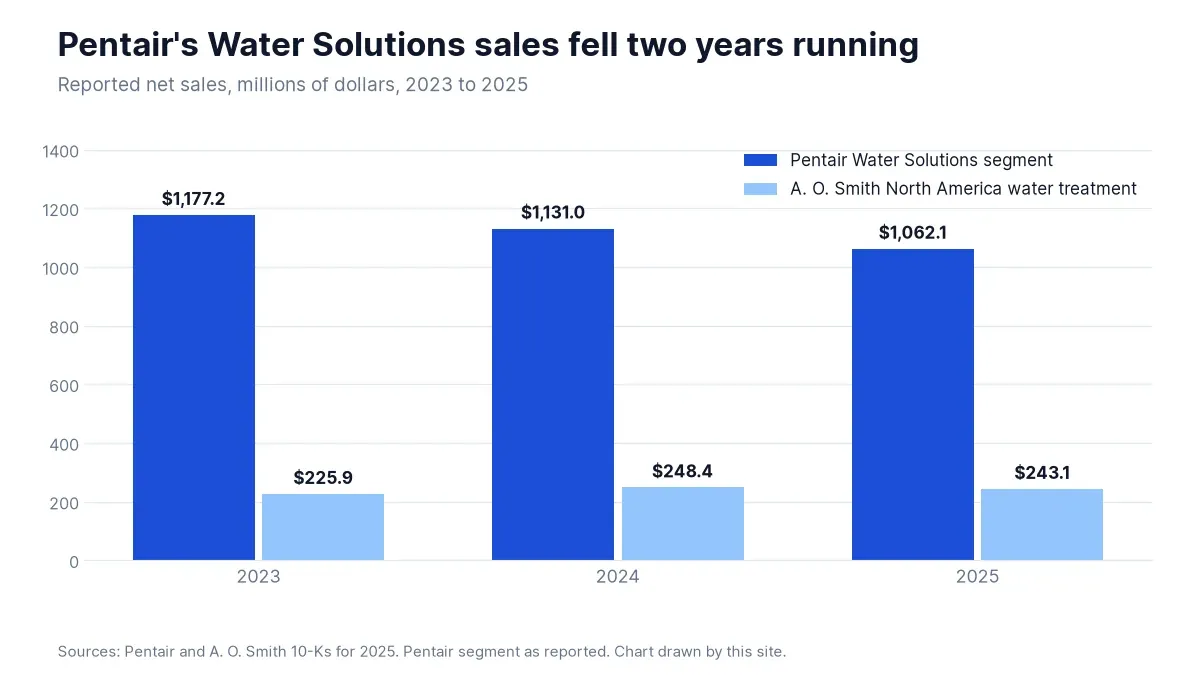 Figure 12: Pentair’s segment is much larger, includes commercial sales, and shrank each year, while A. O. Smith’s North America water treatment sales held roughly flat after a lower 2023. Source: Pentair, Form 10-K for 2025, Feb 2026. Chart drawn by this site from the source data, captured 21 Oct 2026.
How is Pentair’s Water Solutions segment doing?
- Segment net sales were $1,131.0 million in 2024 and $1,177.2 million in 2023 (Pentair, Form 10-K for 2025, Feb 2026).
- Segment income was $253.9 million in 2025, or 23.9% of net sales (Pentair, Form 10-K for 2025, Feb 2026).
- Water Solutions was about 25% of Pentair’s consolidated 2025 net sales (Pentair, Form 10-K for 2025, Feb 2026).
- About 34% of segment sales were residential, mainly point-of-entry and point-of-use filtration and softening systems, pressure tanks and control valves, and about 66% were commercial (Pentair, Form 10-K for 2025, Feb 2026).
- Pentair blamed the 2025 decline on lower volume and on business exits in the fourth quarter of 2024 and second quarter of 2025, partly offset by higher prices (Pentair, Form 10-K for 2025, Feb 2026).
- Segment brands include Pentair Water Solutions, Everpure, Fleck, Manitowoc Ice, Pentek and RainSoft (Pentair, Form 10-K for 2025, Feb 2026).
What does A. O. Smith report?
- North America water treatment product sales were $243.1 million in 2025, $248.4 million in 2024 and $225.9 million in 2023 (A. O. Smith, Form 10-K for 2025, Feb 2026).
- Its line runs from point-of-entry softeners and problem well water solutions to whole-home filtration and point-of-use carbon and reverse osmosis products (A. O. Smith, Form 10-K for 2025, Feb 2026).
- A. O. Smith branded products sell mainly through its water quality dealer network and Amazon, Aquasana sells direct to consumers online, and softener and well water brands sell through dealers and contractors (A. O. Smith, Form 10-K for 2025, Feb 2026).
- A portion of North America water treatment sales is replacement filters (A. O. Smith, Form 10-K for 2025, Feb 2026).
- It names Culligan, Kinetico, Pentair, Franklin Electric and EcoWater as its principal U.S. water treatment competitors (A. O. Smith, Form 10-K for 2025, Feb 2026).
- It bought a privately held water treatment company for $21.3 million net of cash in the first quarter of 2024 and Pureit from Unilever for $124.6 million in the fourth quarter (A. O. Smith, Form 10-K for 2025, Feb 2026).
What do other makers report?
- Watts says water quality products, which include point-of-use, point-of-entry and conditioning systems, were about 5% of total net sales in 2025, 2024 and 2023 (Watts Water Technologies, Form 10-K for 2025, Feb 2026).
- About 21% of Watts net sales in 2025 went through its specialty channel, which includes water filtration and conditioning products (Watts Water Technologies, Form 10-K for 2025, Feb 2026).
- Zurn Elkay says its filtered drinking water units include filters certified to NSF/ANSI 53 for lead, microplastics and PFAS (Zurn Elkay Water Solutions, Form 10-K for 2025, Feb 2026).
- Its 2025 Pro Filtration station offers up to 10,000 gallons of filtration capacity and a filter swap in under 30 seconds (Zurn Elkay Water Solutions, Form 10-K for 2025, Feb 2026).
- Whirlpool sold its Latin America water filtration subscription business for about $52 million and booked a gain of about $34 million when the sale closed on Jul 1, 2024 (Whirlpool, Form 10-K for 2025, Feb 2026).
- Clorox sells Brita water-filtration products in its Lifestyle segment in the United States and in its International segment (Clorox, Form 10-K for fiscal 2026, Aug 2026).
Have filters been recalled?
- In 1997, Ecodyne recalled about 14,000 Sears water filter cartridges because an incorrect carbon could contain nickel chloride, which releases nickel into the water (CPSC, Sears Water Filter Cartridges Recall, Mar 1997).
- In 2014, Brita recalled about 242,500 children’s filter bottles because the lid could break into pieces with sharp points (CPSC, BRITA Recalls Children’s Water Bottles, Aug 2014).
What Does Installing Water Treatment Involve for a Plumbing Shop?
Installs are priced across a very wide range, and every unit needs service on a schedule. Those two facts shape how a shop should quote.
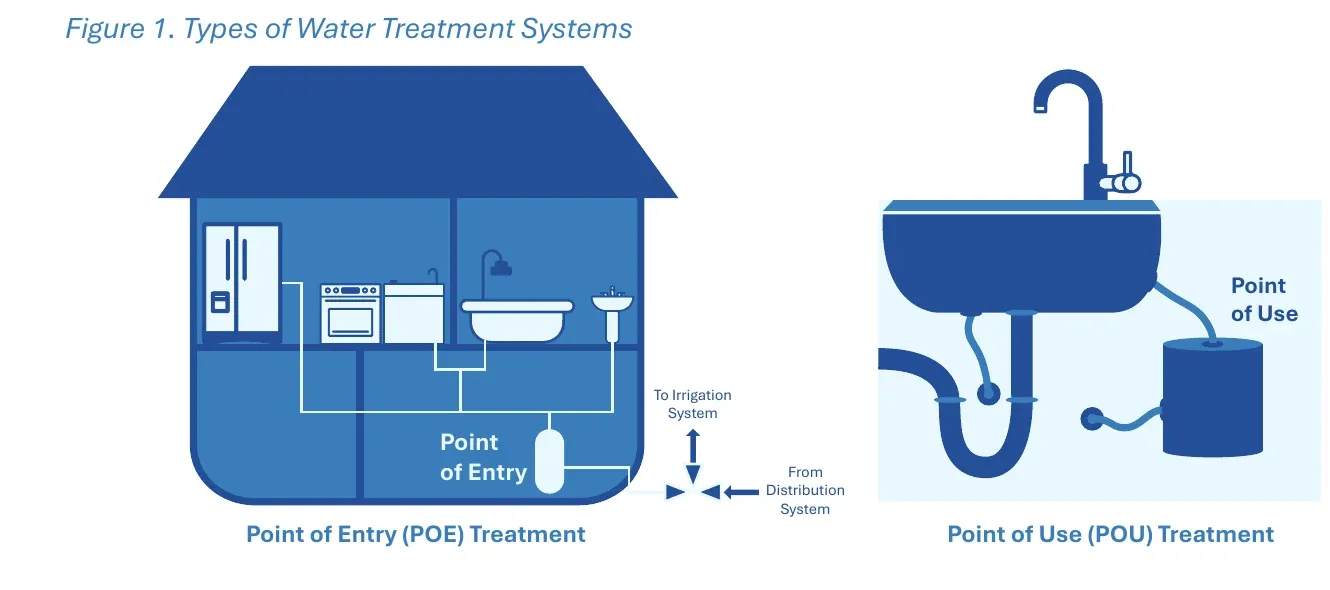 Figure 13: Point-of-entry units treat every tap from the service line, while point-of-use units treat one tap. Source: EPA WaterSense, Guide to Selecting Water Treatment Systems, Nov 2024. Chart published by the source, captured 21 Oct 2026.
What do installs cost and involve?
- Basic pitchers and tap filters typically cost less than $100 and need no installation, while distillation and reverse osmosis systems tend to cost a few hundred dollars and may need professional installation (EPA WaterSense, Guide to Selecting Water Treatment Systems, Nov 2024).
- Whole-house point-of-entry systems generally cost several thousand dollars and may require plumbing alterations and professional maintenance (EPA WaterSense, Guide to Selecting Water Treatment Systems, Nov 2024).
- Minnesota’s health department says prices run from under twenty dollars to thousands of dollars (Minnesota Department of Health, Home Water Treatment Facts, Aug 2024).
- WaterSense says to install a softener on the supply line before water reaches the water heater, and after any whole-house filter (EPA WaterSense, Soften Water Without Wasting It guide, May 2026).
- It also says to branch off the line before the outdoor hose bibb or irrigation line where possible, and to use the softener’s bypass valve for outdoor water (EPA WaterSense, Soften Water Without Wasting It guide, May 2026).
- EPA’s test found larger carbon tanks, or two in series, need extra plumbing and drainage lines for backwash wastewater, and swapping contaminated carbon is labor-intensive (Patterson et al., AWWA Water Science, Mar 2019).
- Minnesota’s health department tells buyers to hire a licensed plumber or licensed water conditioning contractor (Minnesota Department of Health, Home Water Treatment Facts, Aug 2024).
What does service look like after the install?
- WaterSense says to check the softener salt every 4 to 6 weeks, keep the tank about half full and never let it fall below one quarter (EPA WaterSense, Soften Water Without Wasting It guide, May 2026).
- It says the resin beads need cleaning every year to hold efficiency (EPA WaterSense, Soften Water Without Wasting It guide, May 2026).
- The University of Minnesota Water Resources Center says to check salt monthly, clean the tank every 5 to 10 years and have a professional check a softener every two to five years (University of Minnesota Water Resources Center, Residential softening, Oct 2026).
- NSF says most filtration systems have service cycles set in gallons or months, and filters should be replaced on the manufacturer’s schedule (NSF, Changing Water Filters, Oct 2026).
- CDC says germs can grow and multiply in water filters that are not maintained, and tells people to maintain and replace pitcher, refrigerator, under-sink and showerhead filters on the manufacturer’s schedule (CDC, Preventing Waterborne Germs at Home, Mar 2024).
- Minnesota’s health department says units that are not properly maintained lose effectiveness and can make water quality worse (Minnesota Department of Health, Home Water Treatment Facts, Aug 2024).
Which sales claims draw complaints?
- Minnesota’s health department reported more complaints about deceptive water treatment sales after high-profile groundwater contamination investigations (Minnesota Department of Health, Beware of Water Treatment Scams, Dec 2022).
- It warns of “tests” that claim to show contamination when they may only show naturally occurring minerals (Minnesota Department of Health, Beware of Water Treatment Scams, Dec 2022).
- It lists claims that a treatment unit is maintenance-free among the red flags (Minnesota Department of Health, Beware of Water Treatment Scams, Dec 2022).
- It notes that close to 100 percent of Minnesota community water suppliers meet EPA’s maximum contaminant levels (Minnesota Department of Health, Beware of Water Treatment Scams, Dec 2022).
Glossary
- AHS: American Housing Survey, run by the Census Bureau for HUD.
- BAT: Best available technology, the treatment methods EPA names for a regulated contaminant.
- DIR: Demand-initiated regeneration, where a meter or sensor starts a softener cycle instead of a timer.
- GAC: Granular activated carbon, a filter medium that adsorbs chemicals.
- Grain per gallon (gpg): A unit of hardness. USGS and WaterSense tie 120 mg/L to about 7 gpg.
- mg/L, ng/L, ug/L, ppb, ppm: Milligrams, nanograms and micrograms per liter. One ppm equals 1 mg/L and one ppb equals 1 ug/L.
- MCL: Maximum contaminant level, the enforceable limit for a contaminant in public drinking water.
- NSF/ANSI: Voluntary standards for drinking water treatment products, written by NSF and approved by the American National Standards Institute.
- PFAS, PFOA, PFOS: Per- and polyfluoroalkyl substances, a group of man-made chemicals, including the two most studied, PFOA and PFOS.
- POE and POU: Point-of-entry (whole house) and point-of-use (one tap) treatment.
- RO: Reverse osmosis, a membrane process that sends contaminants to a reject stream.
- TDS: Total dissolved solids.
- TMDL: Total maximum daily load, a cap on a pollutant that a water body can take.
- WWTP: Wastewater treatment plant.
- WQA: Water Quality Association, a trade group for the water treatment industry.
Methodology and Sources
Each figure comes from the agency, company, peer reviewed journal or standards body that produced it, and each link points to the page, file or filing itself. Counts that no agency publishes were calculated from the source file and marked as calculated by this site: the American Housing Survey 2015 tabulations use the Census Bureau’s household weights, and the NSF counts are the “number of matching products” lines on NSF’s official listing pages, current as of 21 October 2026. The Census Bureau asked where households get drinking water only in its 2015 survey, and the item booklets for 2017 through 2023 do not carry the question. Minnesota and Wisconsin numbers describe those states, the Minnesota softening share is a survey of industry professionals and not of households, and the Louisiana, New Hampshire, SOFTER and Arizona studies are small. Company figures are as reported in annual filings and cover segments that include more than home water treatment. The page is refreshed monthly.
Sources
- A. O. Smith, Form 10-K for 2025, Feb 2026
- Bakshi et al., PLOS ONE, Feb 2021
- Bosscher et al., Journal of Environmental Science and Health, May 2019
- California Legislature, Health and Safety Code 116775, Jan 2000
- California Legislature, Health and Safety Code 116785, Jan 2000
- California Legislature, Health and Safety Code 116786, Jan 2004
- California Legislature, Health and Safety Code 116787, Jan 2022
- CDC, About Choosing Home Water Filters, Apr 2024
- CDC, About Home Water Treatment Systems, Apr 2024
- CDC, Preventing Waterborne Germs at Home, Mar 2024
- Census Bureau, 2015 AHS Items Booklet, Nov 2016
- Census Bureau, American Housing Survey 2015 national public use file, Nov 2020
- Clorox, Form 10-K for fiscal 2026, Aug 2026
- CPSC, BRITA Recalls Children’s Water Bottles, Aug 2014
- CPSC, Sears Water Filter Cartridges Recall, Mar 1997
- EPA WaterSense, Cation Exchange Water Softeners, May 2026
- EPA WaterSense, Guide to Selecting Water Treatment Systems, Nov 2024
- EPA WaterSense, Point-of-Use Reverse Osmosis Systems, Aug 2026
- EPA WaterSense, Soften Water Without Wasting It guide, May 2026
- EPA WaterSense, Water-Efficient Home Water Softeners fact sheet, May 2026
- EPA, Aquatic Life Criteria Table, Jun 2026
- EPA, Basic Information about Lead in Drinking Water, Jun 2026
- EPA, Consumer Tool for Point-of-Use and Pitcher Filters Certified to Reduce Lead, Jun 2024
- EPA, Exposure Factors Handbook Chapter 3 update, Feb 2019
- EPA, Meaningful and Achievable Steps to Reduce PFAS Risk, Jul 2026
- EPA, PFAS rule in the Federal Register, Apr 2024
- EPA, Protect Your Home’s Water, Feb 2026
- EPA, Reducing PFAS in Your Drinking Water with a Home Filter, Apr 2024
- EPA, Secondary Drinking Water Standards, May 2026
- Ezzamouri et al., Clinical and Experimental Allergy, Dec 2022
- Hazzazi et al., Journal of Public Health Dentistry, Nov 2024
- Jabbar-Lopez et al., SOFTER trial, Dec 2021
- Los Angeles County Sanitation Districts, Santa Clarita Valley Chloride Control, Oct 2026
- Lothrop et al., Water, Mar 2015
- Malecki et al., Science of the Total Environment, Jun 2017
- Minnesota Department of Health, Beware of Water Treatment Scams, Dec 2022
- Minnesota Department of Health, Home Water Treatment Facts, Aug 2024
- MPCA, Chloride, Oct 2026
- NSF, Changing Water Filters, Oct 2026
- NSF, Home Water Treatment, Oct 2026
- NSF, Official Listings for lead reduction under NSF/ANSI 53, Oct 2026
- NSF, Official Listings for lead reduction under NSF/ANSI 58, Oct 2026
- NSF, Official Listings for NSF/ANSI 177, Oct 2026
- NSF, Official Listings for NSF/ANSI 401, Oct 2026
- NSF, Official Listings for NSF/ANSI 42, Oct 2026
- NSF, Official Listings for NSF/ANSI 44, Oct 2026
- NSF, Official Listings for NSF/ANSI 53, Oct 2026
- NSF, Official Listings for NSF/ANSI 55, Oct 2026
- NSF, Official Listings for NSF/ANSI 58, Oct 2026
- NSF, Official Listings for PFOA and PFOS reduction under NSF/ANSI 53, Oct 2026
- NSF, Standards for Water Treatment Systems, Oct 2026
- Overbo et al., Science of the Total Environment, Apr 2021
- Patterson et al., AWWA Water Science, Mar 2019
- Pentair, Form 10-K for 2025, Feb 2026
- Purchase et al., ACS ES&T Water, May 2025
- Tang et al., Water Research, Jul 2023
- Tully et al., Journal of Water and Health, Feb 2024
- University of Minnesota Water Resources Center and MPCA, Chloride Contributions report, Jan 2019
- University of Minnesota Water Resources Center, Residential softening, Oct 2026
- University of Minnesota Water Resources Center, Water softening, Oct 2026
- University of Nebraska-Lincoln Extension, NebGuide G1489, Nov 2013
- University of Nebraska-Lincoln Extension, NebGuide G1490, Sep 2014
- University of Nebraska-Lincoln Extension, NebGuide G1491, Sep 2014
- USGS, Hardness of Water, Aug 2026
- Water Quality Association, Water Softeners and Septic Systems, Oct 2026
- Watts Water Technologies, Form 10-K for 2025, Feb 2026
- Whirlpool, Form 10-K for 2025, Feb 2026
- Zurn Elkay Water Solutions, Form 10-K for 2025, Feb 2026