Water damage statistics show a problem that is common, quiet and mostly about plumbing. A pipe weeps, a hose splits, a water heater gives out, and a few weeks later the floor is soft. This page collects the numbers on how often that happens in homes, what causes it, what it costs and what stops it.
The data comes from the Census Bureau’s American Housing Survey, building-science research from the Insurance Institute for Business & Home Safety, the World Health Organization, peer-reviewed health studies, Eurostat, the English Housing Survey and two large homeowner surveys. Most figures are for US homes. A few come from Europe, where the same question has been asked for years.
This page stays on home water damage: causes, cost per job and prevention. Insurance claims have their own page, water damage claims, and the dryout trade is covered in the restoration industry numbers. Leak volumes and water waste are on the water leak page, and water heater failures are on the water heater page. For the shops that fix the pipes, see plumbing industry numbers and plumber workforce numbers.
Key Takeaways
- Renters reported mold in 5.0% of homes and owners in 1.8%, using the published counts and group totals (Census Bureau, Sep 2024).
- Leaking pipes were the top named inside cause, reported in 4.86 million homes (Census Bureau, Sep 2024).
- Renters reported inside leaks in 10.5% of homes and owners in 7.3%, using the published counts and group totals (Census Bureau, Sep 2024).
- Homes built in 1939 or earlier reported inside leaks in 10.3% of cases, against 2.5% for homes built in 2020 and 2021 (Census Bureau, Sep 2024).
- When wind-driven rain got in through a damaged roof cover, total losses were 4 to 7 times the cost of the roof cover alone in a 2020 derecho claims sample (IBHS, Dec 2024).
- The average lifespan of a washing machine is 12.6 years and of a dishwasher 12 years, and both connect to the house through supply hoses (IBHS, Dec 2024).
- 66% of US homeowners in a survey of more than 2,000 had a plumbing issue in summer (Hippo, Jul 2024).
- Owners reported 3.6 million interior water pipe projects in the two years before the 2023 survey, and professionals did 2.3 million of them (Census Bureau, Sep 2024).
- 59% of homeowners do not turn off the water supply before going on vacation (Travelers, Nov 2019).
- Sealing the roof deck the IBHS FORTIFIED way mitigates at least 70% of potential water entry on average (IBHS, Dec 2024).
- Homes with an inside leak reported mold 11.6% of the time, against 2.1% for homes without one, in our tabulation of the 2023 public use file (Census Bureau, Sep 2024).
- If the studies are causal, 21% of US asthma cases are attributable to dampness and mold at home, at a cost of $3.5 billion a year (Mudarri and Fisk, Indoor Air, Jun 2007).
- The WHO estimates that indoor dampness affects 10 to 50% of indoor environments in Europe, North America, Australia, India and Japan (World Health Organization, Oct 2009).
- 15.6% of people in the EU lived in a dwelling with a leaking roof, damp walls, floors or foundation, or rot in window frames or floor in 2023 (Eurostat, Apr 2026).
How Common Is Water Leakage in US Homes?
Leaks come from two directions. Inside leaks come from pipes, fixtures and appliances. Outside leaks come through the roof, the basement and the walls. The Census Bureau asks about both every two years, which makes it the best long-run count for the US.
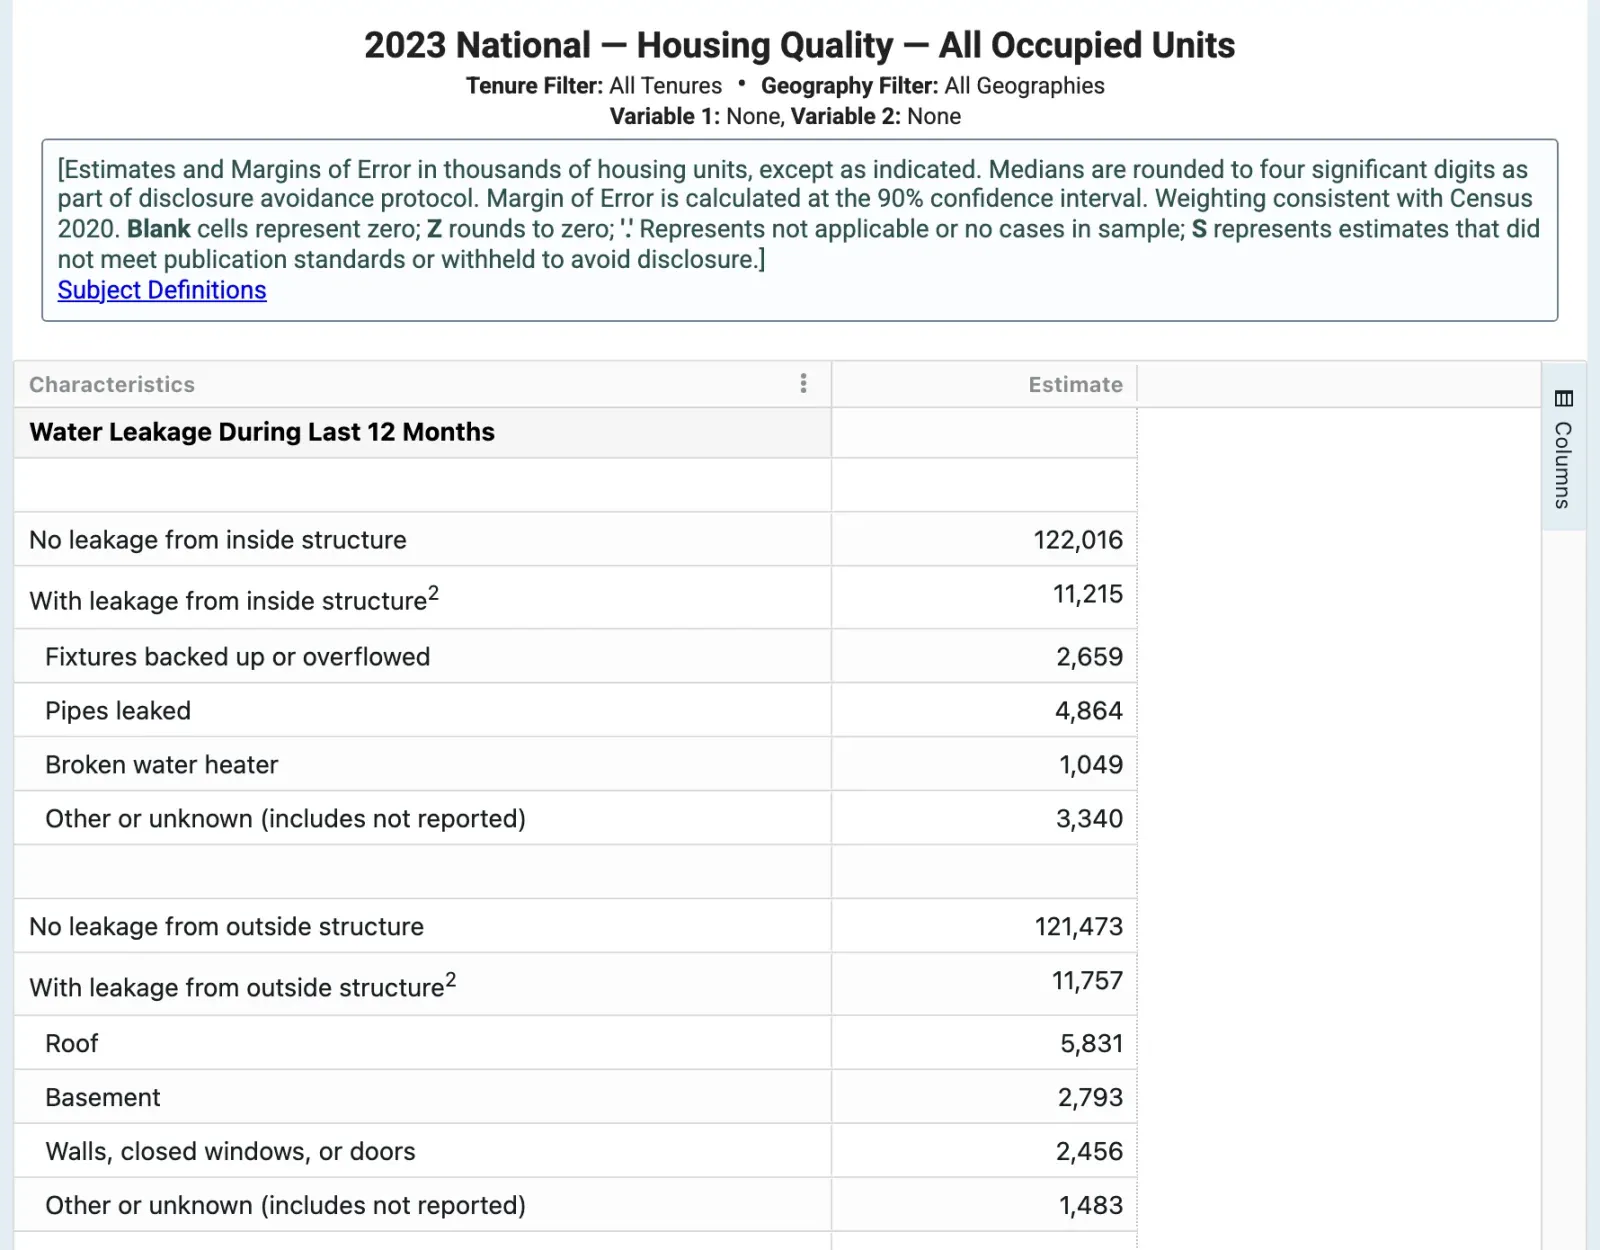 Figure 1: The Census Bureau’s 2023 survey asked households about leaks from inside and from outside the structure, and pipes were the biggest named cause inside while roofs led outside. Source: Census Bureau, American Housing Survey Table Creator, 2023 Housing Quality table, Sep 2024. Screenshot of the source page, captured 21 Oct 2026.
How many homes leak from the outside in?
The roof is the main entry point, ahead of the basement and the walls.
- Roofs were the named source in 5.83 million of those homes (Census Bureau, Sep 2024).
- Basements were named in 2.79 million homes and walls, closed windows or doors in 2.46 million (Census Bureau, Sep 2024).
Is leakage becoming more common?
Slowly. The inside-leak count held near 10 million for most of a decade and then rose in 2023.
- The 2015 survey counted 10.0 million homes with inside leakage (Census Bureau, Apr 2018).
- The 2017 survey counted 9.95 million (Census Bureau, Jan 2019).
- The 2019 survey counted 9.44 million (Census Bureau, Sep 2020).
- The 2021 survey counted 10.47 million (Census Bureau, Sep 2022).
- Leaking pipes were named in 3.99 million homes in 2019 (Census Bureau, Sep 2020).
- They were named in 4.44 million homes in 2021 (Census Bureau, Sep 2022).
- Two decades ago the 2003 survey put water damage from interior leakage at 8% of US homes and from exterior leakage at 10.4% (Mudarri and Fisk, Indoor Air, Jun 2007).
What do homeowners say about water trouble?
Owner surveys point the same way. Water and plumbing sit near the top of the list of things that go wrong.
- Water damage was the second most common type of damage among responding homeowners in 2023, affecting 23% of them (Hippo, Dec 2023).
- 83% of homeowners faced unexpected repairs in 2024, up from 46% in 2023, and water damage was one of the three most common problem areas (Hippo, Jan 2025).
- In 2025 the top three problems were plumbing issues, appliance breakdowns and critical system failures (Hippo, Jan 2026).
- Even so, 70% of homeowners said they had no significant home-related issues in 2025, against 34% in 2024 (Hippo, Jan 2026).
- Non-weather water incidents caused 23% of home damage in Travelers property claims from July 2016 through December 2020 (Travelers, Dec 2020).
Who Reports More Leaks, Owners or Renters?
Renters report more leaks from inside the building and owners report more from outside. The first is a plumbing story and the second is a roof and basement story. The shares below divide the Census counts by the published total for each group.
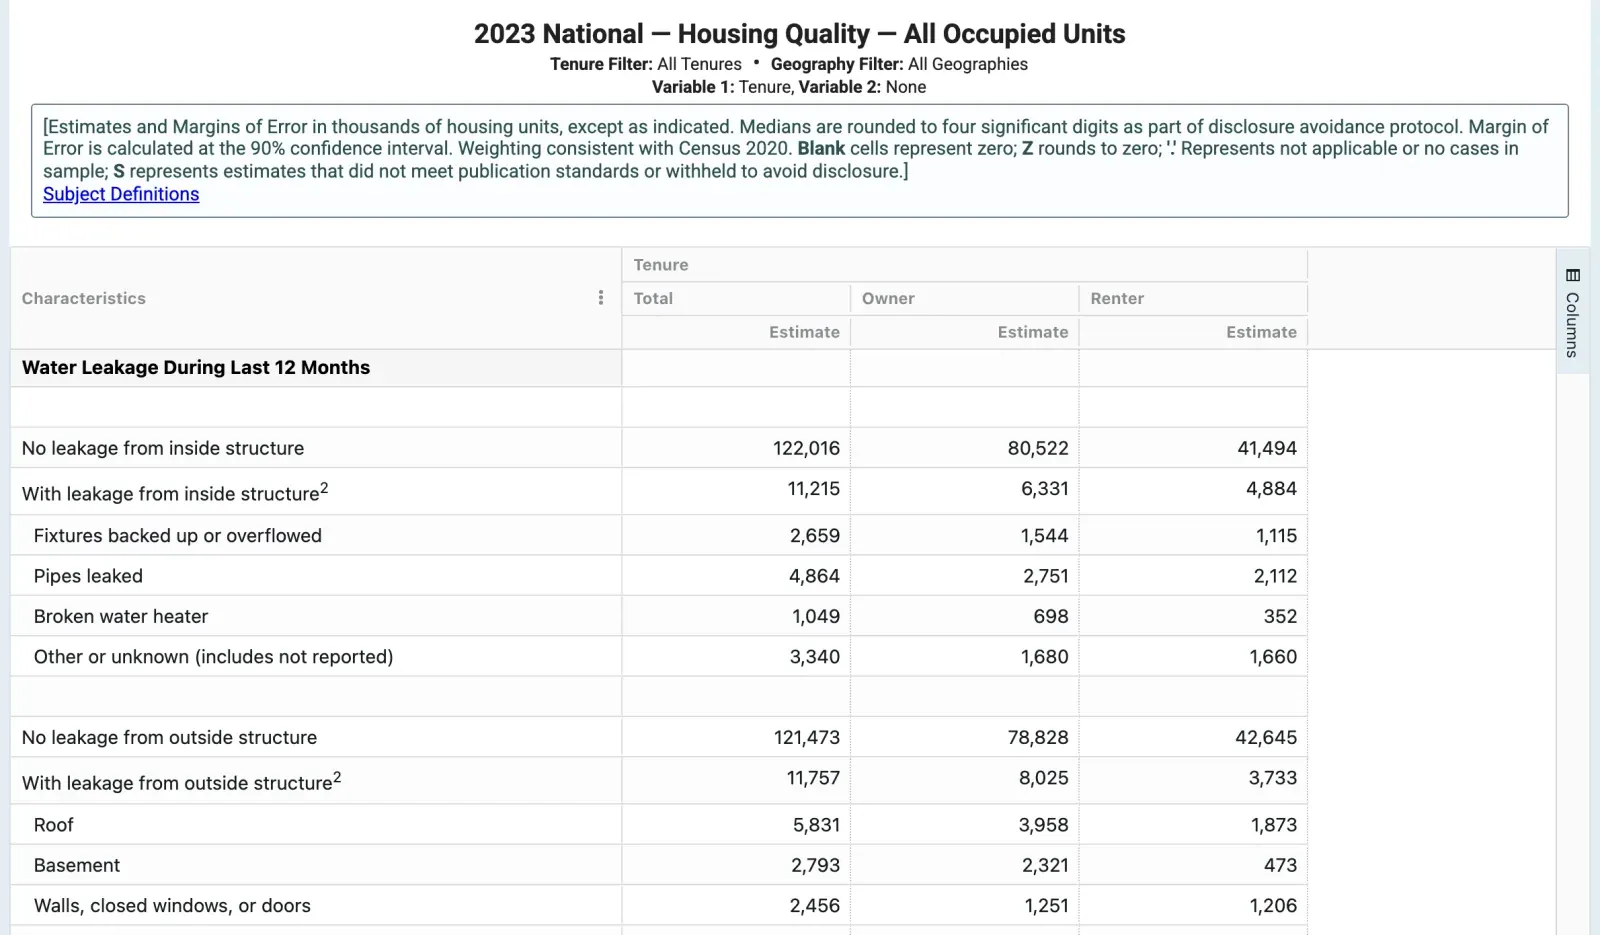 Figure 2: The same Census table split by tenure shows 6.3 million owner homes and 4.9 million renter homes with inside leaks, and the cause rows show where the two groups differ. Source: Census Bureau, American Housing Survey Table Creator, 2023 Housing Quality table by tenure, Sep 2024. Screenshot of the source page, captured 21 Oct 2026.
Do renters or owners see more pipe and fixture trouble?
- Leaking pipes were reported in 4.6% of renter homes and 3.2% of owner homes (Census Bureau, Sep 2024).
- Fixtures that backed up or overflowed hit 2.4% of renter homes and 1.8% of owner homes (Census Bureau, Sep 2024).
- Broken water heaters were reported in 0.8% of homes in both groups (Census Bureau, Sep 2024).
- Outside leaks were reported in 9.2% of owner homes and 8.0% of renter homes (Census Bureau, Sep 2024).
Does the age of a home change the odds?
Yes, and by a wide margin. Newer homes leak less, from inside and out.
- Inside leaks were reported in 6.5% of homes built in 2010 to 2014 (Census Bureau, Sep 2024).
- The rate was 4.3% for homes built in 2015 to 2019 (Census Bureau, Sep 2024).
- Outside leaks were reported in 14.9% of homes built in 1939 or earlier, against 5.1% of homes built in 2010 to 2014 (Census Bureau, Sep 2024).
Which building types leak most?
- Buildings with 5 to 9 units reported inside leaks in 12.1% of homes (Census Bureau, Sep 2024).
- Detached single-family houses reported them in 7.2% of homes (Census Bureau, Sep 2024).
- Manufactured homes reported inside leaks in 10.7% of homes and outside leaks in 11.2% (Census Bureau, Sep 2024).
Does the region matter?
A little. The gap between the highest and lowest division is about two points.
- The Middle Atlantic division reported inside leaks in 9.6% of homes and the Pacific division in 7.6% (Census Bureau, Sep 2024).
- Leaking pipes ran highest in the East South Central division at 4.3% and lowest in the West North Central division at 3.0% (Census Bureau, Sep 2024).
Why Do Newer Homes Have More Places to Leak?
Newer homes leak less often, but they hold more plumbing. The insurance industry’s building-science group says the trend toward larger, taller and bath-heavy houses adds points of failure and adds material to replace when one fails.
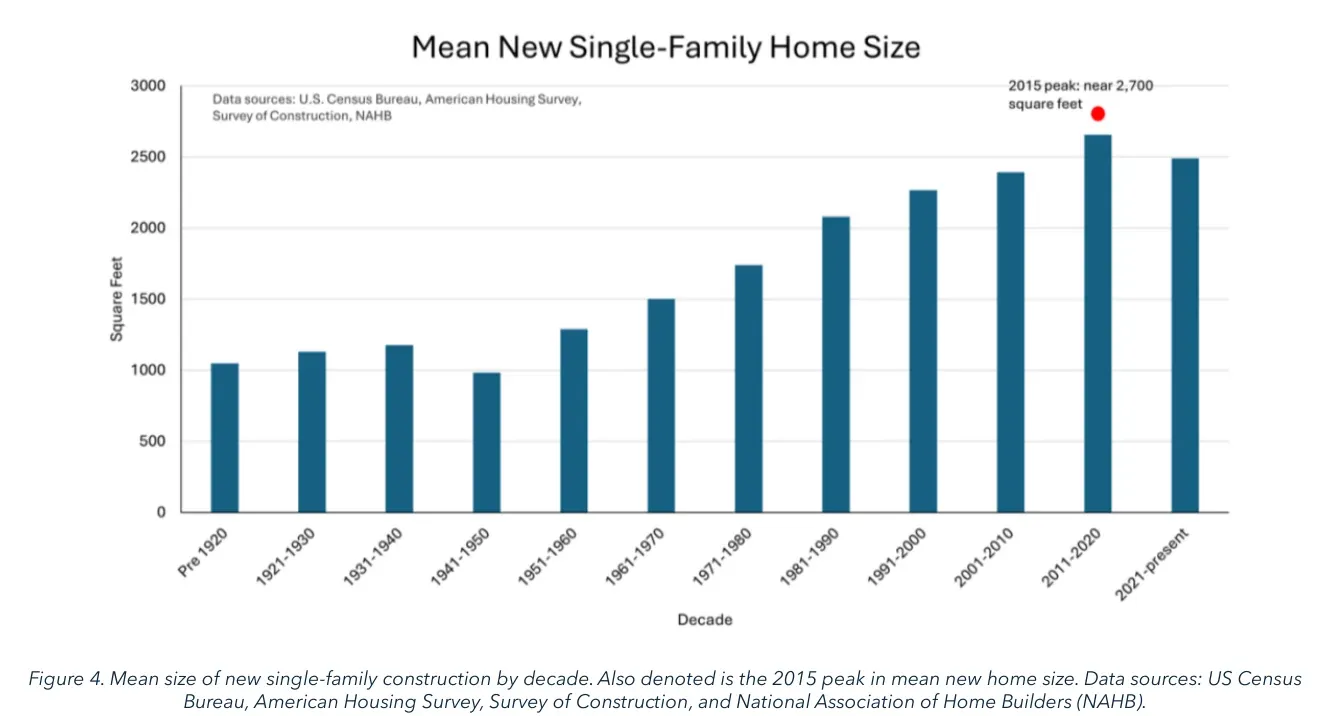 Figure 3: Mean new single-family home size climbed from about 1,000 square feet before 1920 to a peak near 2,700 in 2015, and a larger house means more floor and drywall to replace after a leak. Source: IBHS, State of the Risk: Interior Water Damage, Figure 4, Dec 2024. Chart published by the source, captured 21 Oct 2026.
Are homes getting bigger and more complex?
- The median home was about 1,500 square feet in 1980 and nearly 2,500 by 2015 (IBHS, Dec 2024).
- Mean new single-family home size peaked near 2,700 square feet in 2014 and 2015 (IBHS, Dec 2024).
- The share of new homes with three or more full bathrooms rose by 10% from 2005 (IBHS, Dec 2024).
- In 2021, new homes with no half bathrooms passed 50% of construction for the first time (IBHS, Dec 2024).
Do extra stories raise the risk?
- Single-story homes were 63% of new homes in 1975, and two-story or taller homes have been over 50% of new construction since 1990 (IBHS, Dec 2024).
- IBHS members say multi-story homes often have higher interior water damage claim frequency and severity (IBHS, Dec 2024).
- Hot water heaters and laundry rooms above the first floor were flagged as a concern tied to shorter appliance lifespans (IBHS, Dec 2024).
What do installers get wrong?
- Common installation problems include drywall fasteners driven into plumbing lines (IBHS, Dec 2024).
- Non-weather interior water loss cost has risen since 2014, according to a LexisNexis report cited by IBHS (IBHS, Dec 2024).
Why Do Hoses, Valves and Pumps Fail?
Parts with water on them wear out before the machine does. Most appliances connect to the house through flexible hoses and gasketed fittings, and the rubber ages. IBHS lists normal wear, damage during moves, high pressure, heat and water quality as the causes.
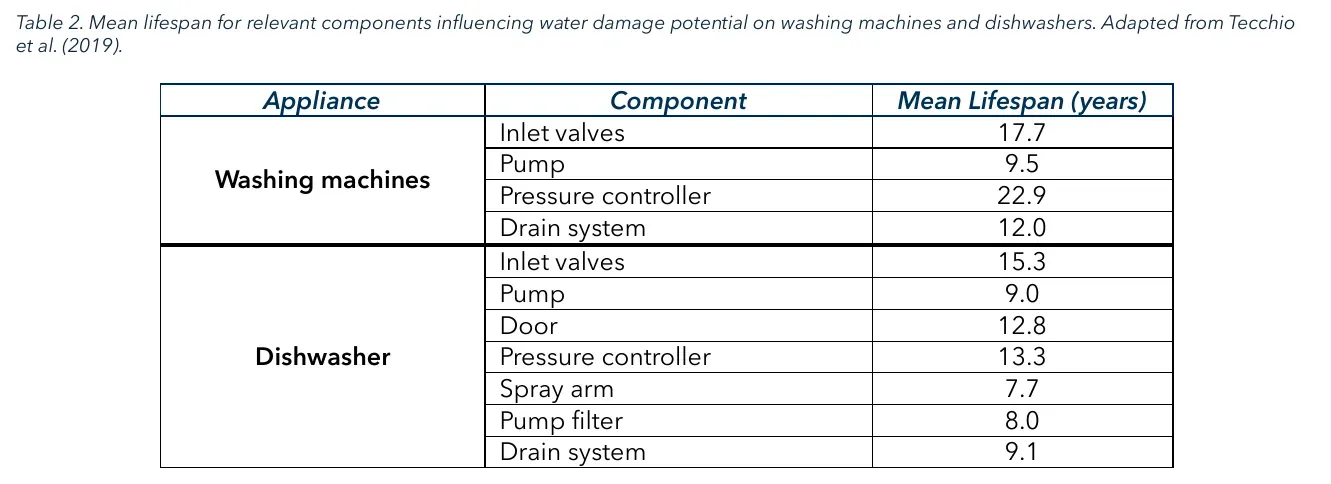 Figure 4: Mean lifespans of washing machine and dishwasher parts run from 7.7 years for a dishwasher spray arm to 22.9 years for a washing machine pressure controller, so a 12-year-old machine has several parts past their average life. Source: IBHS, State of the Risk: Interior Water Damage, Table 2, adapted from Tecchio et al. 2019, Dec 2024. Screenshot of the source page, captured 21 Oct 2026.
How long do the water-fed parts last?
- Washing machine inlet valves last 17.7 years on average and the pump 9.5 years (IBHS, Dec 2024).
- The washing machine drain system lasts 12.0 years and the pressure controller 22.9 years (IBHS, Dec 2024).
- Dishwasher inlet valves last 15.3 years and the pump 9.0 years (IBHS, Dec 2024).
- The dishwasher spray arm lasts 7.7 years, the pump filter 8.0 years and the drain system 9.1 years (IBHS, Dec 2024).
What do owners skip that makes it worse?
- Clogged plumbing drains were the most commonly cited maintenance failure behind interior water loss, and clogged gutters were second (IBHS, Dec 2024).
- During the 2021 arctic outbreak in Texas and Louisiana, many homeowners did not know how to turn off the main water supply after a pipe burst (IBHS, Dec 2024).
- 70% of homeowners report leaving home with the dishwasher running (Travelers, Nov 2022).
- A broken water heater was the named source of inside leakage in 1.05 million homes (Census Bureau, Sep 2024).
How Much Extra Damage Do Roofs and Storms Add?
Rain is the other half of the story, and it turns a small roof fault into a gutted room. The US data and the English data agree that the roof is where it starts.
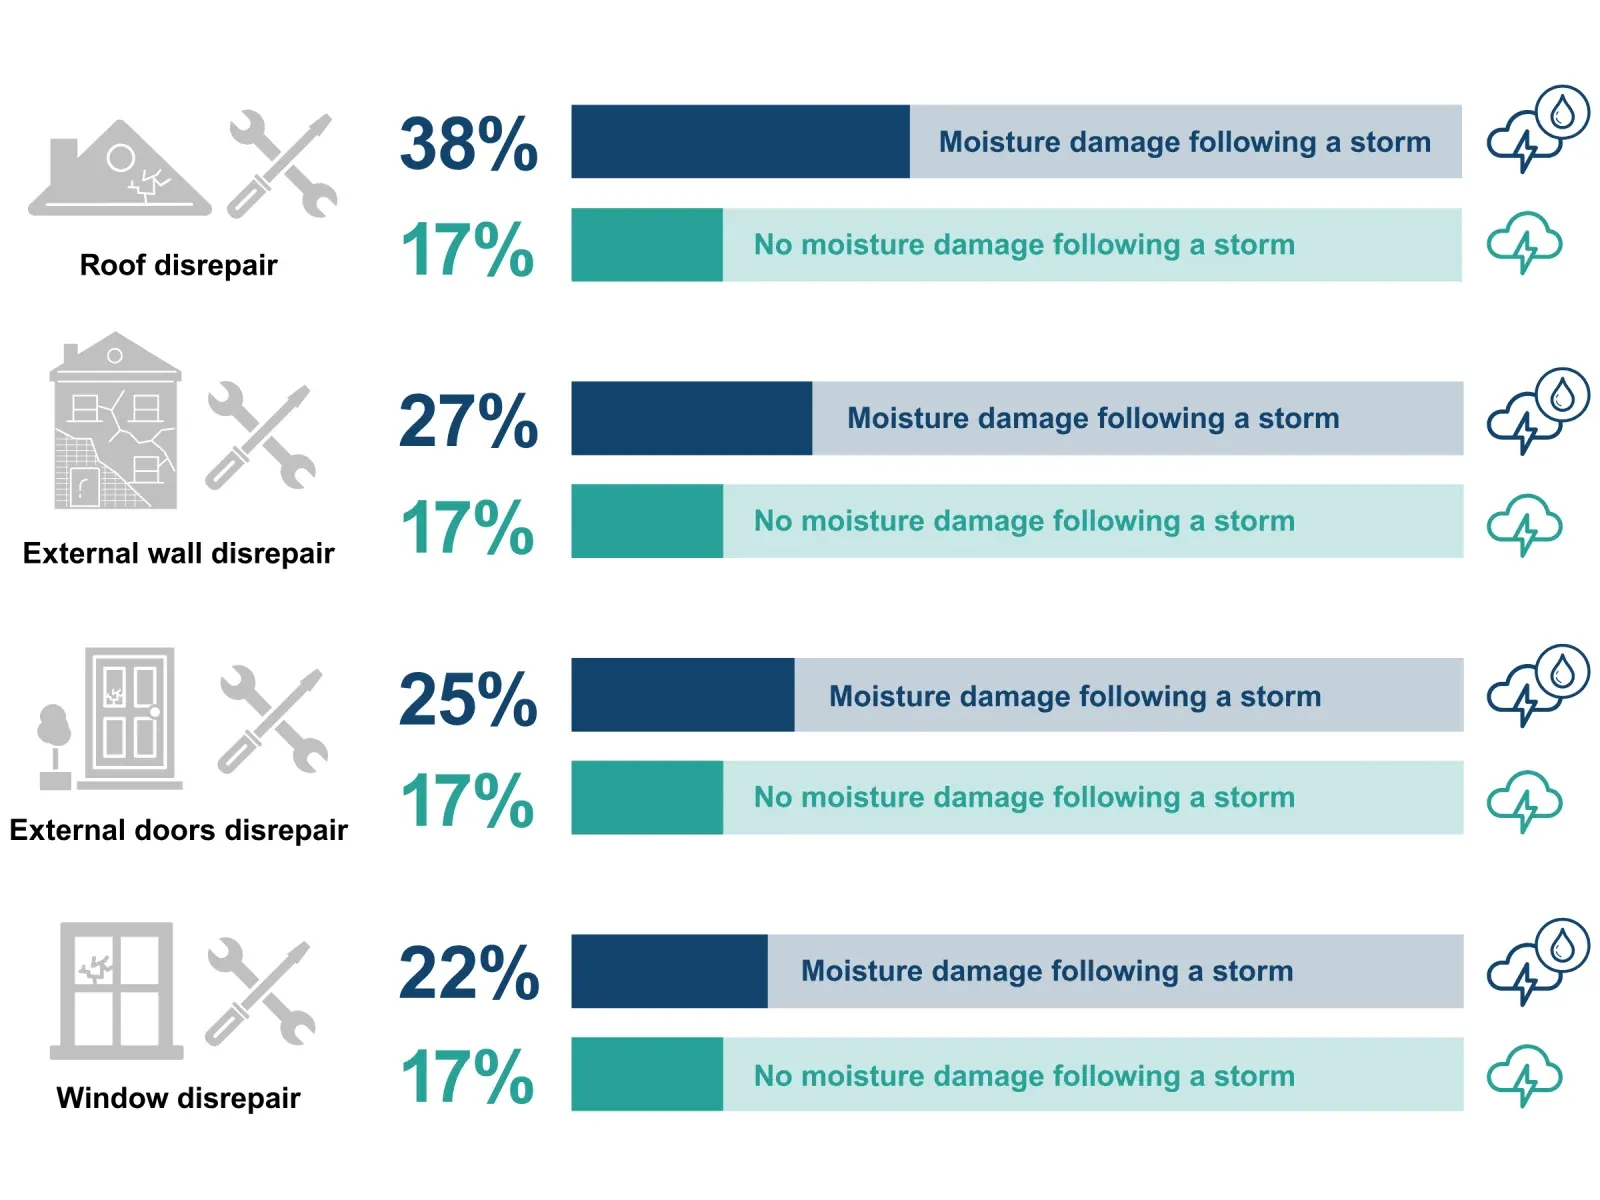 Figure 5: English homes with roofs in disrepair reported new moisture damage after a storm in 38% of cases, ahead of homes with wall, door or window disrepair at 27%, 25% and 22%, and well ahead of homes without roof disrepair at 17%. Source: MHCLG, English Housing Survey 2024 to 2025 weather resilient homes fact sheet, Jul 2026. Chart published by the source, captured 21 Oct 2026.
What does a sealed roof deck change?
- Water entry through an unsealed roof deck with near-total roof cover damage was more than 3 times greater than through a completely open soffit (IBHS, Dec 2024).
- In the 2020 derecho claims sample, every home with amplified water losses had more than 25% of the roof cover damaged (IBHS, Dec 2024).
How often do homes in disrepair take on water after a storm?
- In England, 4.2 million dwellings had householders report new moisture damage after a storm in 2024 (MHCLG, Jul 2026).
- Private rented homes reported it most at 22%, social rented homes 20% and owner-occupied homes 15% (MHCLG, Jul 2026).
- Homes with roof disrepair reported damage in 38% of cases against 17% for homes without it (MHCLG, Jul 2026).
- Doors in disrepair were tied to storm moisture damage in 25% of homes and windows in 22% (MHCLG, Jul 2026).
- Solid masonry walls saw damage in 28% of homes, against 9% for timber-frame walls (MHCLG, Jul 2026).
What Does a Plumbing Repair Cost Homeowners?
Most plumbing repairs are small, and a minority are not. The size of the repair bill also tracks how much damage the leak did first. Cost data on single incidents is thin, so the figures below come from owner surveys that ask what the last repair cost.
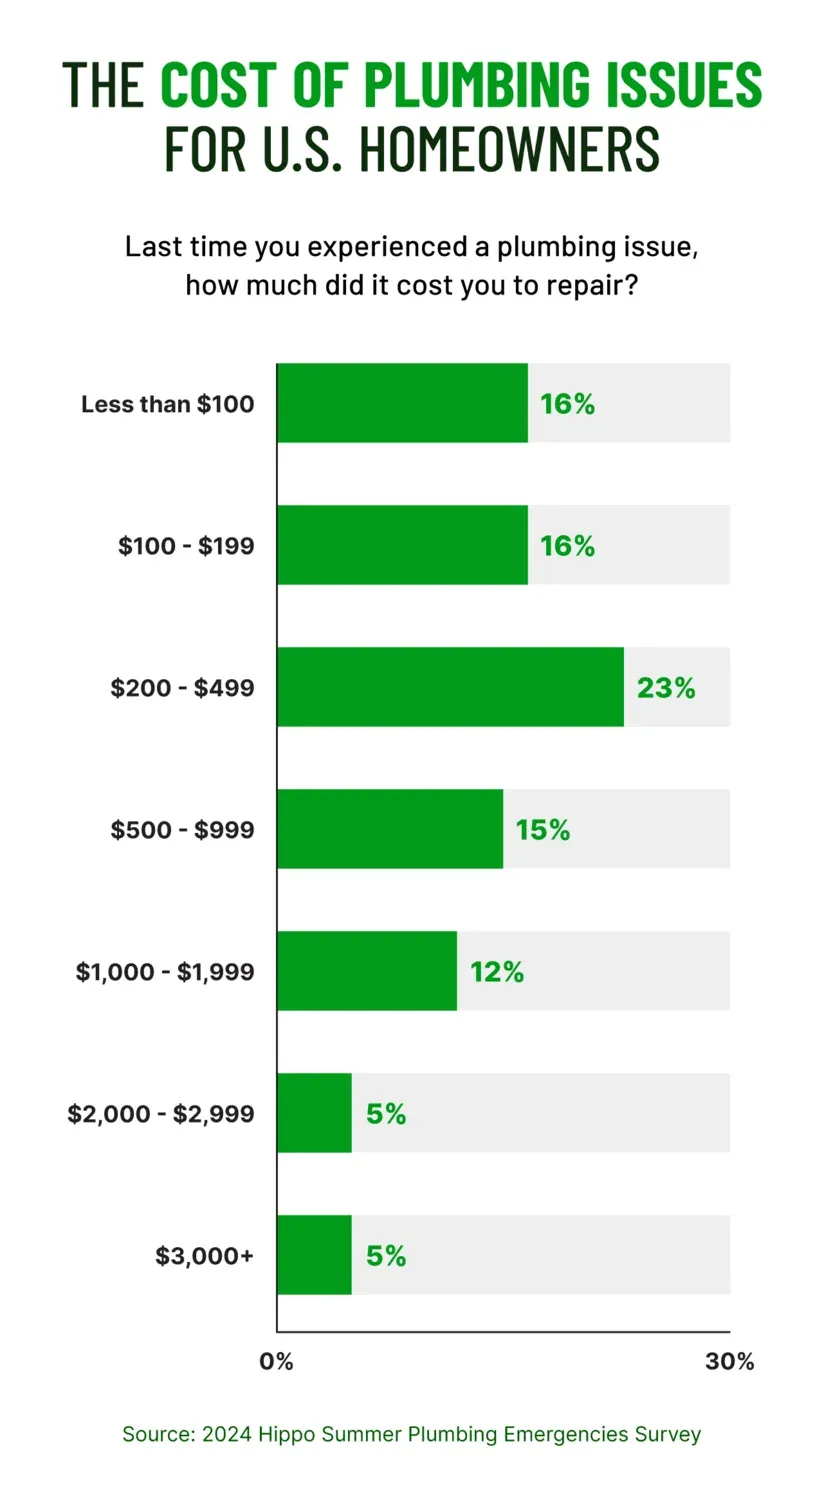 Figure 6: The most common bill for the last plumbing issue was $200 to $499 at 23% of homeowners, and 10% paid $2,000 or more. Source: Hippo, 2024 Summer Plumbing Emergencies Survey, Jul 2024. Chart published by the source, captured 21 Oct 2026.
How much did the last plumbing issue cost?
- 16% of homeowners paid under $100 and another 16% paid $100 to $199 (Hippo, Jul 2024).
- 23% paid $200 to $499, the most common band (Hippo, Jul 2024).
- 15% paid $500 to $999 and 12% paid $1,000 to $1,999 (Hippo, Jul 2024).
- 5% paid $2,000 to $2,999 and another 5% paid $3,000 or more (Hippo, Jul 2024).
- In all, 60% of responding homeowners paid at least $200 for their last plumbing repair (Hippo, Jul 2024).
Does a bigger bill mean more damage?
- 55% of homeowners who spent $3,000 or more on plumbing repairs also reported property damage from summer plumbing issues (Hippo, Jul 2024).
- The share was 47% for those who spent $2,000 to $2,999 and 40% for those who spent $1,000 to $1,999 (Hippo, Jul 2024).
- 29% of responding homeowners saw a spike in their water bill from summer plumbing issues (Hippo, Jul 2024).
- 31% of responding homeowners said the issues disrupted their daily routine (Hippo, Jul 2024).
What do burst pipes and deferred repairs cost?
- Repairing a burst pipe alone can run from $150 to $5,000 depending on severity (Hippo, Dec 2024).
- 36% of homeowners spent more than $500 repairing winter damage and 21% spent more than $1,000 (Hippo, Dec 2024).
- Major plumbing repairs can cost $5,000 or more (Hippo, May 2026).
- Plumbing work was among the deferred maintenance tasks, cited by 25% of homeowners (Hippo, May 2026).
What Do Owners Spend on Pipe, Fixture and Water Heater Jobs?
The Census Bureau tracks owner-reported home improvement projects, including the plumbing jobs that follow a leak. The totals show how much of this work goes to professionals and how it is paid for.
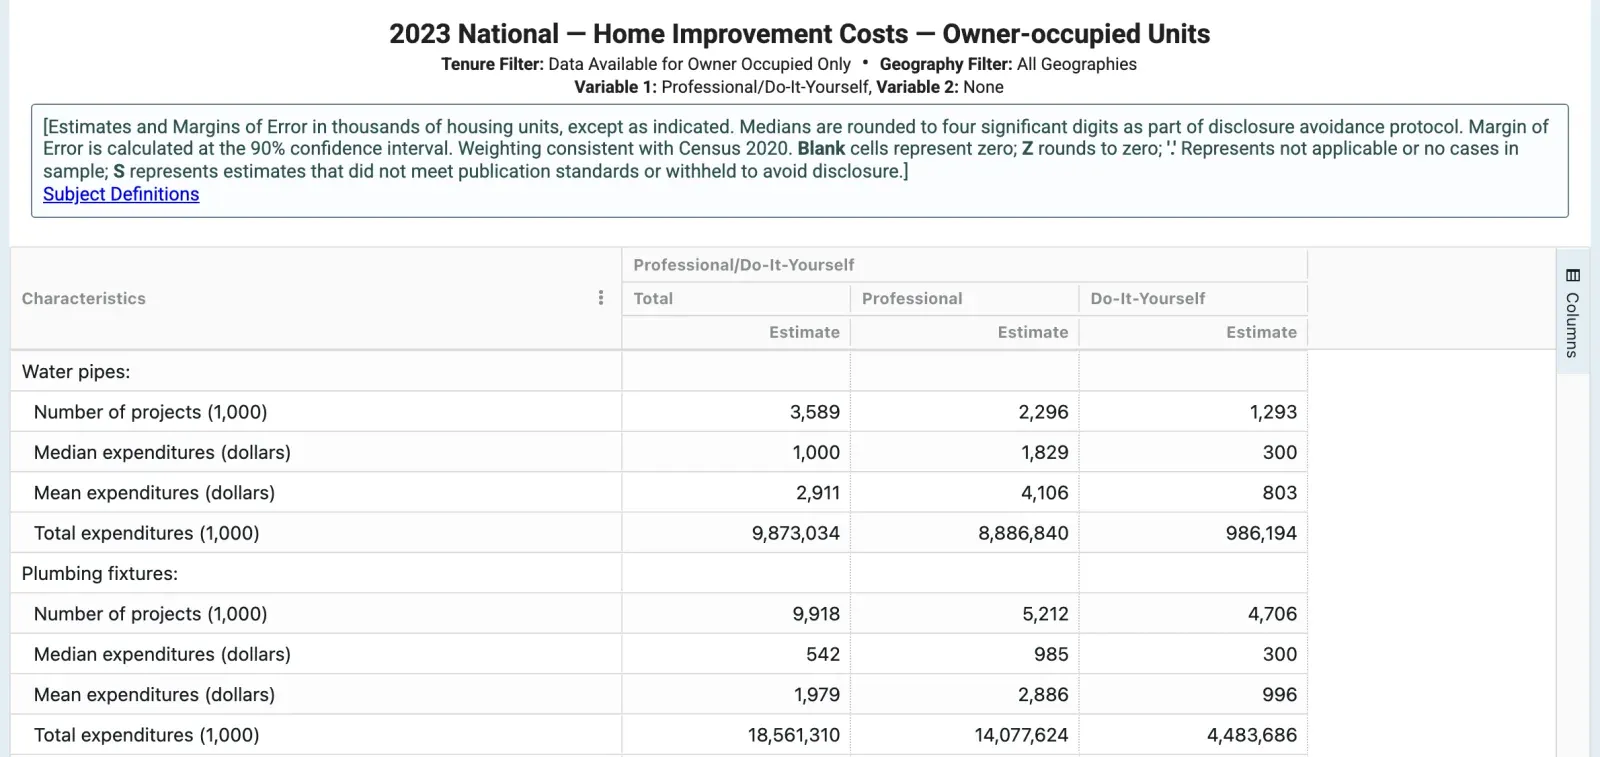 Figure 7: Owners spent $9.9 billion on interior water pipe projects in the two years before the 2023 survey, and professional jobs averaged $4,106 against $803 for do-it-yourself jobs. Source: Census Bureau, American Housing Survey Table Creator, 2023 Home Improvement Costs table, Sep 2024. Screenshot of the source page, captured 21 Oct 2026.
What do owners pay for pipe work?
- Interior water pipe projects had a mean cost of $2,911 and a median of $1,000 (Census Bureau, Sep 2024).
- Professional pipe jobs averaged $4,106 with a median of $1,829 (Census Bureau, Sep 2024).
- Do-it-yourself pipe jobs averaged $803 with a median of $300 (Census Bureau, Sep 2024).
- Owners spent $9.87 billion on interior water pipes in all, and $8.89 billion of it went to professionals (Census Bureau, Sep 2024).
What do fixtures and water heaters cost?
- Owners reported 9.92 million plumbing fixture projects with a mean cost of $1,979 (Census Bureau, Sep 2024).
- Professionals did 5.21 million of them at a mean of $2,886, against a mean of $996 for do-it-yourself jobs (Census Bureau, Sep 2024).
- Water heater, dishwasher and garbage disposal projects numbered 16.4 million, with a median of $800 and a mean of $1,148 (Census Bureau, Sep 2024).
- Professionals did 9.65 million of those at a mean of $1,453, against $704 for do-it-yourself work (Census Bureau, Sep 2024).
How do owners pay for pipe work?
Cash does most of it. Insurance pays for a small slice.
- 2.78 million of the 3.59 million pipe projects were paid from savings (Census Bureau, Sep 2024).
- A homeowners insurance settlement was the main funding source for 181,000 pipe projects (Census Bureau, Sep 2024).
- Across all home improvement projects, an insurance settlement was the main source for 5.42 million of 139.9 million (Census Bureau, Sep 2024).
How Common Are Mold and Dampness After a Leak?
A leak that is not dried becomes a mold problem. Mold is reported in a small share of US homes, but far more often in rooms with water and in homes that have had leaks.
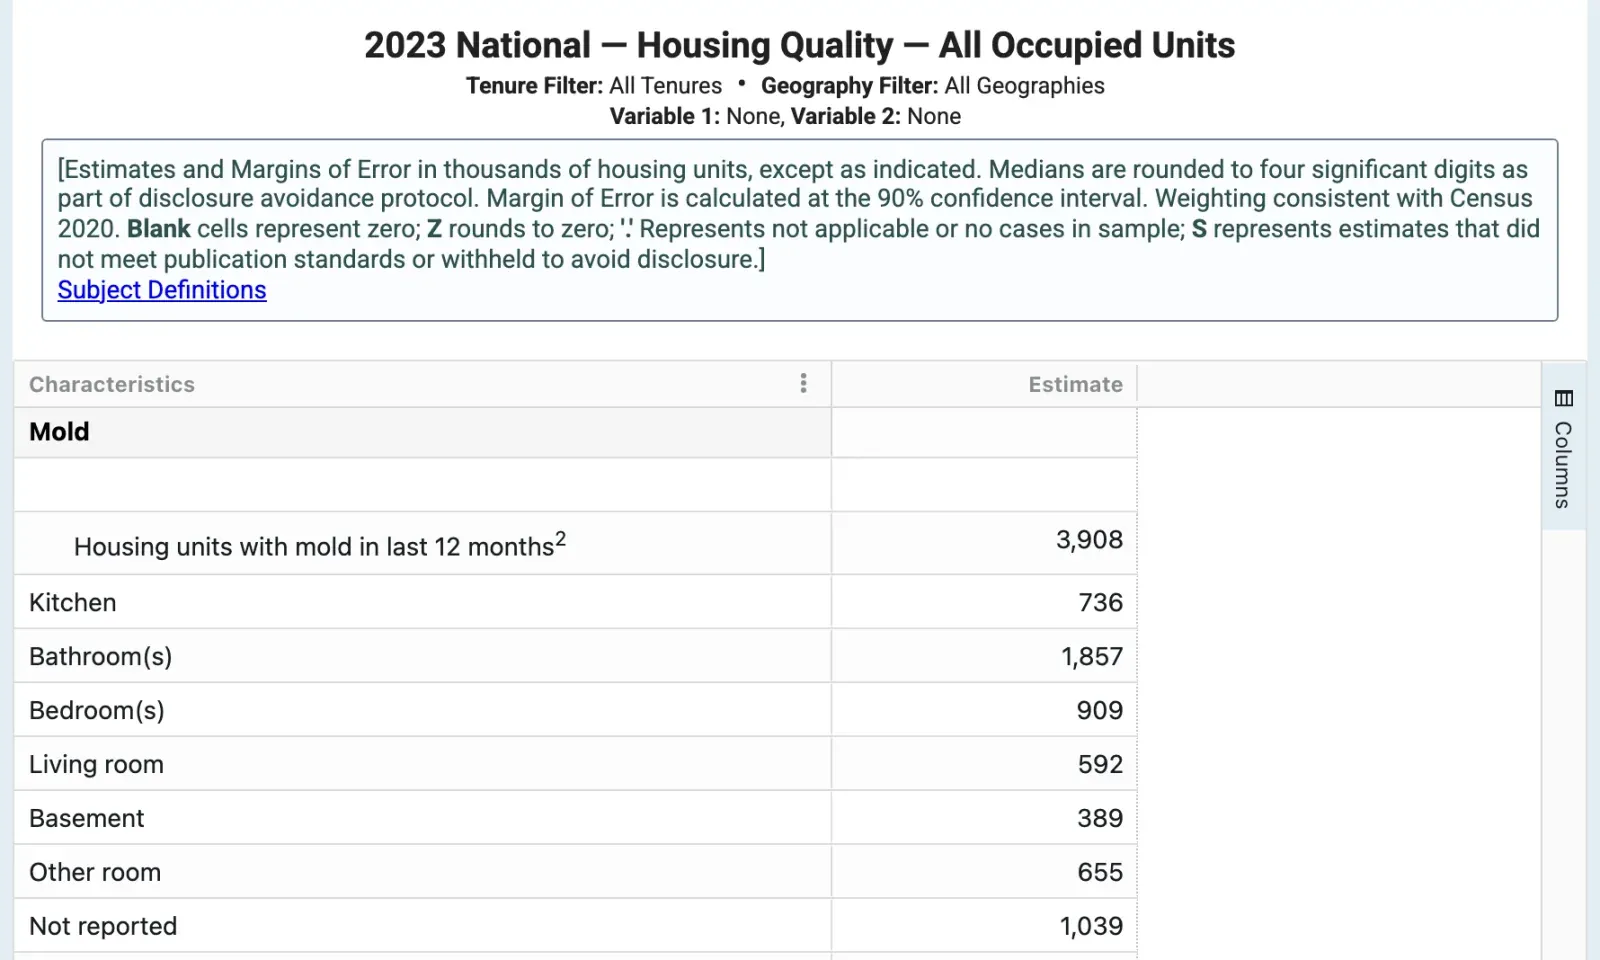 Figure 8: Bathrooms were the most common place for mold, named in 1.86 million homes, well ahead of bedrooms, kitchens, living rooms and basements. Source: Census Bureau, American Housing Survey Table Creator, 2023 Housing Quality table, Mold rows, Sep 2024. Screenshot of the source page, captured 21 Oct 2026.
Where does mold show up in the home?
- Bathrooms had mold in 1.86 million homes and bedrooms in 0.91 million (Census Bureau, Sep 2024).
- Kitchens had mold in 0.74 million homes, living rooms in 0.59 million and basements in 0.39 million (Census Bureau, Sep 2024).
Who is most likely to have mold?
- Bathroom mold was reported in 2.7% of renter homes and 0.7% of owner homes (Census Bureau, Sep 2024).
- Buildings with 5 to 9 units reported mold in 6.8% of homes, against 2.0% for detached houses (Census Bureau, Sep 2024).
- Households below 50% of the poverty level reported mold in 5.0% of homes, against 2.3% at 200% or more (Census Bureau, Sep 2024).
How common is hidden dampness?
Counts of visible mold understate dampness. Studies that measure it directly find much higher rates.
- A synthesis of US studies put dampness or mold in about 47% of homes (Mudarri and Fisk, Indoor Air, Jun 2007).
- A review in Europe, Canada and the US found at least 20% of buildings with one or more signs of dampness (World Health Organization, Oct 2009).
- A study of 16,190 people in five northern European countries found 18% indoor dampness (World Health Organization, Oct 2009).
- EPA advises keeping indoor humidity below 60%, ideally between 30 and 50% (EPA, Feb 2026).
What Does Dampness Do to Health?
The health case against damp homes is built from dozens of studies, and the direction is the same in all of them. Dampness is linked to more respiratory illness, and the link is strongest for children with asthma. For a plumber, this is the reason a small leak is worth fixing fast.
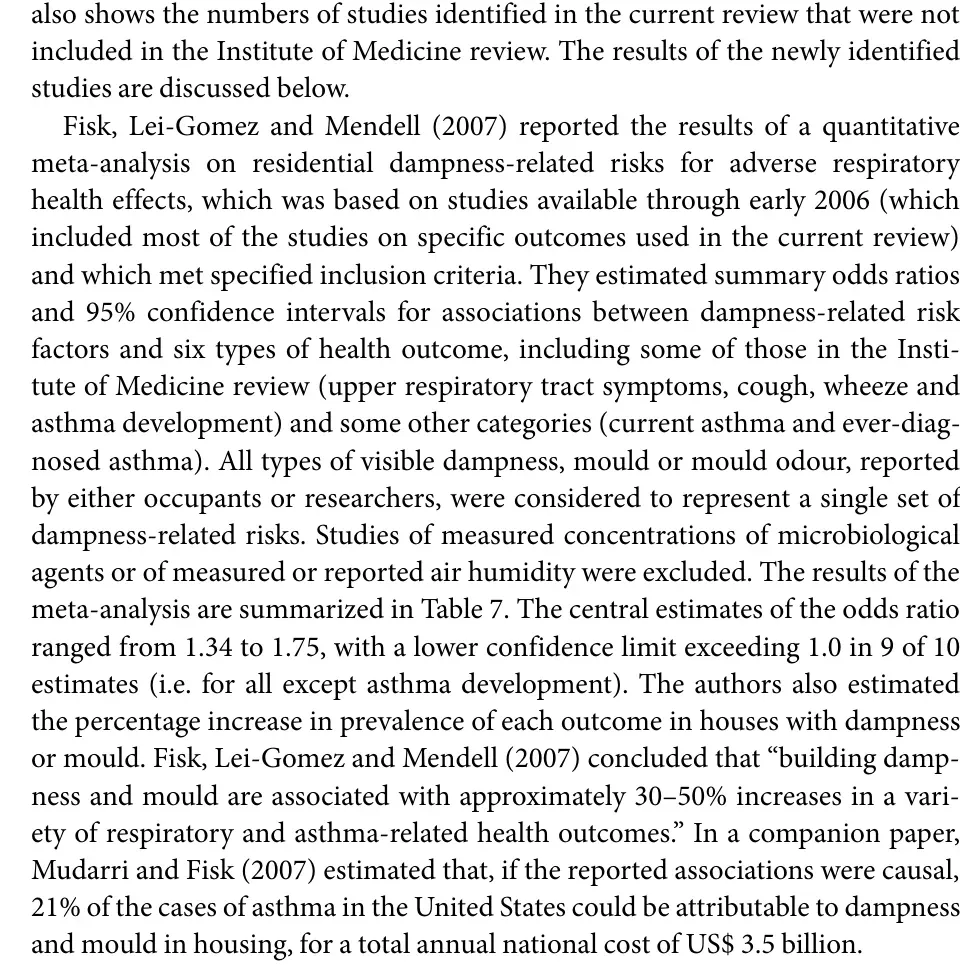 Figure 9: The WHO guideline summarises a meta-analysis in which damp and moldy homes carried 30 to 50% higher risks of respiratory and asthma outcomes. Source: World Health Organization, WHO guidelines for indoor air quality: dampness and mould, page 68, Oct 2009. Screenshot of the source page, captured 21 Oct 2026.
How large is the risk?
- The central estimates of the odds ratio for respiratory outcomes in damp homes ranged from 1.34 to 1.75 (World Health Organization, Oct 2009).
- Building dampness and mold were associated with roughly 30 to 50% increases in respiratory and asthma-related outcomes (World Health Organization, Oct 2009).
- Residential dampness and mold raised the odds of bronchitis to 1.45 and of respiratory infections to 1.44 in a meta-analysis (Fisk et al., Environmental Health, Nov 2010).
- The same paper estimated attributable risk proportions of 8% to 20% for dampness and mold (Fisk et al., Environmental Health, Nov 2010).
- Of 21.8 million US asthma cases, about 4.6 million were estimated as attributable to dampness and mold at home (Mudarri and Fisk, Indoor Air, Jun 2007).
What do newer reviews find?
- A review of epidemiology to late 2009 found dampness or mold consistently associated with asthma development and exacerbation, with evidence strongly suggesting causation of asthma exacerbation in children (Mendell et al., Environmental Health Perspectives, Jun 2011).
- An update covering 69 eligible articles concluded that indoor dampness has a causal relationship with asthma exacerbation in children (Kanchongkittiphon et al., Environmental Health Perspectives, Jan 2015).
- A meta-analysis of 16 studies put the summary effect of any dampness or mold exposure on new asthma at 1.50, with mold odor at 1.73 (Quansah et al., PLOS ONE, Nov 2012).
- Past water damage alone was not significantly linked to new asthma in that analysis, at an effect of 1.12 (Quansah et al., PLOS ONE, Nov 2012).
Does fixing the moisture help?
- In a randomized trial of 62 asthmatic children in moldy homes, 1 of 29 children whose homes were repaired for moisture had exacerbations afterward, against 11 of 33 in the control group (as-treated analysis) (Kercsmar et al., Environmental Health Perspectives, Nov 2006).
- In England, 58% of household reference people in damp homes reported good health, against 70% in homes without damp (MHCLG, Jul 2024).
How Does Home Dampness Compare Abroad?
Other countries measure leaking roofs, damp walls and rot more directly than the US does. Their numbers show the same pattern: older stock, renters and low incomes carry more damp. The EU figure is the best like-for-like count.
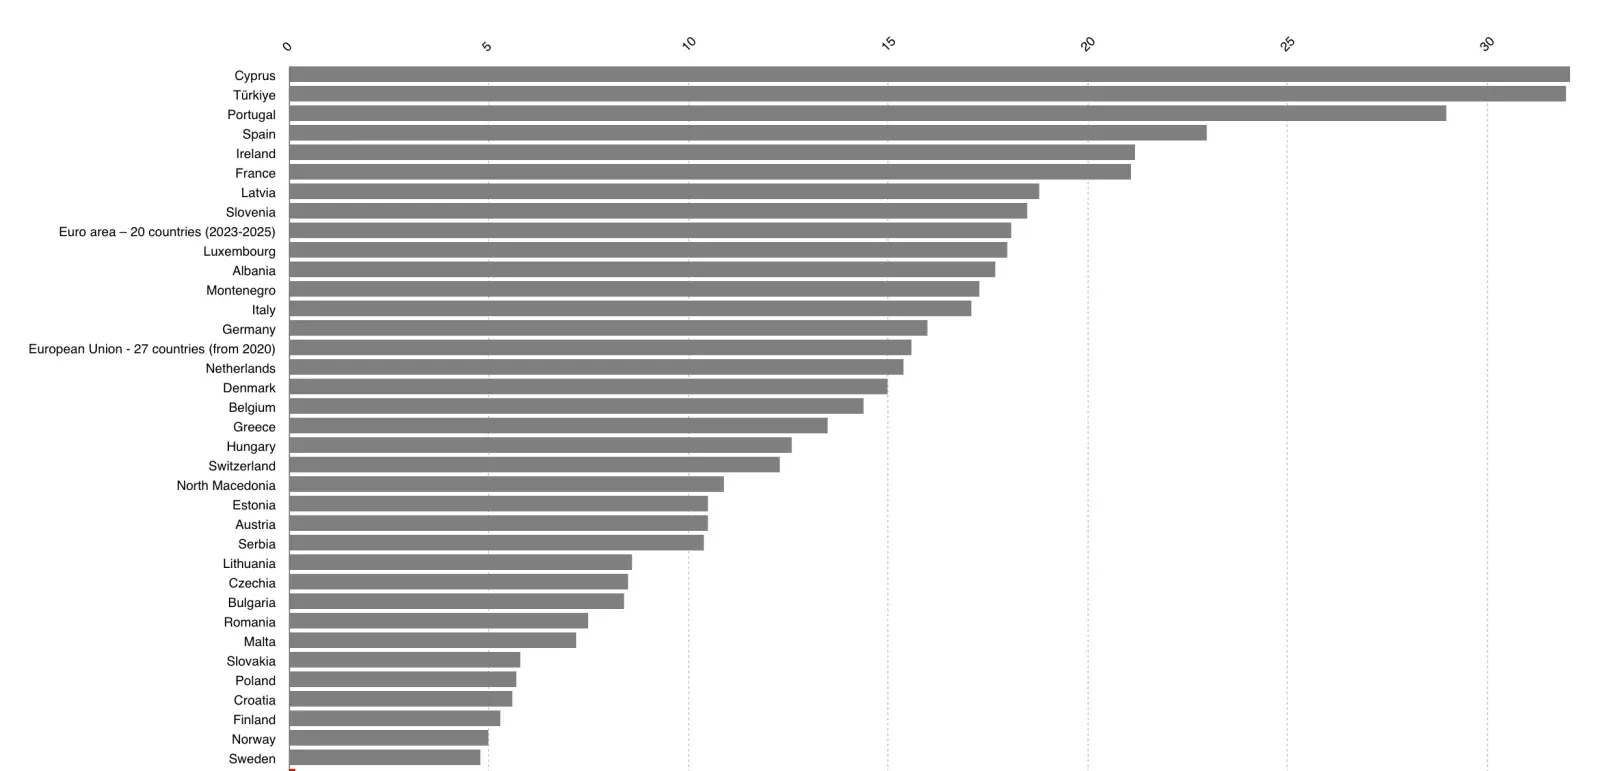 Figure 10: The share of people in a dwelling with a leaking roof, damp walls or rot ranged from 4.8% in Sweden to 32.1% in Cyprus in 2023, with the EU average in the middle. Source: Eurostat, dataset ilc_mdho01, bar chart for 2023, Apr 2026. Screenshot of the source page, captured 21 Oct 2026.
Which European countries have the most damp homes?
- Cyprus had the highest share at 32.1% and Portugal followed at 29.0% (Eurostat, Apr 2026).
- Spain reported 23.0%, France 21.1% and Germany 16.0% (Eurostat, Apr 2026).
- Poland reported 5.7% and Sweden 4.8% (Eurostat, Apr 2026).
- In the EU, 23.6% of people below the 60% of median income line lived in such a dwelling, against 14.1% of those above it (Eurostat, Apr 2026).
- The EU rate was 16.3% in 2010 (Eurostat, Apr 2026).
How common is damp in England?
- Surveyors recorded damp problems in 6% of English homes, about 1.4 million households (MHCLG, Jul 2026).
- The rate was 11% for private renters and 4% for owner occupiers (MHCLG, Jul 2026).
- Households themselves reported condensation, damp or mold in 31% of homes, or 7.7 million (MHCLG, Jul 2026).
- Two years earlier, damp was recorded in 4% of homes, about 1.0 million households (MHCLG, Jul 2024).
- About 1.0 million dependent children lived in damp homes in 2024 to 2025 (MHCLG, Jul 2026).
- The most serious Category 1 damp and mold hazards were found in 142,000 households (MHCLG, Jul 2026).
- Of households with damp, 83% said they open windows to deal with it (MHCLG, Jul 2026).
- Households were dissatisfied with their home in 22% of cases when damp was present, against 6% when it was not (MHCLG, Jul 2026).
Which Prevention Steps Do Owners Skip?
Most water damage is avoidable, and owners know it. The gap is in routine checks, shutting off water, and acting on small leaks. A shop that books those checks sells something customers say they want and rarely schedule.
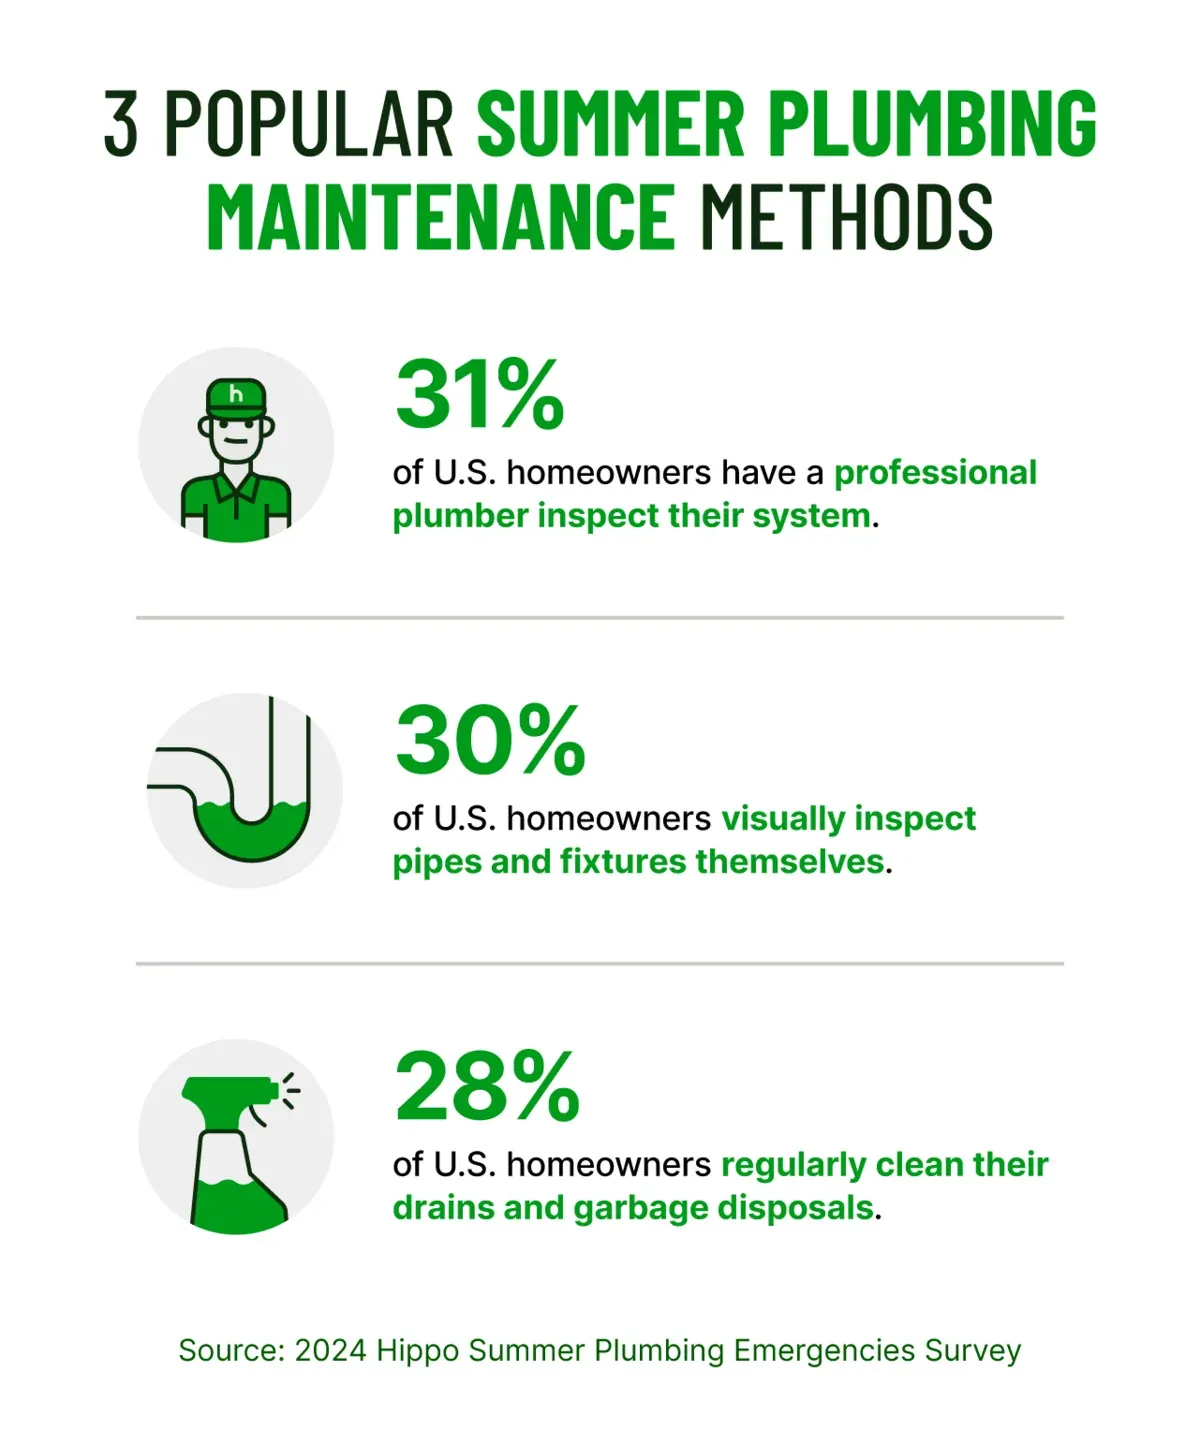 Figure 11: Fewer than a third of US homeowners have a plumber inspect their system, and about as many check pipes themselves or clean their drains. Source: Hippo, 2024 Summer Plumbing Emergencies Survey, Jul 2024. Chart published by the source, captured 21 Oct 2026.
What do owners actually do?
- 31% of homeowners have a professional plumber inspect their system (Hippo, Jul 2024).
- 30% inspect pipes and fixtures themselves (Hippo, Jul 2024).
- 28% regularly clean their drains and garbage disposals (Hippo, Jul 2024).
- 61% take at least one proactive step in the summer months to avoid costly plumbing repairs (Hippo, Jul 2024).
How much of it could have been avoided?
- Hippo found that water damage was its top claim type in 2020 and that in more than 90% of cases it is preventable (Hippo, Mar 2021).
- Only 24% of homeowners prioritized checking for water leaks the year before, and 19% were doing it themselves in 2024 (Hippo, May 2024).
Glossary
- AHS: American Housing Survey, run by the Census Bureau and HUD.
- EHS: English Housing Survey, run by the UK housing ministry.
- EPA: US Environmental Protection Agency.
- IBHS: Insurance Institute for Business & Home Safety, a research group funded by insurers.
- MHCLG: Ministry of Housing, Communities and Local Government in England.
- Odds ratio: a measure of how much more likely an outcome is in one group than in another. A value of 1.5 means about 50% higher odds.
- PUF: public use file, the microdata the Census Bureau releases with each AHS.
- WHO: World Health Organization.
Methodology and Sources
Figures come from the agency, research body or company that produced them. Each is dated and linked to the page or file it was read from. Census counts are in thousands of occupied housing units from the AHS Table Creator, and shares on this page divide a published count by the published total for the same group. The leak-and-mold overlap is our tabulation of the 2023 public use file, which reproduces the published national counts exactly. Hippo and Travelers survey figures describe their respondents and are labelled as surveys. Nothing is estimated beyond what the sources print. The page is refreshed monthly.
Sources
The sources behind this page, each linked where it is cited:
- Census Bureau, American Housing Survey Table Creator, 2023
- Census Bureau, AHS 2023 public use file
- Census Bureau, AHS 2021 table specifications
- Census Bureau, AHS 2019 table specifications
- Census Bureau, AHS 2017 table specifications
- Census Bureau, AHS 2015 table specifications
- IBHS, State of the Risk: Interior Water Damage
- World Health Organization, WHO guidelines for indoor air quality: dampness and mould
- Mudarri and Fisk, Public health and economic impact of dampness and mold
- EPA, A Brief Guide to Mold, Moisture and Your Home
- Fisk et al., Environmental Health
- Mendell et al., Environmental Health Perspectives
- Kanchongkittiphon et al., Environmental Health Perspectives
- Kercsmar et al., Environmental Health Perspectives
- Quansah et al., PLOS ONE
- Eurostat, ilc_mdho01
- MHCLG, English Housing Survey 2024 to 2025, perceptions and impacts of housing quality
- MHCLG, English Housing Survey 2024 to 2025, weather resilient homes fact sheet
- MHCLG, English Housing Survey 2022 to 2023, housing quality and condition
- Hippo, 2024 Summer Plumbing Emergencies Survey
- Hippo, Housepower reports and homeowner surveys
- Travelers, water protection pages and Travelers independent surveys of US homeowners