Handyman market statistics are hard to find because no government agency counts handymen as a group. The numbers sit under other labels: residential remodelers, general maintenance workers, solo operators. This page pulls them together from the agencies that produced them, and says which label each number uses.
The picture is clear once you line them up. The work is done mostly by very small firms, many with no employees. The pay is modest, the state license rules are a patchwork, and the jobs people hire out are mostly small ones.
Updated October 2026. Every figure links to the Census Bureau, the Bureau of Labor Statistics (BLS), a state agency, a federal filing or a named survey. Where a number is our own arithmetic on a public file, the text says so.
Key Takeaways
- 135,337 residential remodeler locations had paid staff in 2023, the Census category that holds handyman services (Census Bureau, County Business Patterns 2023, Jun 2025).
- Payroll at those locations rose 51.6% from 2019 to 2023 (Census Bureau, County Business Patterns 2019, Apr 2021) (Census Bureau, County Business Patterns 2023, Jun 2025).
- Of 132,711 remodeler firms, 108,299 had fewer than 5 employees (Census Bureau, Statistics of U.S. Businesses 2022, Apr 2025).
- 897,780 solo operators in residential building construction took in $91.9 billion in 2024 (Census Bureau, Nonemployer Statistics 2024, Sep 2026).
- Residential remodelers reported $129.1 billion in revenue in 2022 (Census Bureau, 2022 Economic Census, Dec 2024).
- Remodelers booked only $3.4 million of plumbing work in 2022 (Census Bureau, 2022 Economic Census Kind of Business, Dec 2025).
- 1,529,700 general maintenance and repair workers were employed in May 2025 (BLS OEWS, May 2026).
- Only 14,200 of that occupation’s 1,621,800 jobs were self-employed, or 0.9% (BLS National Employment Matrix, Aug 2026).
- The median pay for the occupation was $49,590 a year in May 2025 (BLS Occupational Outlook Handbook, Aug 2026).
- Florida lets unlicensed workers take jobs under $2,500, and South Carolina’s line is $10,000 (Florida Statutes 489.103, Oct 2026) (South Carolina Code 40-11-30, Oct 2026).
- Remodelers rate the market for projects under $20,000 at 73 out of 100, the strongest of three size bands (NAHB Remodeling Market Index, Oct 2026).
- 22% of adults paid for a major house or appliance repair in the prior 12 months (Federal Reserve, Economic Well-Being of U.S. Households in 2025, May 2026).
- About 64% of owner home projects in the two years before the 2023 survey were hired out, and the median hired project cost $4,000 (Census Bureau, American Housing Survey 2023, Jan 2025).
- Angi handled 15.5 million service requests in 2025, down 10% from 2024 (Angi Inc., Form 10-K FY2025, Feb 2026).
How Big Is the Handyman Industry?
The industry is big in head count and small in each shop. Most locations have fewer than five people, and the count keeps growing.
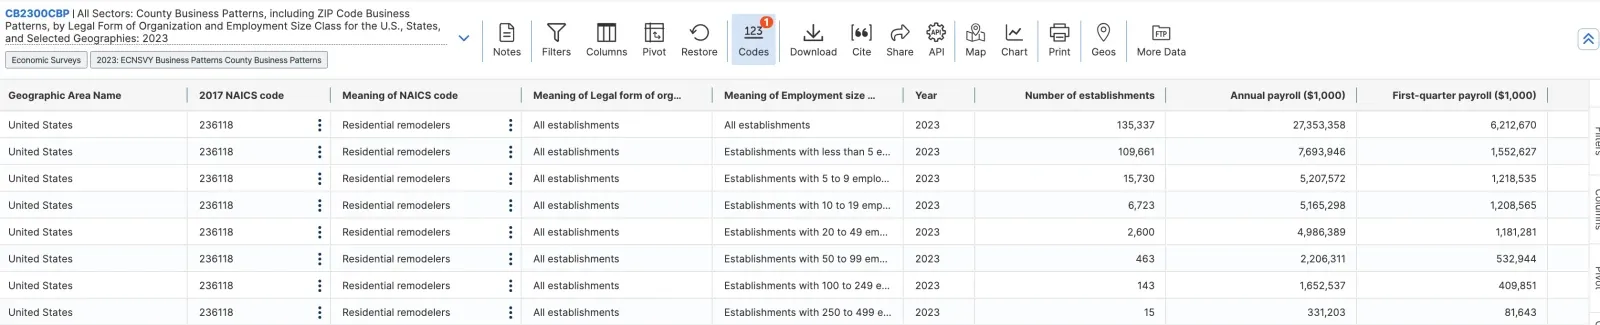 Figure 1: Residential remodelers in 2023 by employee size class, with the establishment count and annual payroll in thousands of dollars for each. The count falls fast as the size class rises. Source: Census Bureau, County Business Patterns 2023, table CB2300CBP, Jun 2025. Screenshot of the source page, captured 21 Oct 2026.
Which government category holds handyman businesses?
The Census Bureau files handyman work under residential building construction, in the same code as remodelers.
- The index lists “Handyman construction service, residential building” under code 236118, residential remodelers (Census Bureau, 2022 NAICS Index File, Jul 2026).
- A separate index entry puts handyman service for commercial and institutional buildings under code 236220 (Census Bureau, 2022 NAICS Index File, Jul 2026).
How many handyman and remodeler locations have paid staff?
Employer data covers locations with at least one paid worker. Solo operators are counted separately in the next question.
- Those locations employed 480,272 people in March 2023 (Census Bureau, County Business Patterns 2023, Jun 2025).
- They paid $27.4 billion in annual payroll (Census Bureau, County Business Patterns 2023, Jun 2025).
- 15,730 locations had 5 to 9 employees, and 6,723 had 10 to 19 (Census Bureau, County Business Patterns 2023, Jun 2025).
- Only 2,600 had 20 to 49 employees, and 463 had 50 to 99 (Census Bureau, County Business Patterns 2023, Jun 2025).
- Just 143 had 100 to 249 employees, and 15 had 250 to 499 (Census Bureau, County Business Patterns 2023, Jun 2025).
- 91,065 locations were S-corporations, the most common legal form (Census Bureau, County Business Patterns 2023, Jun 2025).
- 18,519 were sole proprietorships and 14,681 were C-corporations (Census Bureau, County Business Patterns 2023, Jun 2025).
How many solo handymen are there?
A nonemployer is a business with no paid staff. Most solo handymen fall here.
- 792,293 of the solo operators in residential building construction were sole proprietors (Census Bureau, Nonemployer Statistics 2024, Sep 2026).
- The count was 813,440 in 2022 (Census Bureau, Nonemployer Statistics 2022, Dec 2024).
- Those solo businesses averaged about $102,000 in receipts, our division of $91.9 billion by the number of firms (Census Bureau, Nonemployer Statistics 2024, Sep 2026).
- Another 678,091 solo operators sat in building finishing trades such as painting, flooring and drywall, with $45.3 billion in receipts (Census Bureau, Nonemployer Statistics 2024, Sep 2026).
- 605,015 solo operators filed as other specialty trade contractors (Census Bureau, Nonemployer Statistics 2024, Sep 2026).
- 146,860 filed under other services to buildings and dwellings (Census Bureau, Nonemployer Statistics 2024, Sep 2026).
- Across all industries, solo businesses averaged $58,194 in receipts (Census Bureau, Nonemployer Statistics 2024, Sep 2026).
How fast is the industry growing?
Growth has been strong since 2019 on every measure the Census tracks.
- Locations numbered 114,874 in 2019 (Census Bureau, County Business Patterns 2019, Apr 2021).
- Employment stood at 387,534 in 2019 (Census Bureau, County Business Patterns 2019, Apr 2021).
- Average payroll per worker rose from about $46,600 to about $57,000, our division of payroll by employees (Census Bureau, County Business Patterns 2019, Apr 2021) (Census Bureau, County Business Patterns 2023, Jun 2025).
- Other services to buildings and dwellings, a nearby code, grew from 14,841 to 18,069 locations (Census Bureau, County Business Patterns 2019, Apr 2021) (Census Bureau, County Business Patterns 2023, Jun 2025).
- All other specialty trade contractors grew from 35,734 to 42,748 locations (Census Bureau, County Business Patterns 2019, Apr 2021) (Census Bureau, County Business Patterns 2023, Jun 2025).
Which states have the most remodeler locations?
Four states hold about a third of all locations.
- California had 16,792 locations (Census Bureau, County Business Patterns 2023 State Files, Jun 2025).
- New York had 13,427 (Census Bureau, County Business Patterns 2023 State Files, Jun 2025).
- Florida had 10,287 (Census Bureau, County Business Patterns 2023 State Files, Jun 2025).
- Texas had 6,224 (Census Bureau, County Business Patterns 2023 State Files, Jun 2025).
- California locations employed 71,834 people (Census Bureau, County Business Patterns 2023 State Files, Jun 2025).
For the plumbing slice of this market, see plumbing industry numbers.
How Much Money Does the Industry Make?
Revenue per firm is near a million dollars, but that average hides a long tail of one-person shops. Two Census programs give two totals, and both are used here.
 Figure 2: The 2022 Economic Census row for residential remodelers. The identifying columns on the left are joined to the count and dollar columns on the right, with sales and payroll in thousands of dollars. Source: Census Bureau, 2022 Economic Census, table EC2200BASIC, Dec 2024. Screenshot of the source page, captured 21 Oct 2026.
How many firms and how much payroll?
- The Economic Census counted 127,652 firms (Census Bureau, 2022 Economic Census, Dec 2024).
- Those firms ran 128,187 establishments (Census Bureau, 2022 Economic Census, Dec 2024).
- Annual payroll was $23.4 billion (Census Bureau, 2022 Economic Census, Dec 2024).
- The firms employed 409,932 people (Census Bureau, 2022 Economic Census, Dec 2024).
- Fringe benefits added $4.5 billion (Census Bureau, 2022 Economic Census, Dec 2024).
What do the firm size numbers show?
The Statistics of U.S. Businesses counts whole companies, not locations.
- It counted 462,690 employees and $142.7 billion in revenue in 2022 (Census Bureau, Statistics of U.S. Businesses 2022, Apr 2025).
- Firms with fewer than 20 employees took in $96.1 billion, or 67% of that total (Census Bureau, Statistics of U.S. Businesses 2022, Apr 2025).
- 2,753 firms had 20 to 99 employees (Census Bureau, Statistics of U.S. Businesses 2022, Apr 2025).
- Only 44 firms had 500 or more, and they held 16,908 jobs (Census Bureau, Statistics of U.S. Businesses 2022, Apr 2025).
- Average revenue came to about $1.08 million per firm, our division (Census Bureau, Statistics of U.S. Businesses 2022, Apr 2025).
How big are the nearby trades?
- Finish carpentry: 31,854 firms and $43.0 billion in revenue (Census Bureau, Statistics of U.S. Businesses 2022, Apr 2025).
- Painting and wall covering: 37,830 firms and $34.0 billion (Census Bureau, Statistics of U.S. Businesses 2022, Apr 2025).
- Drywall and insulation: 19,495 firms (Census Bureau, Statistics of U.S. Businesses 2022, Apr 2025).
- All other specialty trade contractors: 39,784 firms and $87.4 billion (Census Bureau, Statistics of U.S. Businesses 2022, Apr 2025).
Where does the money go?
- Materials cost $45.2 billion (Census Bureau, 2022 Economic Census, Dec 2024).
- Work subcontracted out to others cost $24.9 billion (Census Bureau, 2022 Economic Census, Dec 2024).
- Advertising and promotion cost $1.07 billion (Census Bureau, 2022 Economic Census, Dec 2024).
- Privately owned projects made up $123.5 billion of the work, against $2.4 billion for government projects (Census Bureau, 2022 Economic Census, Dec 2024).
What work do remodelers actually sell?
- $79.0 billion came from general remodeling (Census Bureau, 2022 Economic Census Kind of Business, Dec 2025).
- $28.8 billion came from building on land the customer owns (Census Bureau, 2022 Economic Census Kind of Business, Dec 2025).
- Finish carpentry brought in $2.1 billion (Census Bureau, 2022 Economic Census Kind of Business, Dec 2025).
- Electrical installation and service brought in $14.1 million and heating and cooling work $12.5 million (Census Bureau, 2022 Economic Census Kind of Business, Dec 2025).
- Crews swing with the seasons: 288,779 construction workers were on payroll in the March pay period and 394,547 in December (Census Bureau, 2022 Economic Census, Dec 2024).
How Many People Work as Handymen and Who Employs Them?
Most people in the closest BLS job are not freelance handymen. They are the in-house maintenance staff of apartment buildings, schools and hotels. The BLS has no handyman row, so this page uses general maintenance and repair workers.
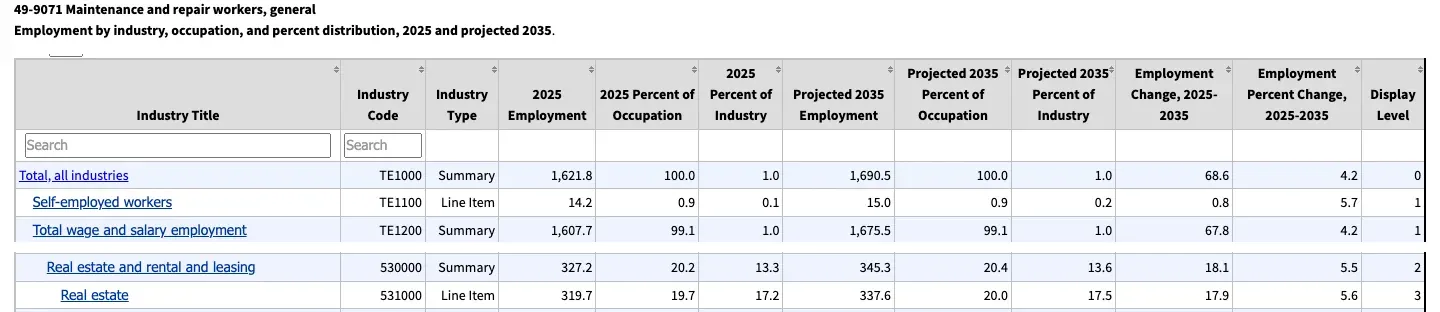 Figure 3: Where general maintenance and repair workers work, 2025 and projected 2035, in thousands. The top rows show the total, the self-employed and wage and salary jobs, and the lower rows show real estate, the largest employer. Rows from different parts of the table are joined here. Source: BLS National Employment Matrix, occupation 49-9071, Aug 2026. Screenshot of the source page, captured 21 Oct 2026.
How many general maintenance workers are there?
- The BLS lists “Mechanics Handyman” as an example job title for this occupation (BLS Employment Projections, Aug 2026).
- The wage and salary count was 1,607,700 (BLS National Employment Matrix, Aug 2026).
- The employer survey counts 92,100 fewer jobs than the projections program, which uses a different method and adds the self-employed (BLS OEWS, May 2026).
Which states employ the most?
- California: 143,060 (BLS OEWS, May 2026).
- Texas: 140,580 (BLS OEWS, May 2026).
- New York: 119,650 (BLS OEWS, May 2026).
- Florida: 111,530 (BLS OEWS, May 2026).
For plumbers alone, see the plumber workforce numbers.
Which industries employ them?
- Real estate employed 319,700, or 19.7% of the occupation, and the occupation was 17.2% of all real estate jobs (BLS National Employment Matrix, Aug 2026).
- Government outside schools and hospitals employed 191,700 (BLS National Employment Matrix, Aug 2026).
- Health care and social assistance employed 124,700, and educational services 124,600 (BLS National Employment Matrix, Aug 2026).
- Construction employed only 34,200, or 2.1% (BLS National Employment Matrix, Aug 2026).
- Specialty trade contractors employed 16,500, and services to buildings and dwellings 24,300 (BLS National Employment Matrix, Aug 2026).
How many handyman-type workers are self-employed?
Self-employment is common in the trades next door, and rare in this occupation.
- 222,900 carpenters were self-employed, 25.1% of the trade (BLS National Employment Matrix, Aug 2026).
- 102,200 painters were self-employed, 31.3% (BLS National Employment Matrix, Aug 2026).
- 401,100 construction laborers were self-employed, 26.9% (BLS National Employment Matrix, Aug 2026).
- 33,000 roofers were self-employed, 19.8% (BLS National Employment Matrix, Aug 2026).
- 19,900 drywall installers, 19.4%, and 9,500 tile setters, 21.1% (BLS National Employment Matrix, Aug 2026) (BLS National Employment Matrix, Aug 2026).
- 8,200 home appliance repairers were self-employed, 20.3% (BLS National Employment Matrix, Aug 2026).
How Much Do Handymen Earn?
Pay for this job follows the employer, not the skill. A maintenance worker in manufacturing out-earns one in a hotel by a wide margin.
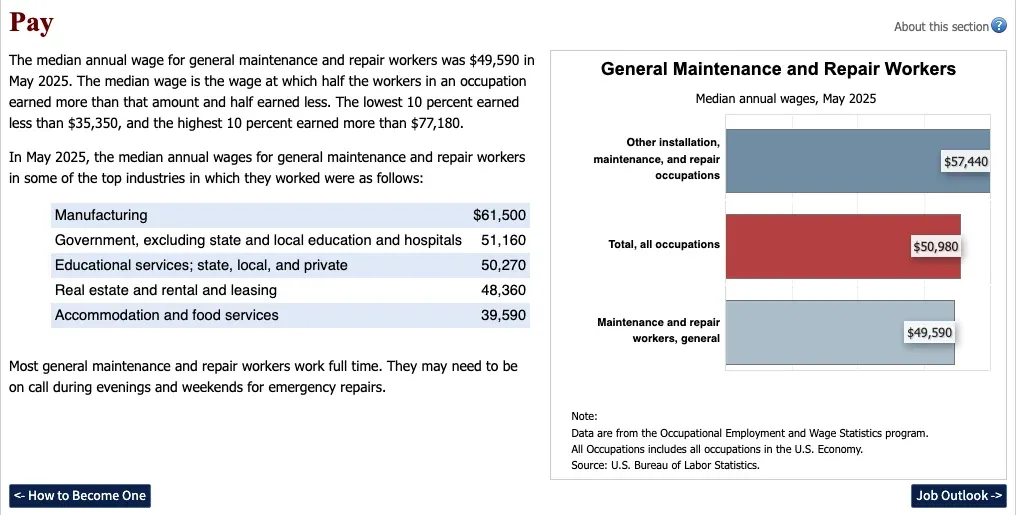 Figure 4: Median annual wages for general maintenance and repair workers in May 2025, by industry, next to the all-occupation median. The occupation sits just under the national median. Source: BLS Occupational Outlook Handbook, General Maintenance and Repair Workers, Aug 2026. Chart published by the source, captured 21 Oct 2026.
What is the pay range?
- The mean annual wage was $53,780 (BLS OEWS, May 2026).
- The mean hourly wage was $25.86, and the median hourly wage was $23.84 (BLS OEWS, May 2026) (BLS OEWS, May 2026).
- The lowest 10% earned under $35,350 a year (BLS OEWS, May 2026), or $17.00 an hour (BLS OEWS, May 2026).
- The highest 10% earned over $77,180 a year (BLS OEWS, May 2026), or $37.11 an hour (BLS OEWS, May 2026).
- The median for all occupations was $50,980, and for other installation, maintenance and repair jobs $57,440 (BLS Occupational Outlook Handbook, Aug 2026).
Which industries pay the most?
- Manufacturing paid a median of $61,500 (BLS Occupational Outlook Handbook, Aug 2026).
- Government outside schools and hospitals paid $51,160 (BLS Occupational Outlook Handbook, Aug 2026).
- Real estate and rental and leasing paid $48,360, and accommodation and food services $39,590 (BLS Occupational Outlook Handbook, Aug 2026).
- Hospitals paid a median of $59,230 (BLS OEWS, May 2026).
- Specialty trade contractors paid $51,410 (BLS OEWS, May 2026).
- Services to buildings and dwellings paid $48,390 (BLS OEWS, May 2026).
Which states pay the most?
- The District of Columbia paid a median of $60,310 (BLS OEWS, May 2026).
- Alaska paid $60,270 (BLS OEWS, May 2026).
- Minnesota paid $59,200 (BLS OEWS, May 2026).
- Washington paid $59,160, and Massachusetts $58,320 (BLS OEWS, May 2026) (BLS OEWS, May 2026).
- West Virginia paid the least, $38,890 (BLS OEWS, May 2026).
What do nearby trades earn?
- Carpenters: median $60,580 across 670,090 jobs (BLS OEWS, May 2026) (BLS OEWS, May 2026).
- Drywall installers: $58,930 (BLS OEWS, May 2026).
- Tile and stone setters: $55,690 (BLS OEWS, May 2026).
- Roofers: $55,440 (BLS OEWS, May 2026).
- Painters: $49,400 (BLS OEWS, May 2026).
- Construction laborers: $47,120 (BLS OEWS, May 2026).
- Landscaping workers: $39,150, and janitors $36,840 (BLS OEWS, May 2026) (BLS OEWS, May 2026).
Do Handymen Need a License?
No national license exists. Each state sets its own dollar line, and the lines differ by thousands of dollars. Most states also drop the exemption if the job needs a permit, if the work is split into pieces, or if the worker advertises as a contractor.
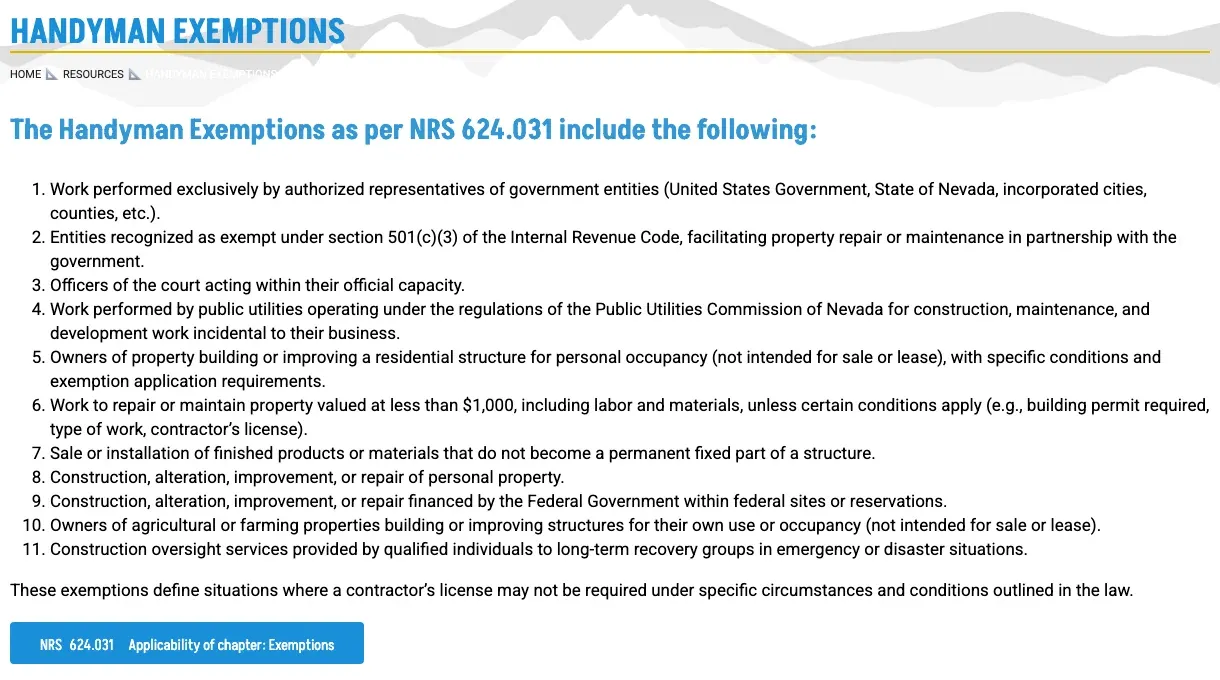 Figure 5: Nevada’s handyman exemptions under state law. Item 6 sets the limit for repair and maintenance work at under $1,000 including labor and materials, with conditions. Source: Nevada State Contractors Board, Handyman Exemptions, Oct 2026. Screenshot of the source page, captured 21 Oct 2026.
What is the dollar limit in each state?
- California requires a license for contracts of $1,000 or more in combined labor and materials (California Contractors State License Board, Oct 2026).
- California also requires one for any project that needs a building permit or uses employees (California Contractors State License Board, Oct 2026).
- Nevada exempts repair or maintenance work valued under $1,000, unless a permit or other condition applies (Nevada State Contractors Board, Oct 2026).
- Arizona exempts jobs under $1,000 in aggregate contract price (Arizona Revised Statutes 32-1121, Oct 2026).
- Arizona drops the exemption when a local building permit is required (Arizona Revised Statutes 32-1121, Oct 2026).
- Washington treats work under $500 as casual or minor (Washington RCW 18.27.090, Oct 2026).
- Washington and Florida both drop their exemptions for anyone who advertises as a contractor (Washington RCW 18.27.090, Oct 2026) (Florida Statutes 489.103, Oct 2026).
- South Carolina raised its line from $5,000 in May 2023 (South Carolina Code 40-11-30, Oct 2026).
How do other states handle it?
- Louisiana requires registration for home improvement work from $7,500 up to $50,000 (Louisiana State Licensing Board for Contractors, Jun 2025).
- Louisiana requires a residential license at $50,000 or more, or for any structural work (Louisiana State Licensing Board for Contractors, Jun 2025).
- Louisiana applicants for registration must show $100,000 in general liability insurance (Louisiana State Licensing Board for Contractors, Jun 2025).
- Virginia’s Class C license covers single contracts over $1,000 and under $30,000 (Code of Virginia 54.1-1100, Oct 2026).
- Virginia limits Class C firms to under $250,000 of work in any 12 months (Code of Virginia 54.1-1100, Oct 2026).
- Virginia requires a master tradesman license for electrical, plumbing and heating and cooling contractors (Code of Virginia 54.1-1100, Oct 2026).
Do trade licenses change the answer?
- The BLS says complex tasks may require a license or certification in a specialty, such as electrical or plumbing work (BLS Occupational Outlook Handbook, Aug 2026).
How Much Demand Is There for Small Jobs?
Small projects are where remodelers say the market is best. Households also pay for repairs they did not plan for, and they hire out most of what they do.
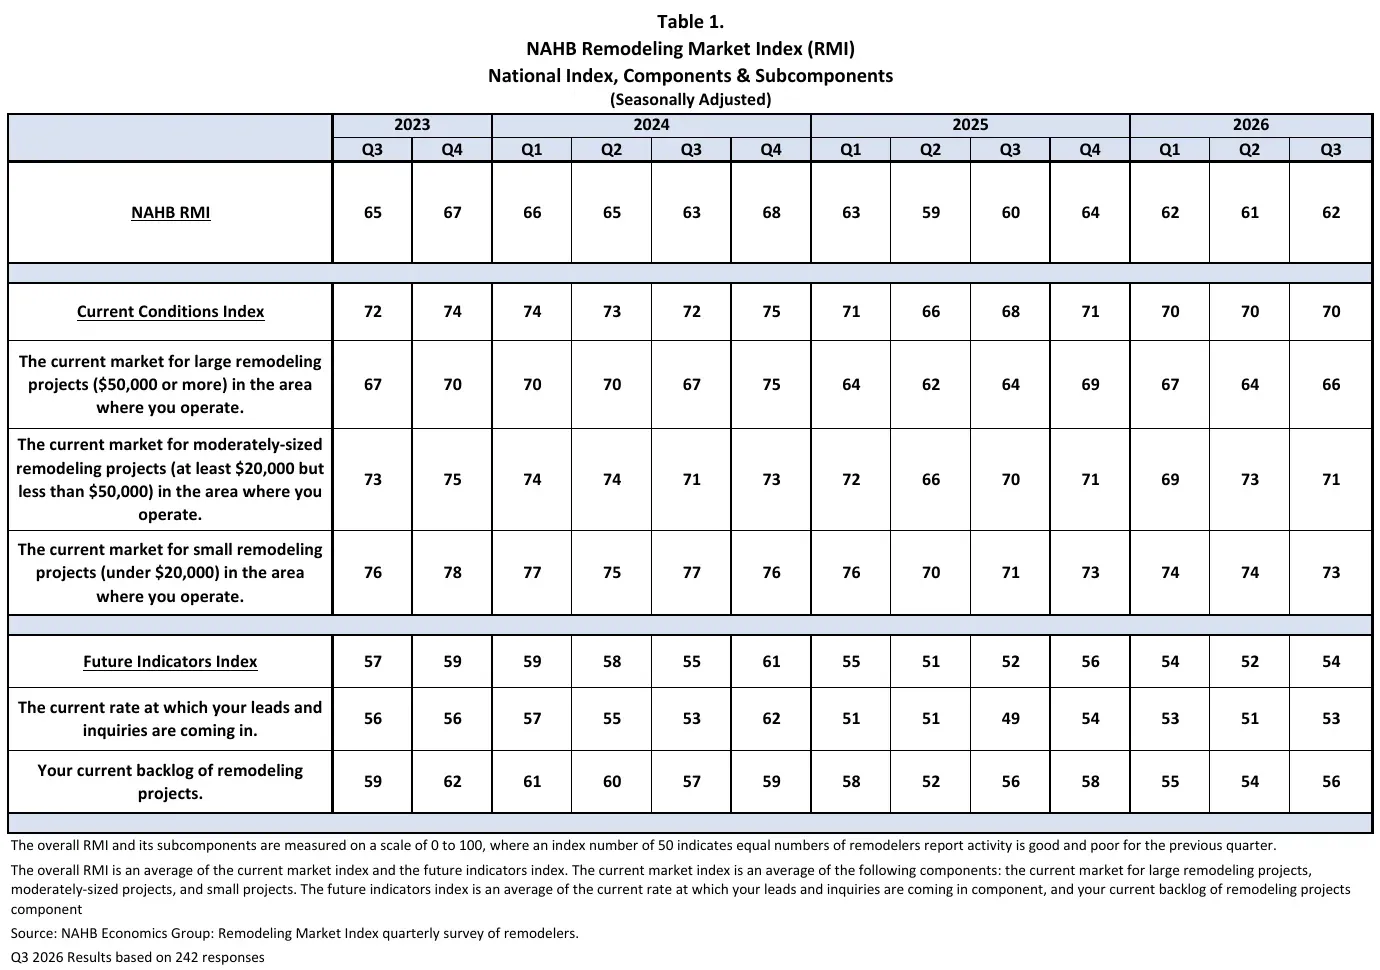 Figure 6: The NAHB Remodeling Market Index by quarter from the third quarter of 2023 through the third quarter of 2026. The small project line, for jobs under $20,000, has stayed above the other two since 2023. Source: NAHB, Remodeling Market Index, Third Quarter 2026, Oct 2026. Screenshot of the source PDF, captured 21 Oct 2026.
How strong is the market for small projects?
- Moderate projects of $20,000 to under $50,000 scored 71, and projects of $50,000 or more scored 66 (NAHB Remodeling Market Index, Oct 2026).
- The overall index was 62, up one point from the second quarter (NAHB Remodeling Market Index, Oct 2026).
- The leads and inquiries reading was 53, and the backlog reading was 56 (NAHB Remodeling Market Index, Oct 2026).
- The small project reading was 76 in the third quarter of 2023 and dipped to 70 in the second quarter of 2025 (NAHB Remodeling Market Index, Oct 2026).
- The third quarter of 2026 reading came from 242 remodeler responses (NAHB Remodeling Market Index, Oct 2026).
- NAHB’s chief economist said labor shortages, made worse by immigration enforcement and data center construction, are stretching project times (NAHB Remodeling Market Index, Oct 2026).
How often do households pay for repairs?
- 59% of adults had at least one major unexpected expense in the prior 12 months (Federal Reserve, Economic Well-Being of U.S. Households in 2025, May 2026).
- 63% of homeowners had one (Federal Reserve, Economic Well-Being of U.S. Households in 2025, May 2026).
- The typical cost of the most common major expenses, which include house and appliance repairs, was $1,000 to $1,999 (Federal Reserve, Economic Well-Being of U.S. Households in 2025, May 2026).
How much of the work do owners hire out?
These figures are our own tabulation of the public file for owner-occupied homes, weighted as the Census instructs. They cover projects in the two years before the 2023 survey.
- Owners reported 139.9 million projects (Census Bureau, American Housing Survey 2023, Jan 2025).
- 89.7 million of them were hired out (Census Bureau, American Housing Survey 2023, Jan 2025).
- 22.8% of hired projects with a reported cost cost $1,000 or less (Census Bureau, American Housing Survey 2023, Jan 2025).
- 40.3% cost $2,500 or less (Census Bureau, American Housing Survey 2023, Jan 2025).
- Plumbing fixture projects totaled 9.9 million, and the median hired one cost $990 (Census Bureau, American Housing Survey 2023, Jan 2025).
- Built-in dishwasher and disposal projects totaled 8.5 million, with a median hired cost of $690 (Census Bureau, American Housing Survey 2023, Jan 2025).
- Water heater projects totaled 7.9 million, with a median hired cost of $1,400 (Census Bureau, American Housing Survey 2023, Jan 2025).
A handyman who works through hundreds of $700 jobs sends a quote and an invoice for each one. A job under $1,000 still needs a written price, a clear scope and a paid bill. That paperwork is the part of the trade that software can take over.
How Do Handymen Find Customers?
Lead platforms sell new jobs by the lead, and the largest one just had a hard year. Pros pay for each match, and the number of leads fell sharply.
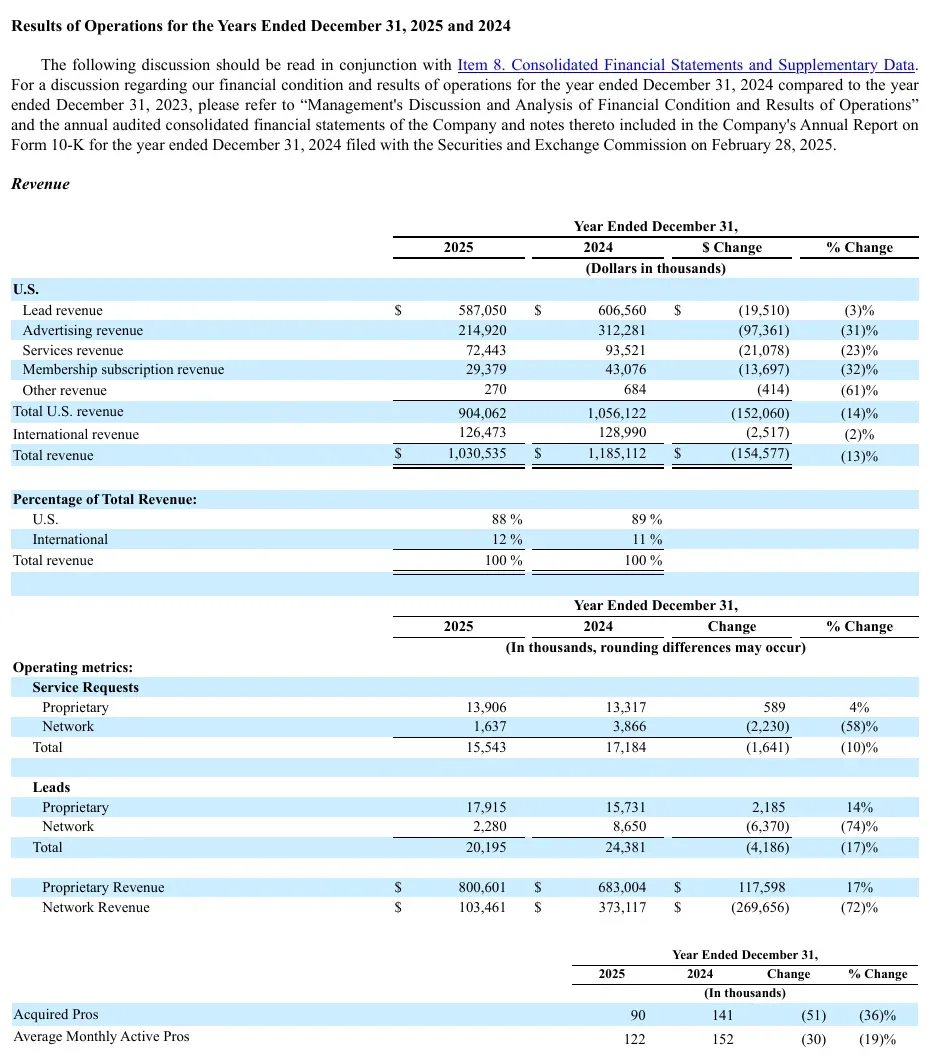 Figure 7: Angi’s 2025 results by revenue line and operating metric, including service requests, leads and active professionals, with the 2024 comparison. Source: Angi Inc., Form 10-K for fiscal 2025, Feb 2026. Screenshot of the source filing, captured 21 Oct 2026.
How big is the largest lead platform?
- Angi’s U.S. lead revenue, the fees pros pay for consumer matches, was $587.1 million, down 3% (Angi Inc., Form 10-K FY2025, Feb 2026).
- Total revenue was $1.03 billion, down 13% (Angi Inc., Form 10-K FY2025, Feb 2026).
- Leads fell 17% to 20.2 million (Angi Inc., Form 10-K FY2025, Feb 2026).
- Average monthly active pros fell 19% to 122,000 (Angi Inc., Form 10-K FY2025, Feb 2026).
- Newly acquired pros fell 36% to 90,000 (Angi Inc., Form 10-K FY2025, Feb 2026).
- Revenue from Angi’s own channels grew 17% to $800.6 million (Angi Inc., Form 10-K FY2025, Feb 2026).
- Revenue from third-party network channels fell 72% to $103.5 million after the company let homeowners choose which pros to contact in January 2025 (Angi Inc., Form 10-K FY2025, Feb 2026).
What does a pro have to do to get leads?
- Pros with an average rating below 3.5 are not eligible for approved status (Angi Inc., Form 10-K FY2025, Feb 2026).
- Business owners must pass criminal background checks and attest to state and local licensing (Angi Inc., Form 10-K FY2025, Feb 2026).
- There is no charge to enroll for pre-priced offerings, but pros pay a fee per referral (Angi Inc., Form 10-K FY2025, Feb 2026).
- The network spans more than 500 service categories (Angi Inc., Form 10-K FY2025, Feb 2026).
- Angi bought the household services platform Handy in 2018 (Angi Inc., Form 10-K FY2025, Feb 2026).
Is online still a minor channel?
- Angi’s own filing says the digital share of home services remains low, with most consumers still searching for, selecting and hiring pros offline (Angi Inc., Form 10-K FY2025, Feb 2026).
Do the big retailers count handymen as customers?
- The Home Depot names handymen among the Pro customers it serves (The Home Depot, Form 10-K FY2025, Mar 2026).
- Lowe’s says its Pro focus is small to medium sized pros in three groups: tradespeople, repair and remodelers, and property managers (Lowe’s, Form 10-K FY2025, Mar 2026).
Software that sends a clear quote within minutes of a call helps a small shop win the lead it already paid for. For how shops handle software today, see the CRM adoption numbers.
Where Is the Handyman Industry Headed?
Demand for this work is steady, not explosive. The jobs are projected to grow slightly faster than the average occupation, and many of the openings come from people who switch jobs or leave work.
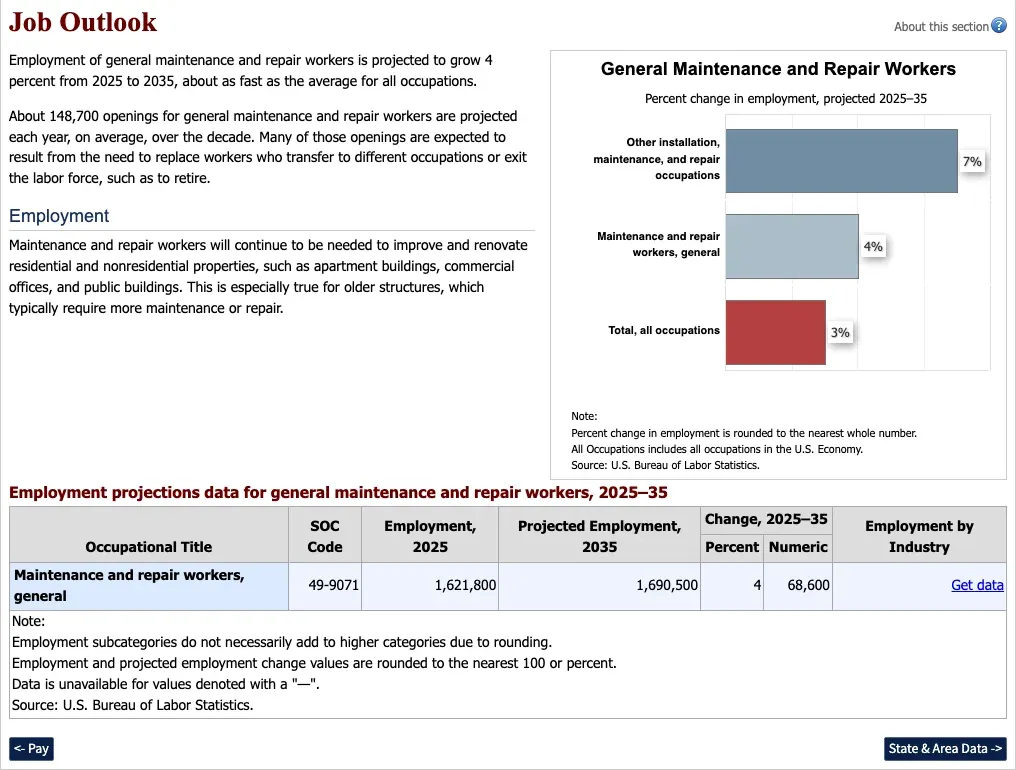 Figure 8: Projected employment change from 2025 to 2035 for general maintenance and repair workers, other installation, maintenance and repair jobs, and all occupations, with the projections table below the chart. Source: BLS Occupational Outlook Handbook, General Maintenance and Repair Workers, Job Outlook, Aug 2026. Chart published by the source, captured 21 Oct 2026.
How fast will the occupation grow?
- The BLS projects 1,690,500 jobs by 2035, up 68,600 or 4.2% (BLS Employment Projections, Aug 2026).
- All occupations are projected to grow 3.5% (BLS Employment Projections, Aug 2026).
- About 148,700 openings a year are expected, mostly from workers who change jobs or leave the labor force (BLS Occupational Outlook Handbook, Aug 2026).
- The BLS ties demand to older structures, which need more maintenance and repair (BLS Occupational Outlook Handbook, Aug 2026).
- The typical entry route is a high school diploma and moderate-term on-the-job training (BLS Employment Projections, Aug 2026).
How fast are nearby trades growing?
- Carpenters are projected to grow 3.9% (BLS Employment Projections, Aug 2026).
- Painters, 3.0%, and drywall installers, 2.5% (BLS Employment Projections, Aug 2026) (BLS National Employment Matrix, Aug 2026).
- Roofers, 5.3%, and construction laborers, 7.3% (BLS National Employment Matrix, Aug 2026) (BLS National Employment Matrix, Aug 2026).
- Tile and stone setters, 9.8% (BLS National Employment Matrix, Aug 2026).
- Home appliance repairers, 1.9%, and locksmiths, down 11.7% (BLS National Employment Matrix, Aug 2026) (BLS National Employment Matrix, Aug 2026).
What are the risks of the job?
- The BLS says general maintenance and repair workers have one of the highest rates of injuries and illnesses of all occupations (BLS Occupational Outlook Handbook, Aug 2026).
- Common injuries are sprains, cuts and fractures (BLS Occupational Outlook Handbook, Aug 2026).
- 58% of self-employed adults said their income varied from month to month (Federal Reserve, Economic Well-Being of U.S. Households in 2025, May 2026).
Glossary
- Nonemployer: a business with no paid staff, such as a solo handyman.
- Establishment: one physical location of a business.
- CBP: County Business Patterns, the Census Bureau’s yearly count of locations, jobs and payroll.
- SUSB: Statistics of U.S. Businesses, the Census Bureau’s company-level count.
- OEWS: Occupational Employment and Wage Statistics, the BLS survey of employers.
- NAICS: the North American Industry Classification System, the code list used for businesses.
- AHS: American Housing Survey, run by the Census Bureau for HUD.
- RMI: Remodeling Market Index, a quarterly survey of remodelers by NAHB.
- NAHB: National Association of Home Builders.
- Pro: a service professional listed on a lead platform.
Methodology and Sources
Each statistic comes from the agency, company filing or survey that produced it, and each link points to that document. No roundup pages are used as sources. The government has no handyman category, so the page uses two stand-ins: residential remodelers (NAICS 236118, the code that lists “handyman construction service, residential building”) and general maintenance and repair workers (SOC 49-9071). Those groups also include remodeling firms and in-house building staff. Figures marked as our own division or tabulation were computed from the public files named in the citation. State license limits were read from state agency pages and statutes on 21 October 2026, and the date shown for them is the read date. BLS wage and employment values for May 2025 were read from the BLS public data API. The page is refreshed monthly.
Sources
- Census Bureau, County Business Patterns 2023
- Census Bureau, County Business Patterns 2019
- Census Bureau, Statistics of U.S. Businesses 2022
- Census Bureau, Nonemployer Statistics 2024
- Census Bureau, 2022 Economic Census
- Census Bureau, 2022 Economic Census Kind of Business
- BLS OEWS
- BLS National Employment Matrix
- BLS Occupational Outlook Handbook
- Florida Statutes 489.103
- South Carolina Code 40-11-30
- NAHB Remodeling Market Index
- Federal Reserve, Economic Well-Being of U.S. Households in 2025
- Census Bureau, American Housing Survey 2023
- Angi Inc., Form 10-K FY2025
- Census Bureau, 2022 NAICS Index File
- Census Bureau, Nonemployer Statistics 2022
- Census Bureau, County Business Patterns 2023 State Files
- BLS Employment Projections
- BLS OEWS
- BLS OEWS
- BLS OEWS
- BLS OEWS
- BLS National Employment Matrix
- BLS National Employment Matrix
- BLS National Employment Matrix
- BLS National Employment Matrix
- BLS National Employment Matrix
- BLS National Employment Matrix
- BLS National Employment Matrix
- BLS OEWS
- BLS OEWS
- BLS OEWS
- BLS OEWS
- BLS OEWS
- BLS OEWS
- BLS OEWS
- BLS OEWS
- BLS OEWS
- BLS OEWS
- BLS OEWS
- BLS OEWS
- BLS OEWS
- BLS OEWS
- BLS OEWS
- BLS OEWS
- BLS OEWS
- BLS OEWS
- BLS OEWS
- BLS OEWS
- BLS OEWS
- BLS OEWS
- BLS OEWS
- BLS OEWS
- BLS OEWS
- California Contractors State License Board
- Nevada State Contractors Board
- Arizona Revised Statutes 32-1121
- Washington RCW 18.27.090
- Louisiana State Licensing Board for Contractors
- Code of Virginia 54.1-1100
- The Home Depot, Form 10-K FY2025
- Lowe’s, Form 10-K FY2025
- BLS National Employment Matrix
- Census Bureau, County Business Patterns 2023, table CB2300CBP
- Census Bureau, 2022 Economic Census, table EC2200BASIC