Plumbing statistics describe a trade that pays above the national median, is projected to keep growing, and still has trouble finding people. Most plumbers learn on the job, most states license them, and most of them work for small contractors.
This page collects the numbers on the plumber workforce: how many plumbers there are, what they earn, who hires them, how demand and shortages look, how people become plumbers, and how often plumbers get hurt. Every figure comes from the agency, regulator, association or research body that produced it, and every figure is dated and linked.
Some federal tables group plumbers with pipefitters and steamfitters. Where a source does that, the text says so. This page does not cover market size, shop counts or revenue, and it does not cover water damage, leaks or appliances.
Key Takeaways
- Plumbers, pipefitters, and steamfitters held 510,600 jobs in 2025 (BLS Occupational Outlook Handbook, Aug 2026).
- Median pay was $63,800 a year in May 2025, against $50,980 for all occupations (BLS Occupational Outlook Handbook, Aug 2026).
- Employment is projected to grow 7 percent from 2025 to 2035, with about 42,000 openings a year (BLS Occupational Outlook Handbook, Aug 2026).
- 45% of home builders reported a serious or some shortage of plumbers in September 2026 (NAHB, Oct 2026).
- 88% of construction firms with craft openings said those jobs were as hard or harder to fill than a year earlier (AGC and NCCER 2026 Workforce Survey, Sep 2026).
- The median plumber earned $99,950 in Illinois and $48,660 in Arkansas (BLS OEWS, May 2025).
- Women were 3.1% of employed plumbers, pipefitters, and steamfitters in 2025 (BLS Current Population Survey, Feb 2026).
- 81.7% of construction payroll establishments had 10 or fewer employees (CPWR, Sep 2025).
- 480,399 apprentices were served in the construction industry in 2025 (Apprenticeship.gov, Feb 2026).
- A Texas journeyman plumber license needs at least 8,000 hours of experience (Texas State Board of Plumbing Examiners, Oct 2026).
- Plumbers lost time to injury at 144.5 cases per 10,000 full-time workers in 2023-24, against 86.6 for all occupations (BLS Injuries and Illnesses, Jan 2026).
- 36 plumbers, pipefitters, and steamfitters died from work injuries in 2024 (BLS Fatal Injuries, Feb 2026).
- Employers with fewer than 20 employees had 75% of fatal falls in construction from 2015 to 2017, but 39% of payroll employment (NIOSH, May 2024).
How Many Plumbers Work in the United States?
The headcount depends on who is counting. Federal surveys measure different things, so one trade gets several totals, and the gaps are worth understanding before you quote any of them.
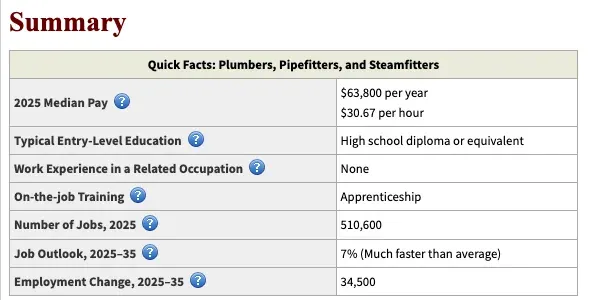 Figure 1: The Bureau of Labor Statistics sums up the trade in one table: pay, entry education, training route, jobs and growth. Use it as the starting point and read the other counts below as variations on the same trade. Source: BLS, Occupational Outlook Handbook: Plumbers, Pipefitters, and Steamfitters, Aug 2026. Screenshot of the source page, captured 21 Oct 2026.
Why do federal surveys count different numbers of plumbers?
The employer survey counts payroll jobs, the projections program adds the self-employed, and the household survey counts people. Expect the totals to differ.
- The projections program counted 470,000 wage and salary plumber jobs in 2025 (BLS Employment Projections, Aug 2026).
- It added 40,700 self-employed plumbers, pipefitters, and steamfitters for 2025 (BLS Employment Projections, Aug 2026).
- The employer survey counted 465,840 wage and salary employees in May 2025 and leaves out the self-employed (BLS OEWS, May 2025).
- The household survey counted 624,000 employed plumbers, pipefitters, and steamfitters in its 2025 annual average (BLS Current Population Survey, Feb 2026).
- Electricians numbered 1,063,000 and heating, air conditioning, and refrigeration mechanics 561,000 in the same household survey (BLS Current Population Survey, Feb 2026).
Which industries employ plumbers?
Plumbing, heating, and air-conditioning contractors are the main employer, and the jobs sit mostly in small private firms.
- 65% of plumber jobs were in plumbing, heating, and air-conditioning contractors in 2025 (BLS Occupational Outlook Handbook, Aug 2026).
- That industry held 332,300 plumber jobs, and plumbers were 25.2% of all its jobs (BLS Employment Projections, Aug 2026).
- The construction sector as a whole held 385,400 plumber jobs, or 75.5% of the total (BLS Employment Projections, Aug 2026).
- Government, heavy and civil engineering construction, and manufacturing each employed 3% of plumbers (BLS Occupational Outlook Handbook, Aug 2026).
Which states employ the most plumbers?
Population explains most of the ranking. A location quotient above 1.0 means a state has more plumbers than its size predicts.
- California employed 47,660 plumbers and Texas 44,090 in May 2025 (BLS OEWS, May 2025).
- Florida employed 29,260 and New York 23,210 (BLS OEWS, May 2025).
- Louisiana had the highest concentration of any state, with a location quotient of 1.44 (BLS OEWS, May 2025).
How Much Do Plumbers Earn?
Plumbing pays well without a college degree, and the gap between the bottom and the top of the pay scale is wide. Where you work and who you work for matter as much as the trade itself.
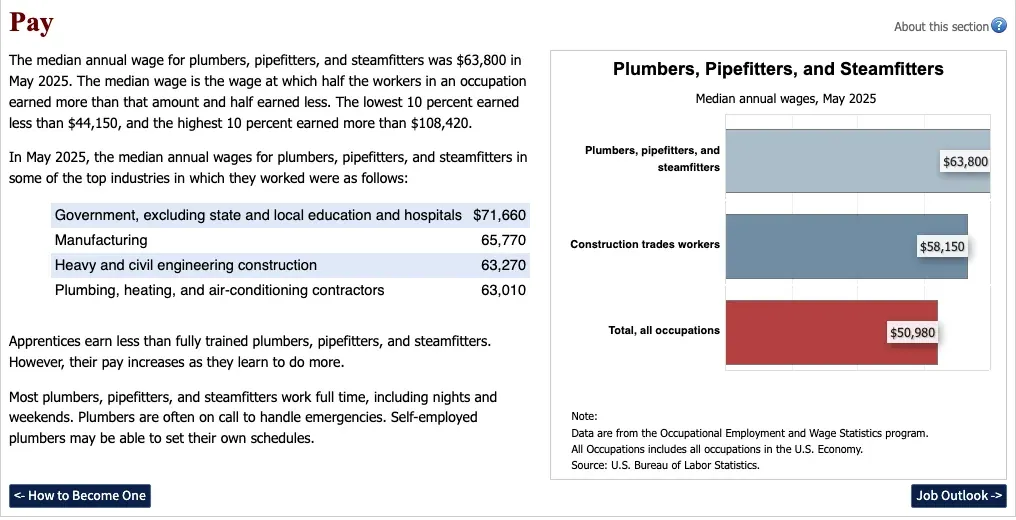 Figure 2: Plumbers out-earn the construction trades average, which in turn out-earns the all-occupation median. Apprentices earn less while they train, and pay rises as they learn more tasks. Source: BLS, Occupational Outlook Handbook: Plumbers, Pipefitters, and Steamfitters, Pay, Aug 2026. Screenshot of the source page, captured 21 Oct 2026.
What do plumbers earn per hour and per year?
The median plumber earned $30.67 an hour in May 2025, and the middle half of plumbers fell between two clear bounds.
- The median hourly wage was $30.67 (BLS Occupational Outlook Handbook, Aug 2026).
- The mean wage was $72,170 a year, or $34.70 an hour (BLS OEWS, May 2025).
- The 25th percentile earned $50,190 and the 75th percentile $85,110 (BLS OEWS, May 2025).
- The lowest 10 percent earned less than $44,150 and the highest 10 percent more than $108,420 (BLS Occupational Outlook Handbook, Aug 2026).
- Helpers to plumbers and pipefitters had a median wage of $42,360 (BLS OEWS, May 2025).
How does plumber pay compare with other trades?
Plumbers sit at the top of the skilled trades, level with electricians and ahead of most others.
- Construction trades workers as a group had a median wage of $58,150 (BLS Occupational Outlook Handbook, Aug 2026).
- Electricians had a median of $63,190 and HVAC mechanics $61,010 (BLS OEWS, May 2025).
- Carpenters had a median of $60,580 and roofers $55,440 (BLS OEWS, May 2025).
- NAHB’s analysis of BLS data put the top quartile of plumbers in construction above $83,360 (NAHB, Jun 2026).
- Average hourly earnings of production and nonsupervisory construction employees were $39.36 in August 2026, up 5.0% in a year, in AGC’s analysis of BLS data (AGC, Sep 2026).
Which employers pay plumbers the most?
Government pays the most, and private contractors pay near the middle of the range.
- Government jobs paid a median of $71,660, manufacturing $65,770 and heavy and civil engineering construction $63,270 (BLS Occupational Outlook Handbook, Aug 2026).
- Plumbing, heating, and air-conditioning contractors paid a median of $63,010 (BLS Occupational Outlook Handbook, Aug 2026).
Which states pay plumbers the most?
State medians range widely, and the top of the range is roughly double the bottom.
- The District of Columbia paid a median of $101,020 and Oregon $97,050 (BLS OEWS, May 2025).
- Minnesota paid $94,410 and Massachusetts $93,880 (BLS OEWS, May 2025).
- Washington paid $81,030 and New York $77,490 (BLS OEWS, May 2025).
- California paid $72,830 (BLS OEWS, May 2025).
- Texas paid $59,840 and Florida $52,910 (BLS OEWS, May 2025).
What Is the Job Outlook for Plumbers?
Growth is faster than the national average, and a second source of demand is replacement of people who leave. Both come from the same federal projections.
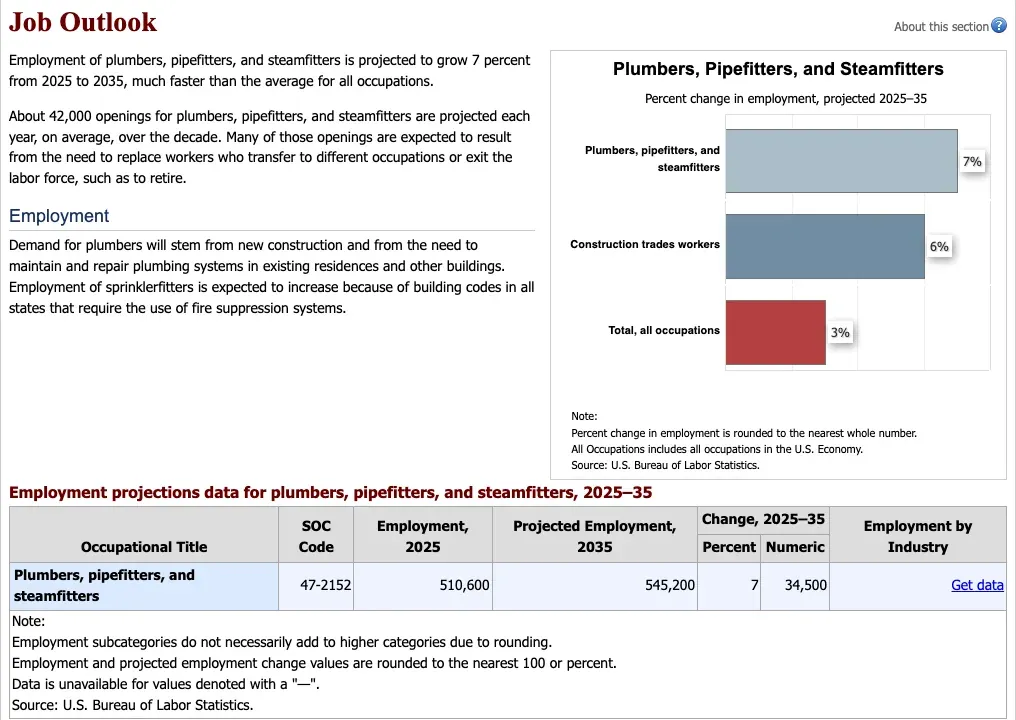 Figure 3: Plumber employment is projected to grow faster than both the construction trades and the whole economy, and the Handbook ties that demand to new construction and to repair of plumbing in existing buildings. Source: BLS, Occupational Outlook Handbook: Plumbers, Pipefitters, and Steamfitters, Job Outlook, Aug 2026. Screenshot of the source page, captured 21 Oct 2026.
How many jobs will the trade add?
The projection adds jobs on top of the openings created when people retire or change careers.
- BLS projects 34,500 more jobs by 2035, taking employment to 545,200 (BLS Occupational Outlook Handbook, Aug 2026).
- Construction trades workers are projected to grow 6 percent and all occupations 3 percent (BLS Occupational Outlook Handbook, Aug 2026).
- Plumbing, heating, and air-conditioning contractors are projected to add 26,900 plumber jobs, an 8.1% rise, reaching 359,200 (BLS Employment Projections, Aug 2026).
- Self-employed plumbers are projected to rise from 40,700 to 42,500 (BLS Employment Projections, Aug 2026).
Is the trade losing tradespeople overall?
Construction trades have shrunk as a share of the construction workforce even as the trade as a whole holds steady.
- Construction trades workers numbered 7.1 million in 2024, or 58.8% of the construction labor force, against 8.5 million at the 2006 peak (NAHB, Apr 2026).
- O*NET lists plumbers, pipefitters, and steamfitters as a Bright Outlook occupation, updated for 2026 (O*NET OnLine, Oct 2026).
Is There a Plumber Shortage?
Yes, by every survey that asks. The shortage is steady rather than worsening for plumbers, but contractors still spend more to hire and keep people.
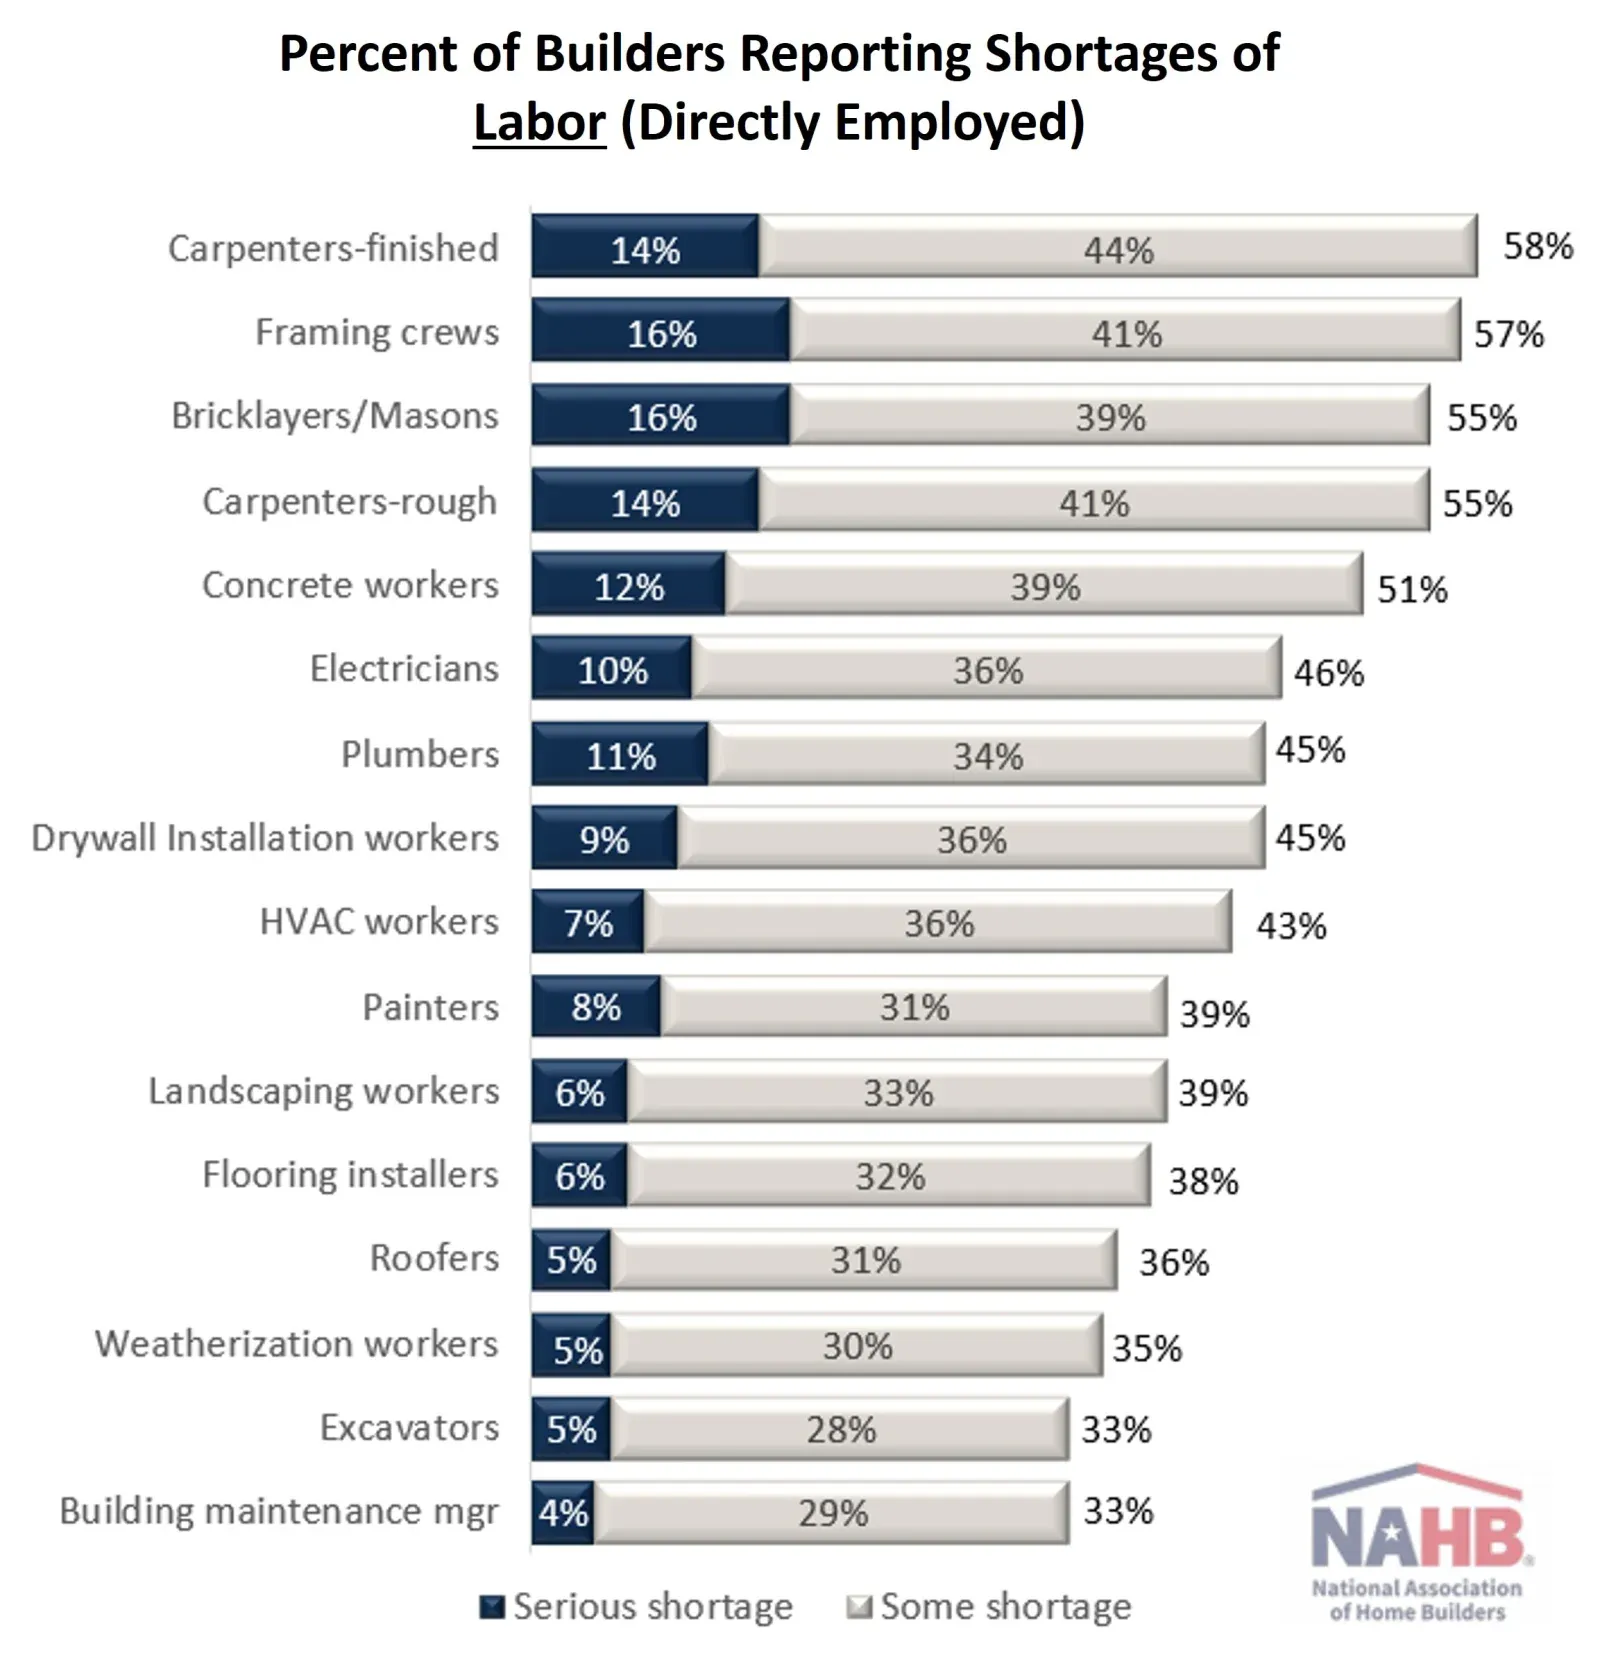 Figure 4: Plumbers sit in the middle of NAHB’s 16-trade shortage ranking, a little below electricians and well below finished carpenters. Most of each bar is “some shortage,” so even builders who find workers report strain. Source: NAHB, Labor Shortages a Growing Problem, Oct 2026. Chart published by the source, captured 21 Oct 2026.
What share of builders cannot find plumbers?
NAHB asks builders about 16 trades each time. Plumbers land near the middle of the pack.
- 11% of builders reported a serious plumber shortage and 34% reported some shortage (NAHB, Oct 2026).
- Builders reported shortages of HVAC workers at 43%, finished carpenters at 58% and excavators at 33% (NAHB, Oct 2026).
- Electricians were at 46% (NAHB, Oct 2026).
- The plumber reading did not change from April 2025, while the other 14 trades listed rose at least slightly (NAHB, Oct 2026).
- Across the nine trades NAHB has tracked since 1996, shortages averaged 47% in September 2026, up from 42% in April 2025 (NAHB, Oct 2026).
- That average is higher than at any time in 2004-2006, when housing starts were consistently over 1.8 million a year (NAHB, Oct 2026).
- Builders reported a median 4.2% rise in the cost of labor for the same home over 12 months (NAHB, Oct 2026).
- A 2020 NAHB study found builders subcontract 84% of the cost of a single-family home and use two dozen subcontractors on average (NAHB, Oct 2026).
What do contractors say about hiring?
The Associated General Contractors of America and NCCER ran a joint survey in 2026. Their answers cover all craft trades, with plumbers a named group.
- The survey was conducted in July and August 2026 and drew 1,830 responses (AGC, Sep 2026).
- 87% of firms had openings for hourly craft workers (AGC and NCCER 2026 Workforce Survey, Sep 2026).
- 50% of firms with craft openings said those jobs were harder to fill than a year earlier (AGC and NCCER 2026 Workforce Survey, Sep 2026).
- Roughly three-quarters of firms with plumber openings reported difficulty filling them (AGC and NCCER 2026 Workforce Survey, Sep 2026).
- Difficulty was reported by 81% of firms hiring electricians and 77% of firms hiring HVAC technicians (AGC and NCCER 2026 Workforce Survey, Sep 2026).
- 50% said available candidates lack the skills, certificate or license for the job (AGC and NCCER 2026 Workforce Survey, Sep 2026).
- 42% said new hires fail to show up or quit shortly after starting (AGC and NCCER 2026 Workforce Survey, Sep 2026).
- 83% saw at least some turnover among new field employees in their first 90 days (AGC and NCCER 2026 Workforce Survey, Sep 2026).
- 37% cut headcount by at least five percent in the past year and 34% raised it by that much (AGC and NCCER 2026 Workforce Survey, Sep 2026).
- 73% expect to add employees in the next 12 months, and 8% expect to cut (AGC and NCCER 2026 Workforce Survey, Sep 2026).
- 42% said worker shortages delayed projects, the most common cause of delay (AGC and NCCER 2026 Workforce Survey, Sep 2026).
- Among firms reporting on data centers, 58% said those projects raised competition for skilled workers and 49% said they raised wage pressure (AGC and NCCER 2026 Workforce Survey, Sep 2026).
- 29% reported at least one direct or indirect effect from immigration enforcement in the past six months (AGC and NCCER 2026 Workforce Survey, Sep 2026).
Are shops paying more to keep workers?
Most firms raised pay again, and that pushes labor cost into every job price.
- 55% of firms raised base pay for hourly craft workers by more than they did a year earlier, and 29% by about the same (AGC and NCCER 2026 Workforce Survey, Sep 2026).
- 35% started or raised spending on training and professional development (AGC and NCCER 2026 Workforce Survey, Sep 2026).
- The unemployment rate among recent construction workers fell to 3.1% in August 2026, the lowest in the 26-year history of the data (AGC, Sep 2026).
How many construction jobs are open?
Openings in construction are well above a year ago, though far below the all-industry total.
- Construction had 251,000 job openings in August 2026 (preliminary), a rate of 2.9% (BLS JOLTS, Aug 2026).
- A year earlier, in August 2025, it had 213,000 (BLS JOLTS, Aug 2025).
- All industries together had 7.1 million openings in August 2026 (BLS JOLTS, Aug 2026).
What Is Driving Demand for Plumbers?
Plumbers get work from two places: new buildings and the repair of old ones. New building is soft right now, so repair and remodeling carry more of the weight.
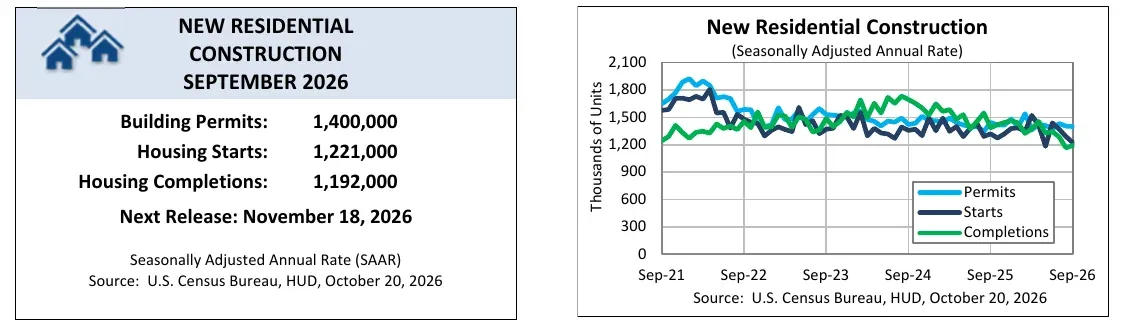 Figure 5: Permits, starts and completions have all drifted down since 2021. Every new home needs rough-in and finish plumbing, so this chart is a leading signal for new-construction plumbing work. Source: U.S. Census Bureau and HUD, Monthly New Residential Construction, September 2026, Oct 2026. Chart published by the source, captured 21 Oct 2026.
How many new homes are being built?
Starts fell year over year, and completions fell faster.
- Housing starts ran at a seasonally adjusted annual rate of 1,221,000 in September 2026, 7.4% below September 2025 (U.S. Census Bureau, Oct 2026).
- Single-family starts were at a rate of 859,000 (U.S. Census Bureau, Oct 2026).
- Building permits were at a rate of 1,400,000 (U.S. Census Bureau, Oct 2026).
- Completions were at a rate of 1,192,000, 14.0% below September 2025 (U.S. Census Bureau, Oct 2026).
- Residential construction spending was at a rate of $882.3 billion in August 2026, within total construction spending of $2,203.1 billion (U.S. Census Bureau, Oct 2026).
- Residential builders and subcontractors together employed 19,800 fewer people in August 2026 than a year earlier (AGC, Sep 2026).
Does repair and remodeling work keep plumbers busy?
Older homes and a steady remodeling market give plumbers work that does not depend on new housing starts.
- The median age of owner-occupied homes reached 42 years in the 2024 American Community Survey (NAHB, Mar 2026).
- New York had the oldest owner-occupied homes at a median of 64 years, and Texas was among the newest at 28 (NAHB, Mar 2026).
- 73% of remodelers rated bathroom remodeling common or very common for their company in 2025, making it the most common project (NAHB, Jan 2026).
- The NAHB Remodeling Market Index read 62 in the first quarter of 2026, still above the neutral line of 50 (NAHB, Apr 2026).
- Remodelers said 21% of their projects were home improvements made soon after a purchase (NAHB, Apr 2026).
Who Works as a Plumber?
The typical plumber is a man around age 40 who works for a small firm. The trade is not older than construction as a whole, and very few women work in it.
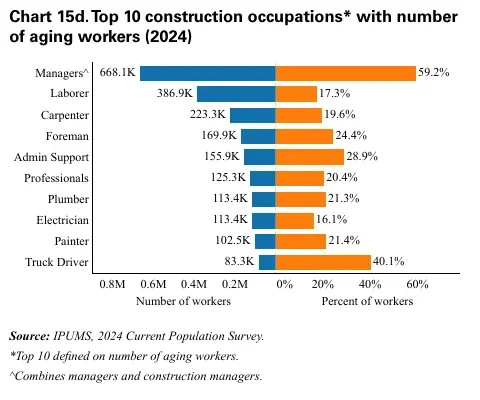 Figure 6: Plumbers are among the construction occupations with the most workers aged 55 and over, and a fifth of the trade is in that group. Retirements will create openings for the next few years. Source: CPWR, The Construction Chart Book 7th edition, Chart 15d, Sep 2025. Chart published by the source, captured 21 Oct 2026.
How old are plumbers?
Plumbers skew slightly younger than the average worker.
- The median age of employed plumbers, pipefitters, and steamfitters was 40.2, against 42.1 for all workers (BLS Current Population Survey, Feb 2026).
- 21.3% of plumbers were 55 or older in 2024, which is 113,400 workers (CPWR, Sep 2025).
- The same share across all of construction was 21.7% (CPWR, Sep 2025).
Who is in the trade?
The trade is mostly male and mostly white, with a large Hispanic share.
- Women were 47.1% of all employed people in 2025 (BLS Current Population Survey, Feb 2026).
- 30.3% of plumbers were Hispanic or Latino, against 20.0% of all employed people (BLS Current Population Survey, Feb 2026).
- 7.1% were Black or African American and 2.8% were Asian (BLS Current Population Survey, Feb 2026).
- Foreign-born workers were 26.3% of the construction workforce in 2024, and one in three craftsmen (NAHB, Apr 2026).
- 43% of respondents said new plumbers need a post-secondary certificate, 35% a high school diploma and 9% an associate’s degree (O*NET OnLine, Oct 2026).
What benefits and union coverage do plumbers have?
Plumbers are far more likely than the average construction worker to belong to a union. Employer health insurance is still missing for some.
- 19.0% of plumbers belonged to a union in 2022-2024, against 11.7% across construction (CPWR, Sep 2025).
- The overall union membership rate for all workers was 10.0% in 2025 (BLS Union Members, Feb 2026).
- 15.2% of plumbers did not receive health insurance from an employer in 2024 (CPWR, Sep 2025).
- 27.1% of plumbers took part in a work pension plan, against 25.5% of construction workers and 34.0% across all industries (CPWR, Sep 2025).
How many construction workers work for themselves?
Self-employment and tiny firms are the norm in construction, which is the setting for the owner-operator plumber.
- 22.5% of construction workers were self-employed in 2024, against 10.4% across all industries (CPWR, Sep 2025).
- 59.3% of self-employed construction workers were unincorporated (CPWR, Sep 2025).
- Establishments with 10 or fewer employees held 23.7% of the construction workforce (CPWR, Sep 2025).
How Long Does a Plumbing Apprenticeship Take?
The standard route is an apprenticeship that pays you while you learn. It takes years, and the pool of new apprentices is growing, not shrinking.
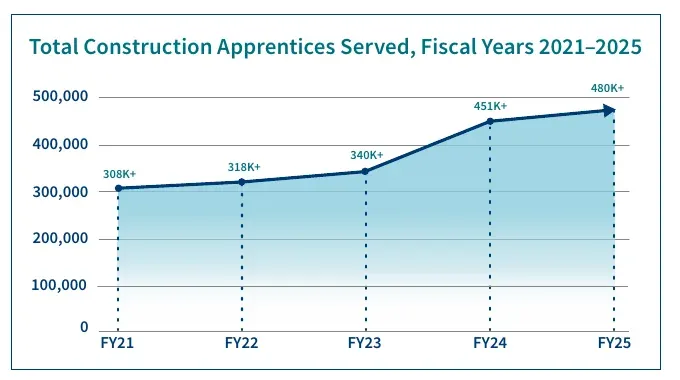 Figure 7: Registered apprenticeship in construction has grown every year since fiscal 2021, with the sharpest jump between fiscal 2023 and 2024. Plumbing is one of the largest apprenticeable construction trades. Source: U.S. Department of Labor, Registered Apprenticeship: Construction fact sheet, Feb 2026. Chart published by the source, captured 21 Oct 2026.
How long is the training?
The Handbook describes a long, paid path with no prior experience needed.
- Most plumbers learn through a 4- or 5-year apprenticeship with about 2,000 hours of paid on-the-job training each year (BLS Occupational Outlook Handbook, Aug 2026).
- The typical entry-level education is a high school diploma or equivalent, with no work experience in a related occupation required (BLS Occupational Outlook Handbook, Aug 2026).
- NCCER curricula cover more than 40 craft areas, and more than 1,000 accredited organizations provide the training (NCCER, Oct 2026).
How many people are apprentices?
Construction apprenticeships have grown every year since fiscal 2021, and plumbers are a large share.
- Construction apprentices served rose from 308,000 in fiscal 2021 to 451,000 in fiscal 2024 (Apprenticeship.gov, Feb 2026).
- The 2025 total was a 28% increase over the past five years (Apprenticeship.gov, Feb 2026).
- Plumbers, including pipefitters, steamfitters and gas fitters, were 16.6% of active construction apprentices in 2023 (CPWR, Sep 2025).
- Electricians were the largest group at 29.9%, and carpenters were third at 11.0% (CPWR, Sep 2025).
- The top four apprentice trades held 65.7% of active apprentices (CPWR, Sep 2025).
- Construction had 91,200 new apprentice registrations in 2023, and 24.0% were Hispanic (CPWR, Sep 2025).
How do shops find apprentices?
Firms are recruiting more online and in schools.
- 49% of firms added or increased online recruiting, such as social media and targeted digital advertising (AGC and NCCER 2026 Workforce Survey, Sep 2026).
- 48% increased engagement with high school, college and career and technical education programs (AGC and NCCER 2026 Workforce Survey, Sep 2026).
- 25% started or expanded in-person, onsite craft training (AGC and NCCER 2026 Workforce Survey, Sep 2026).
What Does It Take to Get a Plumbing License?
Licensing is set by each state, so the hours, exams and tiers differ. The examples below show the range, from a few months of experience for a limited license to six years for a contractor.
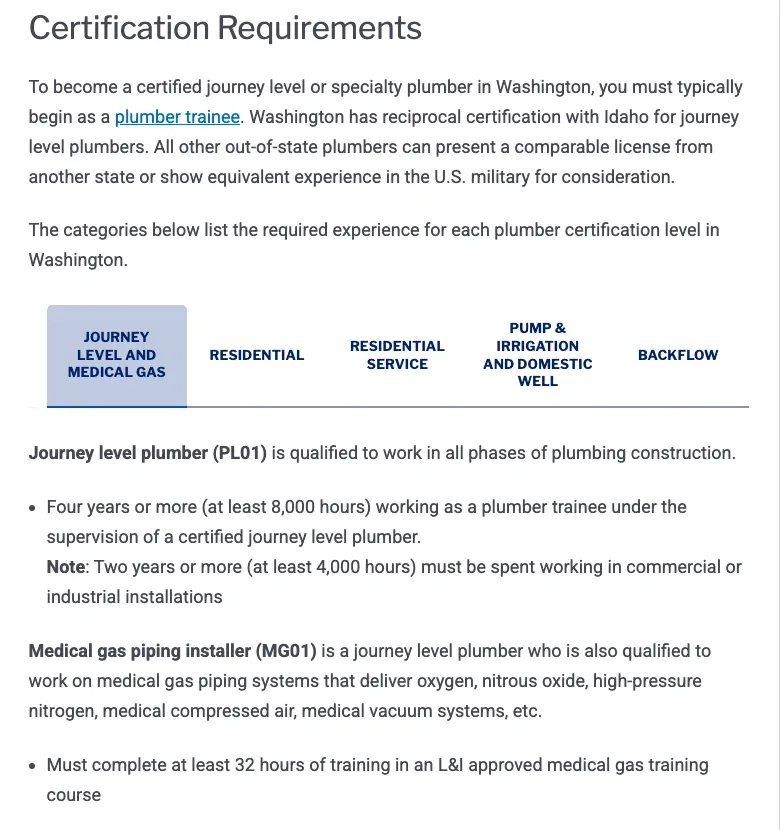 Figure 8: Washington spells out the experience each certification level needs, and requires certification to work in the plumbing trade. Other states use different hours, but most use the same tiers of trainee, journey level and contractor. Source: Washington State Department of Labor & Industries, Plumber Certification, Oct 2026. Screenshot of the source page, captured 21 Oct 2026.
Do states require a plumbing license?
Most do, and the Handbook gives a typical range.
- Most states and some localities require plumbers to be licensed, often after 2 to 5 years of experience and an exam (BLS Occupational Outlook Handbook, Aug 2026).
What does a journey-level license need?
Journey level is the license that lets a plumber work without supervision.
- Texas also requires a 48-hour training course, unless the applicant is in or has completed a US Department of Labor approved apprenticeship (Texas State Board of Plumbing Examiners, Oct 2026).
- The Texas journeyman exam application carries a $40 fee (Texas State Board of Plumbing Examiners, Oct 2026).
- Washington’s journey-level certification needs 4 years, at least 8,000 hours, as a trainee, with at least 4,000 hours in commercial or industrial work (Washington State Department of Labor & Industries, Oct 2026).
- Illinois requires a minimum of 4 years as a licensed apprentice before the plumber exam (Illinois Department of Public Health, Oct 2026).
- Massachusetts requires 3 years as an apprentice and 300 hours of theory (Massachusetts Board of State Examiners of Plumbers and Gas Fitters, Oct 2026).
- South Dakota requires 4 years as an apprentice at 1,900 hours or more a year (South Dakota Plumbing Commission, Oct 2026).
Are there shorter or limited licenses?
Several states split the trade into narrower licenses with lower hour requirements.
- Washington’s residential plumber certification needs at least 6,000 hours over 3 years (Washington State Department of Labor & Industries, Oct 2026).
- Its residential service certification needs at least 4,000 hours over 2 years, and the first 2,000 hours must be under direct supervision (Washington State Department of Labor & Industries, Oct 2026).
- Washington’s domestic well certification needs at least 2,000 hours over 1 year (Washington State Department of Labor & Industries, Oct 2026).
- Medical gas piping installers need at least 32 hours of approved training on top of a journey-level certification (Washington State Department of Labor & Industries, Oct 2026).
- North Carolina’s restricted limited plumbing contractor exam needs 9 months, or 1,500 hours, of experience (North Carolina State Board of Examiners of Plumbing, Heating and Fire Sprinkler Contractors, Oct 2026).
What does a contractor license need?
The shop owner’s license is where experience requirements climb.
- South Dakota’s plumbing contractor license needs 6 years of experience, at least 2 of them as a plumbing contractor or plumber (South Dakota Plumbing Commission, Oct 2026).
- North Carolina’s plumbing and heating contractor exam needs 2 years, or 4,000 hours, of on-site experience (North Carolina State Board of Examiners of Plumbing, Heating and Fire Sprinkler Contractors, Oct 2026).
- Massachusetts requires a master plumber to have worked a year as a journeyman and finished 100 hours of advanced theory (Massachusetts Board of State Examiners of Plumbers and Gas Fitters, Oct 2026).
- Illinois licenses about 8,900 plumbers and 2,000 apprentice plumbers (Illinois Department of Public Health, Oct 2026).
- Illinois apprentices who do not apply for the exam, or fail it, lose eligibility to renew after a maximum of 6 years (Illinois Department of Public Health, Oct 2026).
Can a license move between states?
Mostly not without paperwork.
- North Carolina says it has no license reciprocity agreements with any other state, though it waives the technical exam for South Carolina plumbing and HVAC contractors (North Carolina State Board of Examiners of Plumbing, Heating and Fire Sprinkler Contractors, Oct 2026).
- Washington has reciprocal certification with Idaho for journey-level plumbers, and other out-of-state plumbers must show a comparable license or equivalent military experience (Washington State Department of Labor & Industries, Oct 2026).
How Dangerous Is Plumbing Work?
Plumbers get hurt far more often than the average worker, and the injuries are the physical kind: sprains, cuts, falls and strains. Deaths are rare in absolute terms but run well above the national rate.
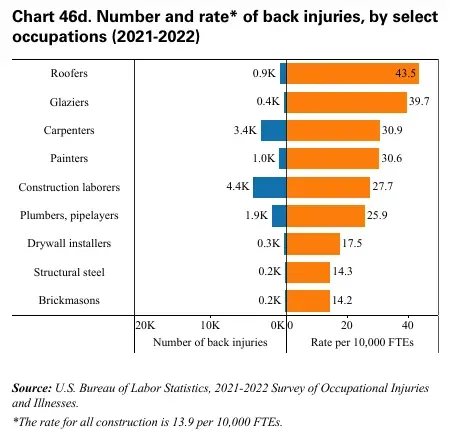 Figure 9: Back injuries are a signature plumbing injury, and plumbers and pipelayers rank in the middle of the occupations shown by rate while ranking third by count. The footnote gives the rate for all construction as the baseline. Source: CPWR, The Construction Chart Book 7th edition, Chart 46d, from BLS data, Sep 2025. Chart published by the source, captured 21 Oct 2026.
How often do plumbers lose time to injury?
Rates are per 10,000 full-time workers in private industry. Plumbers here means plumbers, pipefitters, and steamfitters.
- Plumbers had 11,090 injury and illness cases with days away from work in 2023-24, with a median of 9 days away against 8 for all occupations (BLS Injuries and Illnesses, Jan 2026).
- Cases with days away, restricted work or job transfer ran at 211.7 per 10,000 full-time workers (BLS Injuries and Illnesses, Jan 2026).
- Plumbing, heating, and air-conditioning contractors had a total recordable case rate of 3.0 per 100 full-time workers in 2024, against 2.3 for private industry (BLS Injuries and Illnesses, Jan 2026).
- Private industry employers reported 2.5 million nonfatal injuries and illnesses in 2024 (BLS Injuries and Illnesses, Jan 2026).
Which injuries are most common?
Sprains, strains and cuts lead, and plumbers have both at higher rates than workers overall.
- Sprains, strains and tears ran at 43.5 per 10,000 full-time workers, against 26.8 for all occupations (BLS Injuries and Illnesses, Jan 2026).
- Cuts, lacerations and punctures ran at 22.4, against 8.5 (BLS Injuries and Illnesses, Jan 2026).
- Plumbers and pipelayers had 1,900 back injuries in 2021-2022, a rate of 25.9 per 10,000 full-time workers, against 13.9 for all of construction (CPWR, Sep 2025).
What events cause the injuries?
Contact with tools and equipment, lifting and falls drive most of the gap.
- Contact incidents ran at 56.4 per 10,000 full-time workers, against 23.6 for all occupations (BLS Injuries and Illnesses, Jan 2026).
- Overexertion, repetitive motion and bodily conditions ran at 39.2, against 23.2 (BLS Injuries and Illnesses, Jan 2026).
- Falls, slips and trips ran at 32.3, against 22.6 (BLS Injuries and Illnesses, Jan 2026).
- Falls to a lower level ran at 13.0, against 4.1 (BLS Injuries and Illnesses, Jan 2026).
How many plumbers die at work?
Pipelayers are counted with plumbers in some tables, so the numbers below say which group they cover.
- The fatal injury rate for pipelayers, plumbers, pipefitters, and steamfitters was 6.9 per 100,000 full-time workers in 2024, against 3.3 for all workers (BLS Fatal Injuries, Feb 2026).
- That group had 47 fatal injuries, 17 from contact incidents and 15 from exposure to harmful substances or environments (BLS Fatal Injuries, Feb 2026).
- The United States recorded 5,070 fatal work injuries across all jobs in 2024 (BLS Fatal Injuries, Feb 2026).
- Construction and extraction workers had 1,032 of those deaths (BLS Fatal Injuries, Feb 2026).
- Construction trades workers had 788 fatal injuries (BLS Fatal Injuries, Feb 2026).
Which Safety Rules and Risks Matter Most to Plumbing Shops?
Falls are the hazard regulators cite most, and small crews are the ones hit hardest. A single serious citation costs more than most shops make on a job.
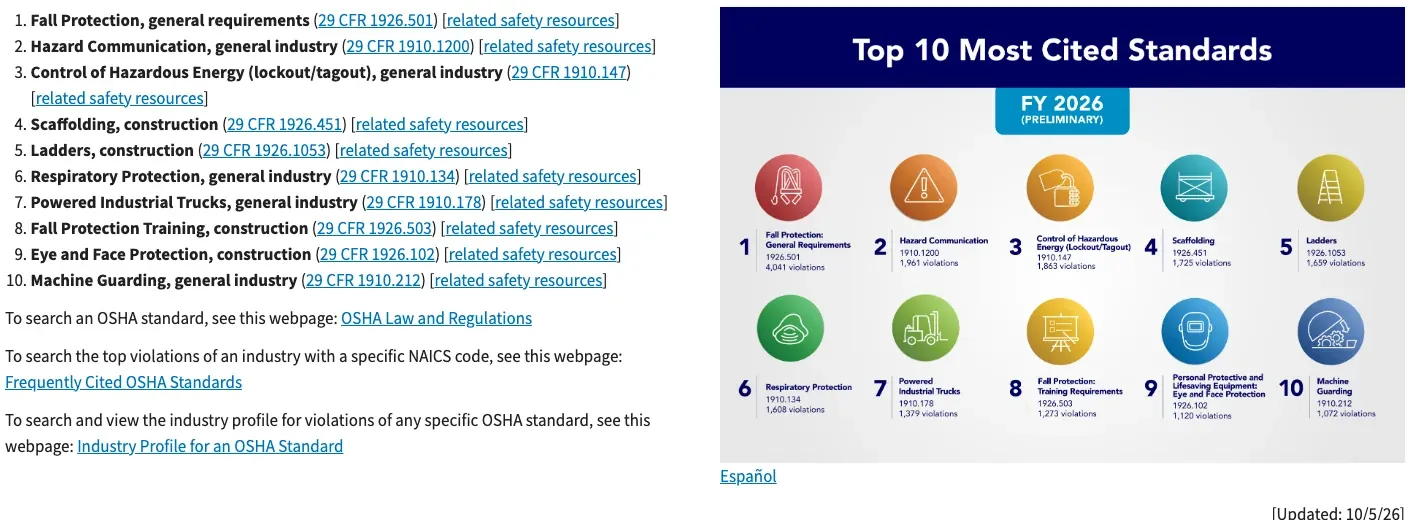 Figure 10: Fall protection, scaffolding and ladder rules take four of the top ten spots in federal OSHA citations. Plumbers work on ladders and in crawl spaces, so these are the standards most likely to apply on a service call. Source: OSHA, Top 10 Most Frequently Cited Standards, fiscal year 2026, Oct 2026. Screenshot of the source page, captured 21 Oct 2026.
What do OSHA penalties cost?
Penalty caps rise each January with inflation.
- A serious violation can cost up to $16,550 per violation after January 15, 2026 (OSHA, Jan 2026).
- A willful or repeated violation can cost up to $165,514 per violation (OSHA, Jan 2026).
- Failing to abate a hazard can cost up to $16,550 for each day past the abatement date (OSHA, Jan 2026).
Which standards does OSHA cite most?
The list is for all industries, but five of the ten are construction standards.
- Fall protection, general requirements (29 CFR 1926.501) ranked first for fiscal year 2026 through August (OSHA, Oct 2026).
- Scaffolding ranked fourth and ladders fifth (OSHA, Oct 2026).
- Respiratory protection ranked sixth (OSHA, Oct 2026).
- Fall protection training ranked eighth and eye and face protection ninth (OSHA, Oct 2026).
What is the leading cause of death in construction?
NIOSH points to falls, and the small-employer figure in the Key Takeaways comes from the same page.
- Falls are the leading cause of work-related deaths in construction, at more than 36.4% of fatalities (NIOSH, May 2024).
- In 2019, 11.4 million US workers were employed in construction (NIOSH, May 2024).
What Does a Plumber’s Workday Look Like?
A plumber’s day is physical, indoors and out, and full of talking to customers. Plumbers also work on call, which means the phone, the estimate and the invoice are part of the job.
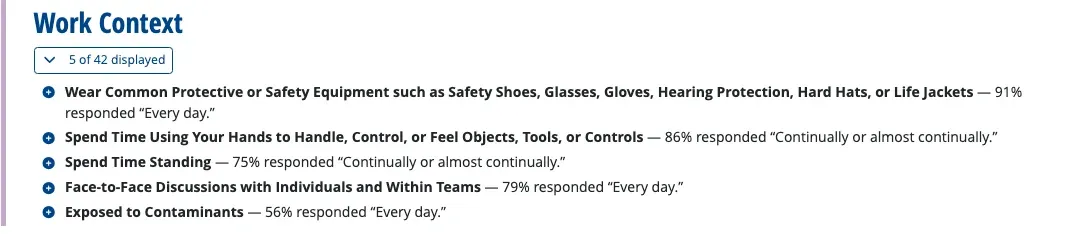 Figure 11: ONET surveys workers in each occupation. Four in five plumbers talk face to face with customers or teammates every day, and most wear protective gear every day, so the job mixes hands-on and customer work. Source: O*NET OnLine, Plumbers, Pipefitters, and Steamfitters (47-2152.00), Oct 2026. Screenshot of the source page, captured 21 Oct 2026.*
What are the working conditions?
O*NET reports what share of respondents gave each answer.
- 91% wear protective or safety equipment every day (O*NET OnLine, Oct 2026).
- 56% are exposed to contaminants every day (O*NET OnLine, Oct 2026).
- 75% stand continually or almost continually, and 86% use their hands to handle tools and controls continually or almost continually (O*NET OnLine, Oct 2026).
- 43% climb ladders, scaffolds or poles continually or almost continually (O*NET OnLine, Oct 2026).
- 40% spend more than half their time kneeling, crouching, stooping or crawling (O*NET OnLine, Oct 2026).
- 46% are exposed to hazardous equipment every day (O*NET OnLine, Oct 2026).
- 47% work outdoors in all weather at least once a week (O*NET OnLine, Oct 2026).
- 73% work a 40-hour week (O*NET OnLine, Oct 2026).
How much of the job is customer contact?
The Handbook lists cost estimates as a core duty, and the survey shows how often plumbers talk to people.
- 79% have face-to-face discussions with individuals and within teams every day (O*NET OnLine, Oct 2026).
- 45% are on telephone conversations every day (O*NET OnLine, Oct 2026).
- 33% use e-mail every day (O*NET OnLine, Oct 2026).
- 54% report constant contact with others (O*NET OnLine, Oct 2026).
- Plumbers prepare cost estimates for clients and are often on call for emergencies, so evening and weekend work is common (BLS Occupational Outlook Handbook, Aug 2026).
Glossary
- AGC: Associated General Contractors of America, a construction trade association.
- BLS: Bureau of Labor Statistics, part of the US Department of Labor.
- CPS: Current Population Survey, the monthly household survey run by the Census Bureau for BLS.
- CPWR: The Center for Construction Research and Training, the research arm of the North America’s Building Trades Unions.
- DART: Days away, restricted or transferred, a BLS injury case type.
- FTE: Full-time equivalent worker, used for injury and fatality rates.
- JOLTS: Job Openings and Labor Turnover Survey from BLS.
- NAHB: National Association of Home Builders.
- NCCER: National Center for Construction Education and Research.
- NIOSH: National Institute for Occupational Safety and Health.
- OEWS: Occupational Employment and Wage Statistics, BLS’s employer survey of jobs and pay.
- OSHA: Occupational Safety and Health Administration.
- Journey level: A plumber licensed to work without supervision.
- Master plumber: A plumber licensed to run a plumbing business or supervise others in states that use that tier.
Methodology and Sources
Every figure comes from the agency, regulator, association or research body that produced it. We read each figure in the original page, table or PDF and did not use roundup articles. The Bureau of Labor Statistics occupation figures cover plumbers, pipefitters, and steamfitters together unless a line says otherwise. State license figures come from each licensing body’s own page and change when laws change. The page is refreshed monthly as new releases appear.
Sources
- BLS, Occupational Outlook Handbook: Plumbers, Pipefitters, and Steamfitters
- BLS, National Employment Matrix for 47-2152
- BLS, Occupational Employment and Wage Statistics tables
- BLS, Current Population Survey table 11, employed people by detailed occupation
- BLS, Current Population Survey table 11b, employed people by detailed occupation and age
- BLS, Job Openings and Labor Turnover Survey, table 1
- BLS, Job Openings and Labor Turnover Summary
- BLS, Union Members Summary
- BLS, Employer-Reported Workplace Injuries and Illnesses 2024
- BLS, Incidence rates of nonfatal injuries and illnesses by industry, table 1
- BLS, Case and demographic characteristics table R66, 2023-2024
- BLS, Case and demographic characteristics table R98, 2023-2024
- BLS, Case and demographic characteristics table R100, 2023-2024
- BLS, Fatal occupational injuries by occupation and event, table A-5, 2024
- BLS, Fatal injury rates by occupation, 2024
- BLS, National Census of Fatal Occupational Injuries in 2024
- BLS, Fatal occupational injuries for selected occupations, table 3
- AGC and NCCER, 2026 Workforce Survey Analysis
- AGC, Contractors add 22,000 jobs in August
- NAHB, Labor Shortages a Growing Problem
- NAHB, Highest Paid Occupations in Construction in 2025
- NAHB, Construction Workforce Shifts
- NAHB, Which States and Construction Trades Depend the Most on Immigrant Workers
- NAHB, Age of Housing Stock by State
- NAHB, Bathroom Remodeling Is Most Common Project in 2025
- NAHB, Remodeling Market Sentiment, first quarter 2026
- U.S. Census Bureau and HUD, Monthly New Residential Construction, September 2026
- U.S. Census Bureau, Monthly Construction Spending, August 2026
- CPWR, The Construction Chart Book, 7th edition
- NIOSH, Construction
- OSHA, Penalties
- OSHA, Top 10 Most Frequently Cited Standards
- O*NET OnLine, Plumbers, Pipefitters, and Steamfitters
- U.S. Department of Labor, Registered Apprenticeship: Construction fact sheet
- NCCER, Who We Are
- Texas State Board of Plumbing Examiners, Journeyman Plumber
- Illinois Department of Public Health, Plumbing
- Washington State Department of Labor & Industries, Plumber Certification
- Massachusetts Board of State Examiners of Plumbers and Gas Fitters, consumer fact sheet
- South Dakota Plumbing Commission, Licensing
- North Carolina State Board of Examiners of Plumbing, Heating and Fire Sprinkler Contractors, Applicant Information