Gas leak statistics come from several agencies, and each one counts something different. PHMSA counts pipeline incidents and the leaks utilities repair. NFPA counts house fires. CPSC and CDC count carbon monoxide deaths. NTSB studies the worst explosions one by one. This page puts them side by side, with the source and date next to every number.
The scope is natural gas in the United States. That means the utility pipe network that ends at the meter, and the gas piping and appliances past the meter, where plumbers and gas fitters work. Utility pipe is regulated by PHMSA and state agencies. Piping inside a building is covered by local fuel gas codes and is the owner’s responsibility (NTSB, Jan 2021). That matters, because the two halves are counted by different agencies.
This page does not cover water leaks, burst pipes or water damage. For those, see water leak statistics. For gas water heaters, see water heater statistics. For the trade that fixes gas and water problems, see plumbing industry statistics. Counts from PHMSA’s incident and annual report files were totaled by this page from the public data files, as explained under Methodology and Sources.
Key Takeaways
- Gas distribution operators reported 1,547 incidents from 2010 through 2025, with 142 deaths and 652 injuries (PHMSA, Apr 2026).
- Excavation damage caused 532 of those incidents, 34.4 percent, while corrosion caused only 36, or 2.3 percent (PHMSA, Apr 2026).
- Utilities eliminated or repaired 545,562 gas distribution leaks in 2025, and 214,050 of them were hazardous (PHMSA, Sep 2026).
- 108,780 known leaks were still scheduled for repair at the end of 2025 (PHMSA, Sep 2026).
- Flammable gas started an estimated 10,774 home structure fires a year in 2018 to 2022, with 157 deaths (NFPA, Oct 2024).
- Home fires that started with a flammable gas rose from 8,196 in 2010 to 11,537 in 2022 (NFPA, Oct 2024).
- Gas-fueled products were tied to an estimated 112 non-fire carbon monoxide deaths in 2022 (CPSC, May 2026).
- More than 400 Americans die each year from non-fire carbon monoxide poisoning, and more than 100,000 visit an emergency department (CDC, Jan 2026).
- The NTSB concluded that gas odorant alone does not effectively reduce deaths and injuries from gas leaks (NTSB, Apr 2019).
- The 2018 Merrimack Valley overpressurization damaged 131 structures and killed one person (NTSB, Sep 2019).
- Natural gas facilities were 39 percent of the buried facilities damaged in 2024, second only to telecommunications at 49 percent (CGA, Aug 2025).
- The United States had 73,719,064 residential natural gas customers in 2024 (EIA, Sep 2026).
- Natural gas stoves release 0.8 to 1.3 percent of the gas they use as unburned methane (Lebel et al., Jan 2022).
How Many Gas Distribution Incidents Happen Each Year?
Reported incidents have fallen by about half since 2010, but deaths have not followed. The count has settled near 60 a year, and the worst years are set by a few explosions.
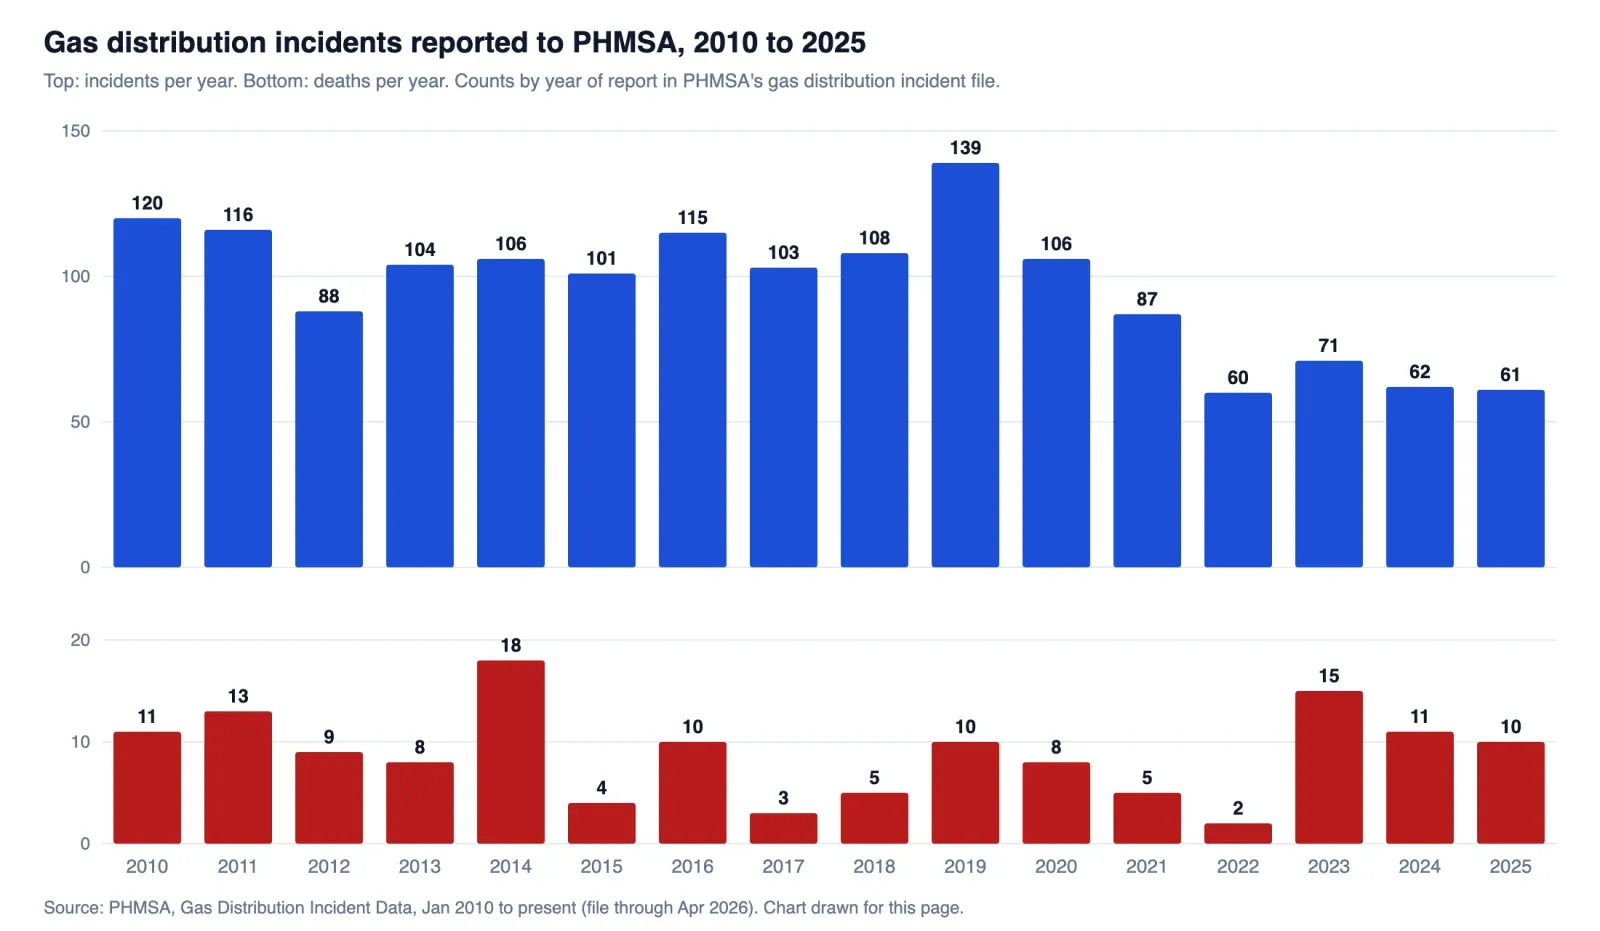 Figure 1: Incidents dropped after 2021 and have held near 60 a year, while deaths jumped in 2023. Source: PHMSA, Gas Distribution Incident Data, Apr 2026. Chart drawn for this page from the source file, captured 21 Oct 2026.
What counts as a reportable gas distribution incident?
An incident is an unintended gas release that kills someone, sends someone to the hospital overnight, costs $122,000 or more, or loses 3 million cubic feet of gas. A small leak that hurts no one is not in the file.
- Federal rules treat an event as an incident if it meets any one of those tests, or if the operator judges it significant. The dollar threshold is adjusted for inflation (eCFR, Oct 2026).
- Operators must send PHMSA a written report within 30 days of an incident (PHMSA, Apr 2026).
- Between 2001 and 2020, gas distribution incidents were 81 percent of all serious incidents reported to PHMSA, across every pipeline type (PHMSA, Sep 2023).
How many incidents, deaths and injuries were there in each recent year?
The count peaked at 139 in 2019 and bottomed at 60 in 2022. Deaths do not track the count.
- 2019 had the most incidents, at 139 (PHMSA, Apr 2026).
- 2023 had 15 deaths, the most since 2014, from only 71 incidents (PHMSA, Apr 2026).
- 2025 had 61 incidents, 10 deaths and 26 injuries (PHMSA, Apr 2026).
- 2021 to 2025 together had 341 incidents, 43 deaths and 120 injuries (PHMSA, Apr 2026).
How often does a gas incident end in fire or explosion?
More often than not. Gas ignited in a little over half of the incidents, and almost every fatal incident involved fire.
- Gas ignited in 899 incidents and exploded in 352 (PHMSA, Apr 2026).
- 103 incidents involved at least one death; 93 of them involved ignition and 58 an explosion (PHMSA, Apr 2026).
- Explosion incidents account for 85 deaths and 383 injuries (PHMSA, Apr 2026).
- 121 of the deaths were members of the public (PHMSA, Apr 2026).
- 44 percent of incidents happened from November through March, and January alone had 165 (PHMSA, Apr 2026).
- Across 1,440 reports with both times, the median gap between the operator identifying the failure and its crew arriving on site was 19 minutes (PHMSA, Apr 2026).
What Causes Gas Distribution Incidents?
Corrosion gets the blame in the news, but it is a small slice of the record. Digging and vehicles cause most incidents, and the causes that kill are not the ones that happen most.
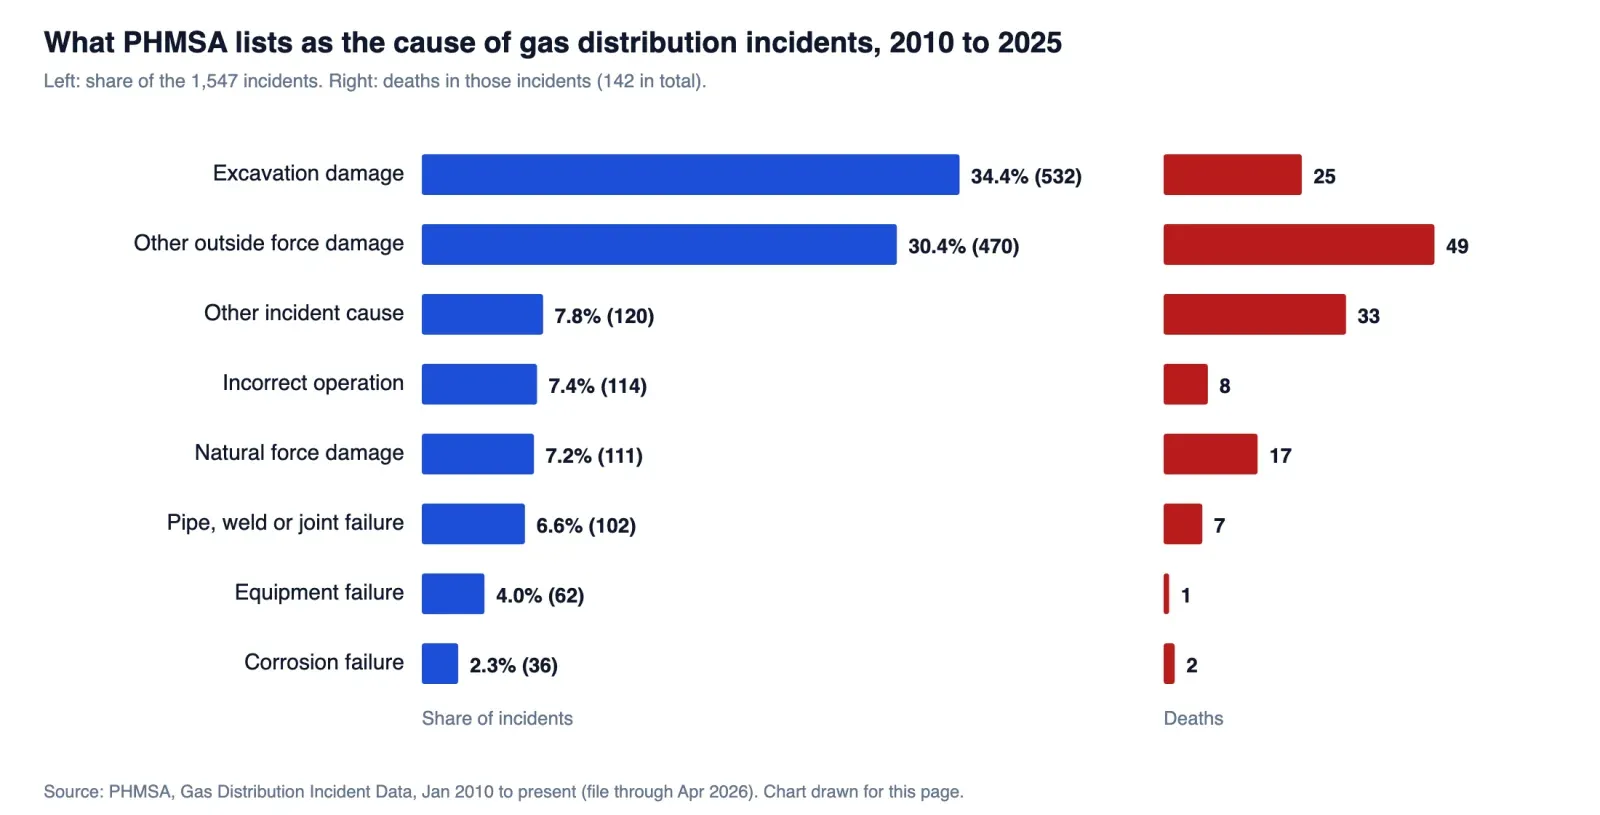 Figure 2: Excavation damage leads the count, but other outside force damage, which includes vehicles and nearby fires, is linked to the most deaths. Source: PHMSA, Gas Distribution Incident Data, Apr 2026. Chart drawn for this page from the source file, captured 21 Oct 2026.
Which causes lead to the most incidents?
Outside force is second to digging. Almost half of it is a vehicle hitting a meter or a line.
- Other outside force damage caused 470 incidents, 30.4 percent, and 213 of them were cars, trucks or other motorized equipment not engaged in excavation (PHMSA, Apr 2026).
- A nearby fire or explosion was the primary cause in 91 incidents, and electrical arcing in 44 (PHMSA, Apr 2026).
- Incorrect operation caused 114 incidents and 115 injuries, the third most injuries of any cause (PHMSA, Apr 2026).
Which causes kill the most people?
Outside force and the catch-all “other” cause lead the death count, and digging is third.
- Other outside force damage was linked to 49 deaths, other incident causes to 33, and excavation damage to 25 deaths and 139 injuries (PHMSA, Apr 2026).
What part of the system fails, and where?
Mains are involved most often, and service lines, risers and meter sets add up to most of the rest.
- Mains were involved in 724 incidents, service lines in 239, outside meter and regulator sets in 234, service risers in 80 and inside meter sets in 39 (PHMSA, Apr 2026).
- Steel was the material in 735 incidents, plastic in 490 and cast or wrought iron in 60 (PHMSA, Apr 2026).
- Pennsylvania had the most deaths at 21, followed by Texas at 15 and Maryland at 13 (PHMSA, Apr 2026).
How Often Does Digging Damage Gas Lines?
Digging damage has the same repeat causes every year. The top root cause is that someone dug without asking for a locate, and the second is that they dug too close to marks that were there.
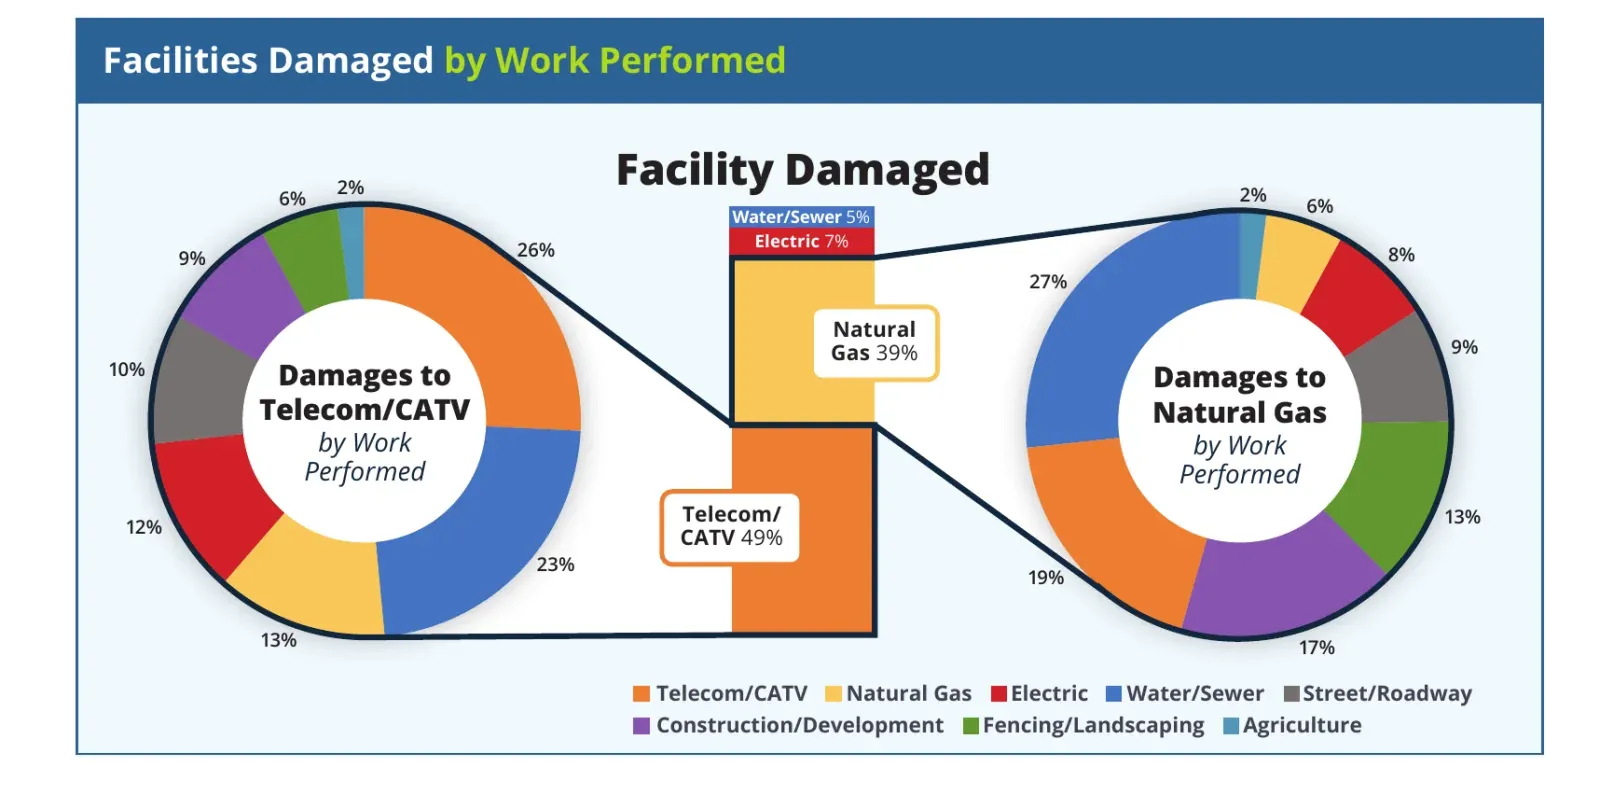 Figure 3: Natural gas lines were the second most damaged facility type in 2024, and the biggest share of those hits happened during water and sewer work. Source: CGA, 2024 DIRT Report, Aug 2025. Screenshot of the source report page, captured 21 Oct 2026.
How many damages does the industry see in a year?
About 197,000 across the United States and Canada, and the trend is flat to up.
- CGA counted 196,977 unique damages to buried facilities in 2024 (CGA, Aug 2025).
- 189,052 of them were in the United States (CGA, Aug 2025).
- The top root cause was no locate request, at 35,402 reports or 24.54 percent of damages with a known cause (CGA, Aug 2025).
- Notification failures were 26 percent of damages, locating practices 34 percent and excavation practices 33 percent (CGA, Aug 2025).
- Across eight 811 centers, excavators were delayed 38 percent of the time because of incomplete responses to locate requests (CGA, Aug 2025).
- Natural gas work was 10 percent of the work being done when damages occurred (CGA, Aug 2025).
What do gas utilities report to PHMSA?
Gas operators filed 85,870 excavation damages for 2025, against more than 36 million locate tickets. That works out to about 2.4 damages per 1,000 tickets.
- The 2025 annual reports list 85,870 excavation damages and 36,150,911 excavation tickets (PHMSA, Sep 2026).
- 23,841 of the 2025 damages were made with no notification to the 811 center (PHMSA, Sep 2026).
- Excavation issues were 33,713 damages, notification issues 29,596 and locating issues 20,332 (PHMSA, Sep 2026).
Who is digging when a gas line is hit?
Mostly contractors, and about one in four of the serious cases skipped the call.
- Of the excavation damage incidents, contractors were the excavator in 415, utilities in 45, municipalities in 18 and occupants in 9 (PHMSA, Apr 2026).
- The one-call center was not notified in 132 of them, or 24.8 percent (PHMSA, Apr 2026).
- In Canton, Illinois, in November 2016, a contractor drilling for fiber optic cable hit a marked gas line, and an explosion later killed one utility employee and injured 11 people (NTSB, Dec 2018).
How Many Gas Leaks Do Utilities Find and Fix Each Year?
More than half a million. Most are on service lines, most are not hazardous, and the biggest single cause is equipment, not rusted pipe.
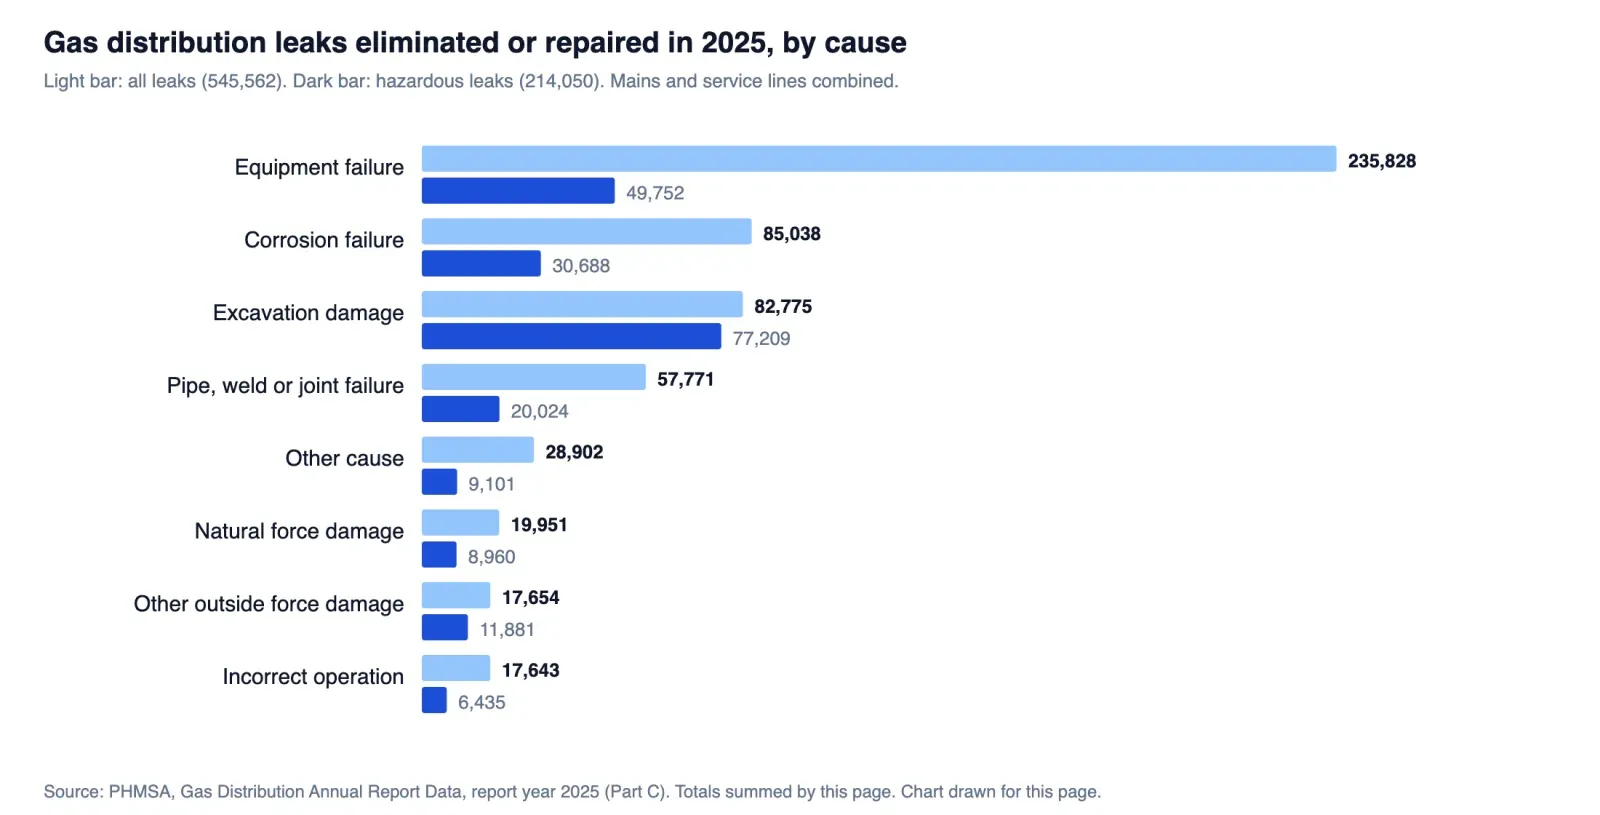 Figure 4: Equipment failure accounts for the most repairs, but nearly every excavation leak is hazardous. Source: PHMSA, Gas Distribution Annual Report Data, Sep 2026. Chart drawn for this page from the source file, captured 21 Oct 2026.
How many leaks were repaired, and where?
Service lines carry the load. They make up 83 percent of repaired leaks.
- Service lines had 452,782 leaks repaired in 2025 and mains had 92,780 (PHMSA, Sep 2026).
- Total repairs were 525,002 in 2017, fell to 503,428 in 2022, and rose again by 2025 (PHMSA, Sep 2026).
- Against 1,394,679 miles of main, 2025 repairs work out to about 0.39 leaks per mile (PHMSA, Sep 2026).
Which causes produce the most leaks?
Equipment is up, corrosion is down, and digging is the dangerous one.
- Equipment failure caused 235,828 repaired leaks in 2025, 43.2 percent, up from 172,280 in 2017 (PHMSA, Sep 2026).
- Corrosion caused 85,038, down from 114,616 in 2017 (PHMSA, Sep 2026).
- Excavation damage caused 82,775 leaks, and 77,209 of them were hazardous, which is 93 percent (PHMSA, Sep 2026).
How big is the repair backlog?
The backlog of known leaks is below its 2020 peak but still above its 2017 level.
- Known leaks scheduled for repair peaked at 131,817 at the end of 2020 and stood at 103,865 at the end of 2017 (PHMSA, Sep 2026).
- Atmos Energy’s Mid-Tex system reported 22,996 known leaks, and Summit Utilities 10,793 (PHMSA, Sep 2026).
- 20 operators each reported 1,000 or more known leaks (PHMSA, Sep 2026).
- In New York, 11 utilities found 19,683 leaks in 2019: 37.6 percent were grade 1, 27.8 percent grade 2 and 29.3 percent grade 3 (PHMSA, May 2023).
- New York did not require grade 3 repairs, which left a backlog of almost 10,000 unrepaired leaks in 2020 (PHMSA, May 2023).
How Big and How Old Is the Gas Pipe Network?
The network keeps growing, and the oldest parts are shrinking but not gone. Most of it is now plastic.
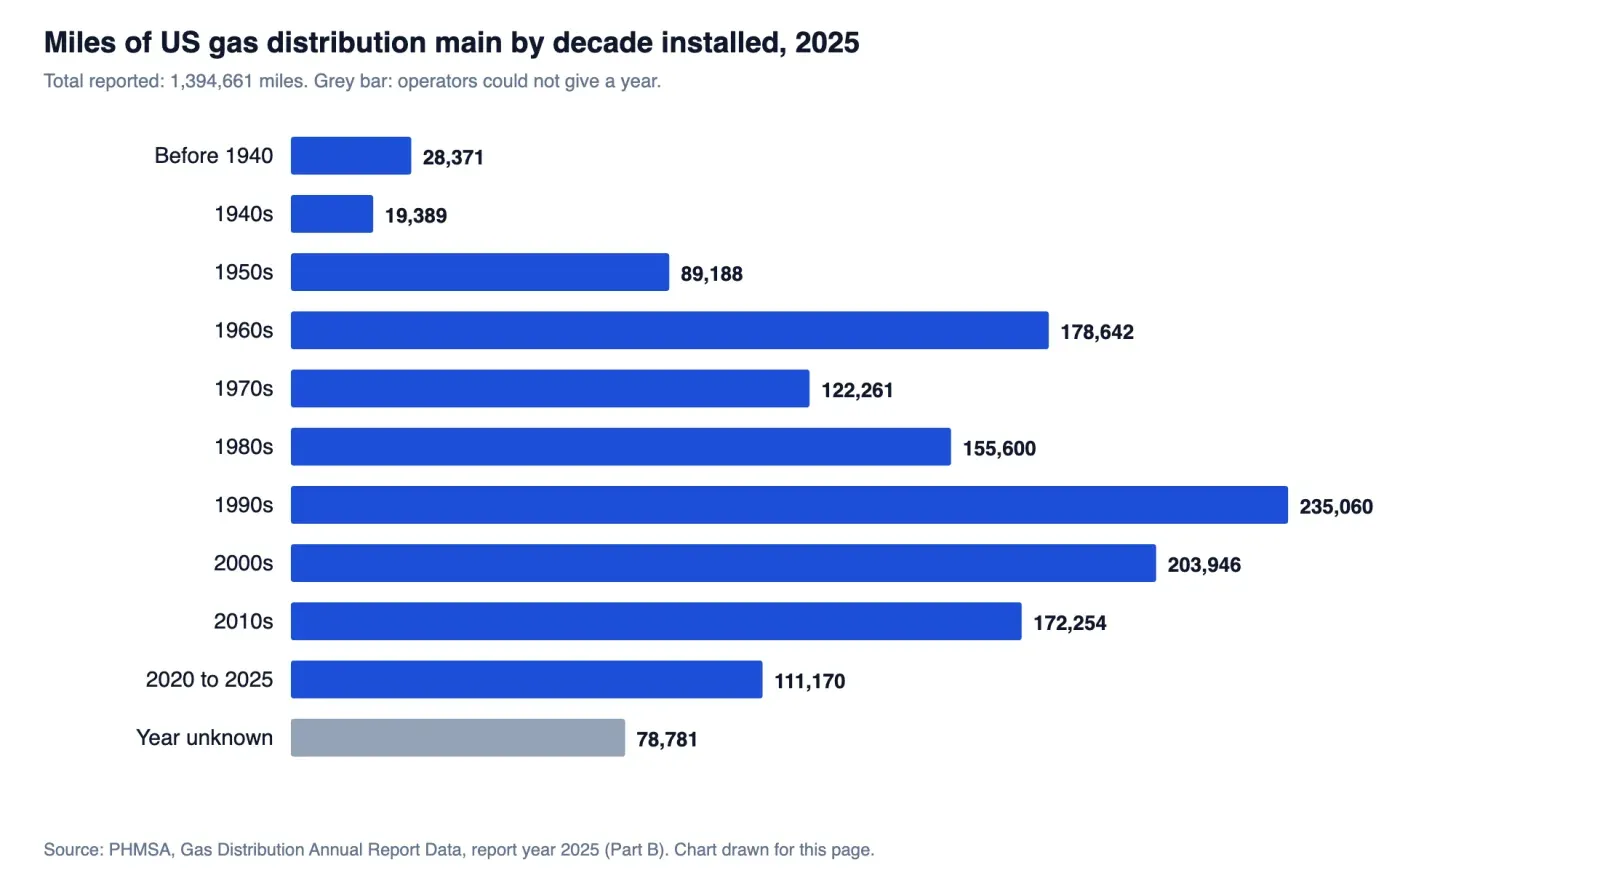 Figure 5: The 1990s and 2000s built the most main, and about 315,000 miles date from before 1970. Source: PHMSA, Gas Distribution Annual Report Data, Sep 2026. Chart drawn for this page from the source file, captured 21 Oct 2026.
How many miles of main and service lines are there?
Operators reported about 1.39 million miles of main and 73 million service lines for 2025.
- Operators reported 1,394,679 miles of main and 73,146,319 service lines for 2025 (PHMSA, Sep 2026).
- The EPA counted 1,352,384 miles of distribution main in 2022, up 408,227 miles from 1990 (EPA, Apr 2024).
- PHMSA counted 1,239 gas distribution parent companies, and 92 percent of them were classed as small (PHMSA, Sep 2023).
- The EIA puts the whole US natural gas pipeline network, of every kind, at about 3 million miles (EIA, Mar 2024).
What is the pipe made of?
Plastic is now 63 percent of main miles. Cast iron and bare steel are a small and shrinking tail.
- Plastic main totaled 877,216 miles, and cathodically protected coated steel 457,925 miles (PHMSA, Sep 2026).
- Cast iron main fell from 24,467 miles in 2017 to 13,649 in 2025, a drop of 44 percent (PHMSA, Sep 2026).
- Unprotected bare steel main fell from 34,722 miles to 23,645 over the same years (PHMSA, Sep 2026).
How old is the network?
Nearly a quarter of main miles were installed before 1970, and some is much older.
- 28,371 miles of main and 680,940 service lines date from before 1940 (PHMSA, Sep 2026).
- 111,170 miles of main have been installed since 2020 (PHMSA, Sep 2026).
- The EIA says about half of the mainline transmission network and a large share of the local distribution network went in during the 1950s and 1960s (EIA, Mar 2024).
Which Gas Appliances Do US Homes Have?
Gas reaches most homes through a handful of appliances. Each is a place where a leak can start, and each is a job someone is asked to check.
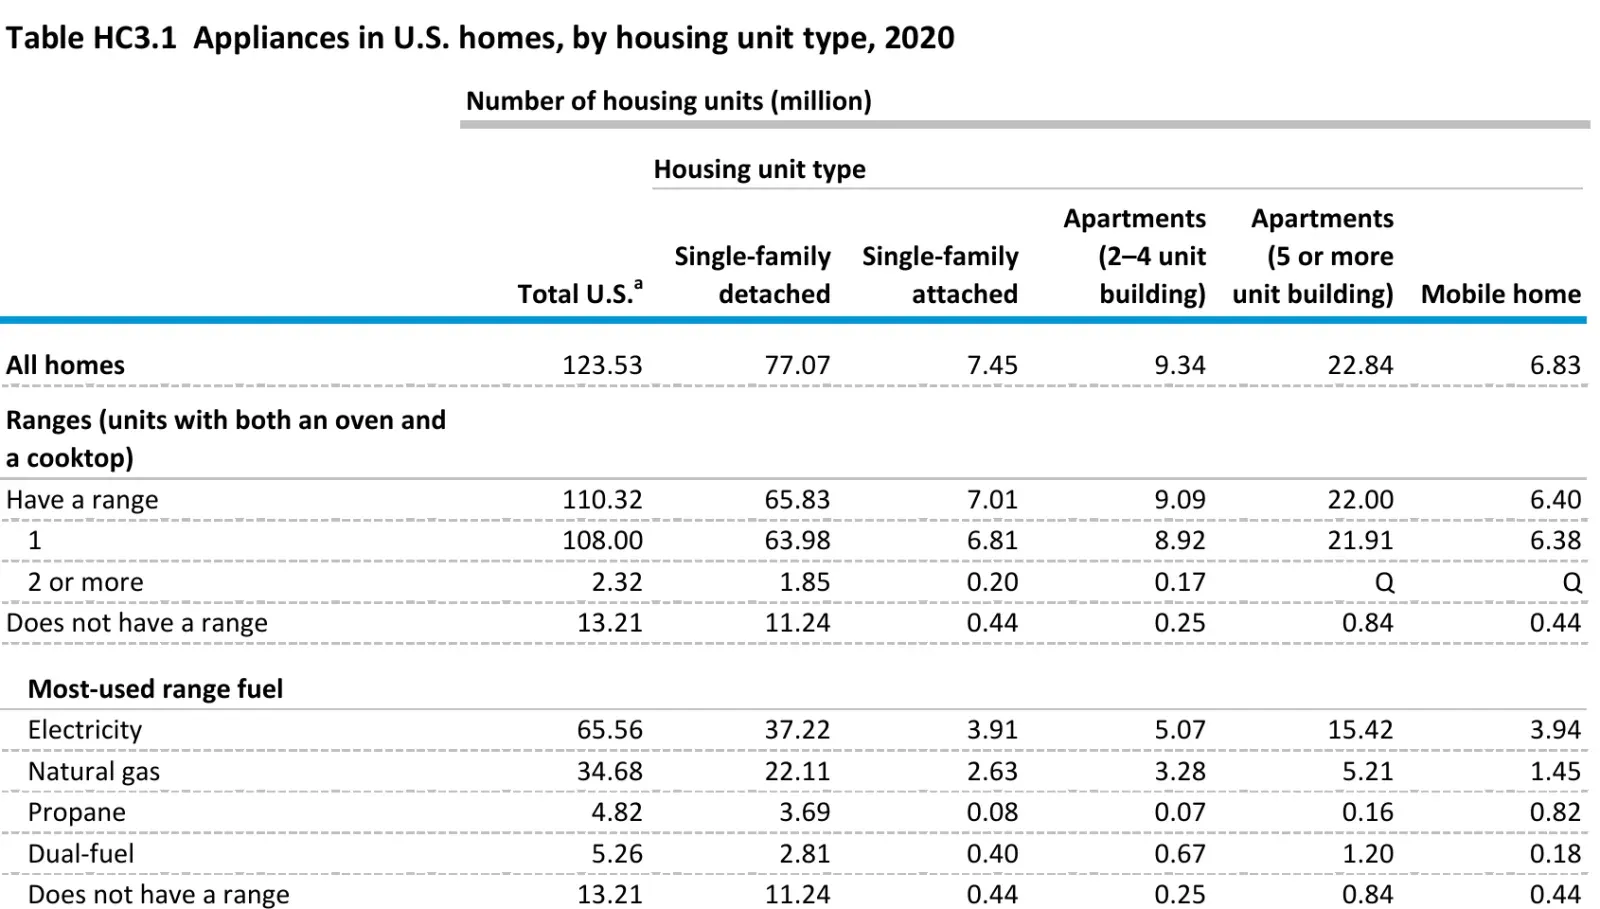 Figure 6: Natural gas is the second most-used range fuel, behind only electricity. Source: EIA, Residential Energy Consumption Survey 2020, Table HC3.1, Mar 2023. Screenshot of the source table, captured 21 Oct 2026.
How many homes use gas?
Gas is the main heating fuel in about half of US homes, and the customer count has grown by nearly half since 1990.
- Natural gas was the main heating fuel in 62.71 million of 123.53 million homes (EIA, Mar 2023).
- 53.26 million homes had a gas central warm-air furnace, 6.51 million a gas steam or hot water system and 2.77 million a gas built-in room heater (EIA, Mar 2023).
- Residential gas customers numbered 50,187,178 in 1990 and 65,542,345 in 2010 (EIA, Sep 2026).
- CPSC staff project 64.13 million gas furnaces and boilers in use in 2025, with an average life of 22 to 25 years (CPSC, Oct 2023).
How many homes cook, dry clothes and warm up with gas?
Tens of millions. Gas ranges and dryers are common enough that a leak check is a routine part of many service calls.
- Natural gas was the most-used range fuel in 34.68 million homes, propane in 4.82 million and dual-fuel in 5.26 million (EIA, Mar 2023).
- Another 7.67 million homes used a natural gas separate cooktop (EIA, Mar 2023).
- 22.11 million gas ranges were in detached houses and 5.21 million in buildings with five or more units (EIA, Mar 2023).
- 18.89 million homes had a natural gas clothes dryer (EIA, Mar 2023).
- 6.94 million homes used a natural gas fireplace as secondary heat (EIA, Mar 2023).
How Many Home Fires Start With Flammable Gas?
Gas fires are rising even as large utility incidents fall. Most start in the kitchen or on the patio, not in the street.
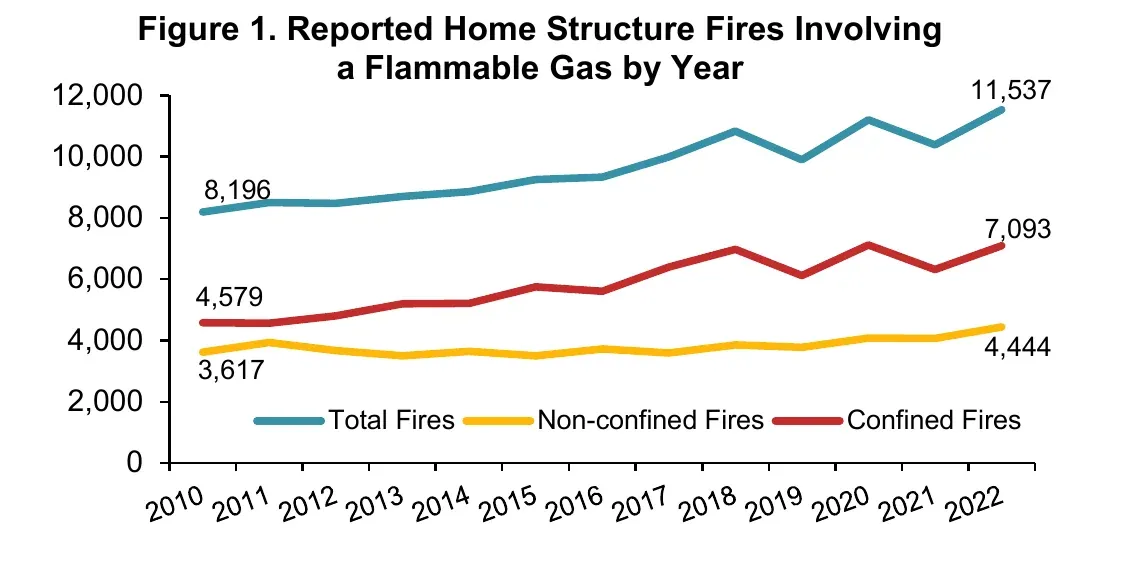 Figure 7: Home fires that began with flammable gas climbed through the 2010s and into 2022, with confined fires growing fastest. Source: NFPA, Structure Fires Involving Flammable Gases, Oct 2024. Screenshot of the source chart, captured 21 Oct 2026.
How big is the problem across all buildings?
NFPA counts about 16,000 structure fires a year where flammable gas was the first thing to burn.
- In 2018 to 2022, flammable gas was the first material ignited in an estimated 15,941 structure fires a year, causing 191 civilian deaths, 747 civilian injuries and $402 million in property damage (NFPA, Oct 2024).
- 5,166 of those fires a year were in non-home structures (NFPA, Oct 2024).
- The home fires caused 522 civilian injuries and $269 million in property damage a year (NFPA, Oct 2024).
- Home gas fires killed 227 people in 2021 and 193 in 2022, the two highest yearly totals since 2010 (NFPA, Oct 2024).
- Flammable gas was the first material ignited in 3 percent of all reported home structure fires by 2022, up from 2 percent in 2010 (NFPA, Oct 2024).
Which gas starts the fires, natural gas or propane?
Natural gas starts the most fires, but LP-gas and unclassified gas cause more deaths.
- Natural gas started 4,566 home fires a year, 42 percent, with 32 deaths (NFPA, Oct 2024).
- LP-gas started 4,128 home fires, 38 percent, with 47 deaths (NFPA, Oct 2024).
- Other flammable gas, not classed as natural gas or LP-gas, started 1,987 home fires with 76 deaths (NFPA, Oct 2024).
Where in the home do gas fires start, and why?
Kitchens lead on count. Living rooms and bedrooms lead on deaths.
- The kitchen or cooking area was the origin of 3,355 fires, 31 percent, and 23 deaths (NFPA, Oct 2024).
- Heating equipment rooms were the origin of 821 fires (NFPA, Oct 2024).
- Fires that began in a living room, family room or den killed 32 people a year, and bedroom fires killed 23 (NFPA, Oct 2024).
- Gas that was uncontained when it ignited was 8 percent of fires but 33 percent of deaths (NFPA, Oct 2024).
- A leak or break was a contributing factor in 1,643 fires, 15 percent, and 30 deaths (NFPA, Oct 2024).
- Mechanical failure or malfunction contributed to another 1,579 fires (NFPA, Oct 2024).
- When a leak or malfunction was involved, a range with or without an oven was the equipment in 577 fires (NFPA, Oct 2024).
What Do Gas Line Explosions Cost in Lives and Property?
A few events account for most of the damage. The costliest in this record, in Massachusetts, was not a pipe leak. It was a pressure error during pipe replacement work.
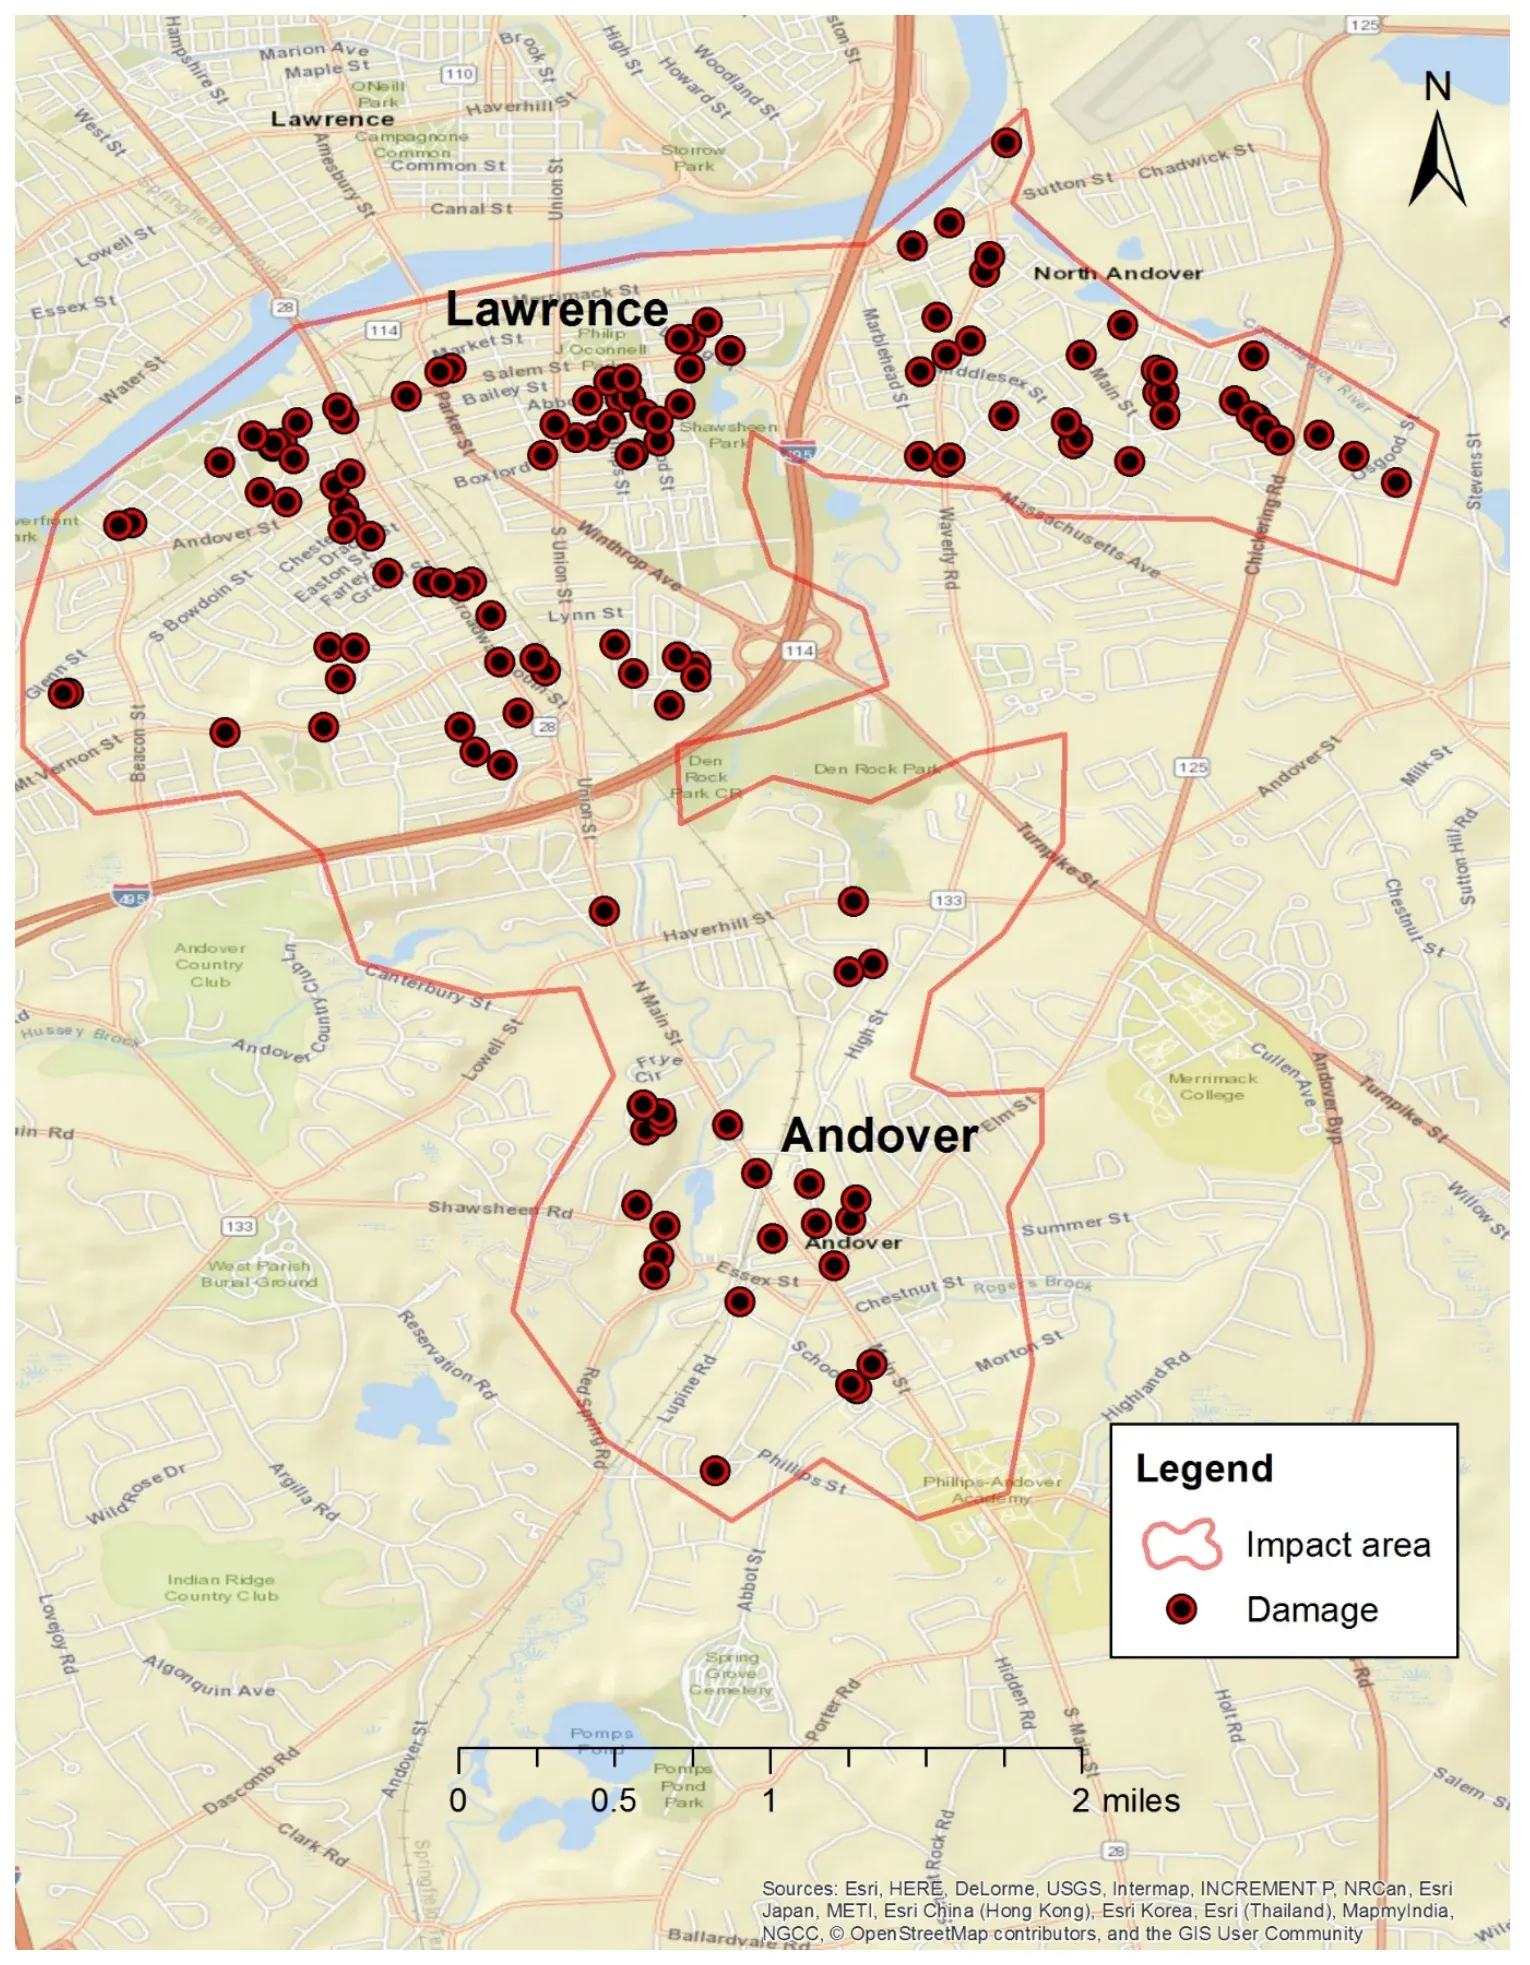 Figure 8: Each dot marks a structure damaged by fires and explosions on September 13, 2018, spread across three communities. Source: NTSB, Pipeline Accident Report NTSB/PAR-19/02, Sep 2019. Map published by the source, captured 21 Oct 2026.
What happened in Merrimack Valley in 2018?
High-pressure gas entered a low-pressure system that serves homes.
- 22 people, including 3 firefighters, were taken to hospitals, and 7 other firefighters had minor injuries (NTSB, Sep 2019).
- The utility served about 325,000 customers in Massachusetts (NTSB, Sep 2019).
- Over 50,000 residents were asked to evacuate (NTSB, Sep 2019).
- Gas service returned to most customers by December 16, 2018, three months later, and about 2,300 families were moved to hotels, apartments and trailers (NTSB, Sep 2019).
- The operator reported $1,586,502,068 in property damage for the event, more than any other report in PHMSA’s file (PHMSA, Apr 2026).
What did the NTSB find in other explosions?
Old equipment, missed calls and gas that traveled underground.
- In Silver Spring, Maryland, in August 2016, a gas explosion at a 14-unit apartment building killed 7 residents and sent 65 to hospitals (NTSB, Apr 2019).
- Washington Gas replaced 12,174 mercury service regulators in its system between October 2011 and September 2016 (NTSB, Apr 2019).
- With the mercury removed, test regulators leaked an average of 331 standard cubic feet of gas per hour through the vent piping (NTSB, Apr 2019).
- A resident of the building had called 911 about a strong gas smell on July 25, 2016, and the gas company had no record of any odor call from that address in the previous five years (NTSB, Apr 2019).
- In Dallas in February 2018, an explosion killed one person and injured four, and investigators found a through-wall crack in a 71-year-old main (NTSB, Jan 2021).
- The two days before the Dallas explosion saw two other gas incidents on the same block, each with one burn injury (NTSB, Jan 2021).
- In Millersville, Pennsylvania, in July 2017, a neighbor reported a gas smell at 10:26 a.m., and the house exploded at 12:32 p.m., killing one person, injuring three and damaging six nearby homes (NTSB, Feb 2019).
What do the incident totals look like?
The yearly property damage total is dominated by one event.
- Reported property damage for 2010 through 2025 totals $2.60 billion, and 2018 alone was $1.94 billion (PHMSA, Apr 2026).
- The deadliest single report is a 2014 event in New York City with 8 deaths and 48 injuries (PHMSA, Apr 2026).
- A 2023 incident in West Reading, Pennsylvania, is listed with 7 deaths and 3 injuries (PHMSA, Apr 2026).
Can People Smell a Gas Leak in Time?
The law says gas must smell, and it usually does. The trouble is that soil can strip the smell out before the gas reaches a house, and no one has to install an alarm.
 Figure 9: The odorant rule asks for a smell that a person with a normal sense of smell can detect at one-fifth of the lower explosive limit. Source: eCFR, 49 CFR 192.625, Oct 2026. Screenshot of the source page, captured 21 Oct 2026.
What does the odorant rule require?
Gas in a distribution line must be detectable by a person at one-fifth of the lowest concentration that can explode.
- Operators must sample gas periodically with an instrument that finds the percentage of gas in air at which the odor becomes readily detectable (eCFR, Oct 2026).
- The first federal odorization rules for distribution lines came from the Department of Transportation in 1970 (NTSB, Apr 2019).
Does odorant always give a warning?
No. The NTSB has documented cases where the gas met the rule and no one smelled it.
- The NTSB looked at 20 gas explosions and fires between 1971 and 2018 where gas had migrated or built up, and in several it cited odorant fade from soil as a factor (NTSB, Apr 2019).
- In Dallas, Atmos had five years of odorant tests showing the gas was readily detectable, yet none of the residents smelled gas before the explosion (NTSB, Jan 2021).
- In a 1982 explosion in Portales, New Mexico, five people died after gas from a damaged service line lost its odor in the soil (NTSB, Jan 2021).
- In multifamily buildings the regulator is often in a locked room or basement that residents cannot reach (NTSB, Apr 2019).
Are gas detectors required in homes?
No. Smoke and carbon monoxide alarms are common in codes, but gas alarms are not.
- The NTSB reports that methane or combustible gas alarms are not required by federal or state rules, or by building and fire codes, for homes (NTSB, Jan 2021).
- The NTSB has recommended gas detection in buildings since 1976, a span it counted as 45 years in 2021 (NTSB, Jan 2021).
- NFPA 715, a standard for installing fuel gas detection and warning equipment, has editions dated 2023 and 2026 (NFPA, Oct 2026).
- The NTSB recommended that 911 dispatch protocols tell dispatchers to call the gas company on any odor call, because the protocol used in Silver Spring did not (NTSB, Apr 2019).
How Many People Does Carbon Monoxide From Gas Appliances Kill?
Carbon monoxide is the quiet cousin of a gas leak. A gas appliance that burns badly gives off a gas you cannot smell, and heating equipment is where most of the gas-related deaths are.
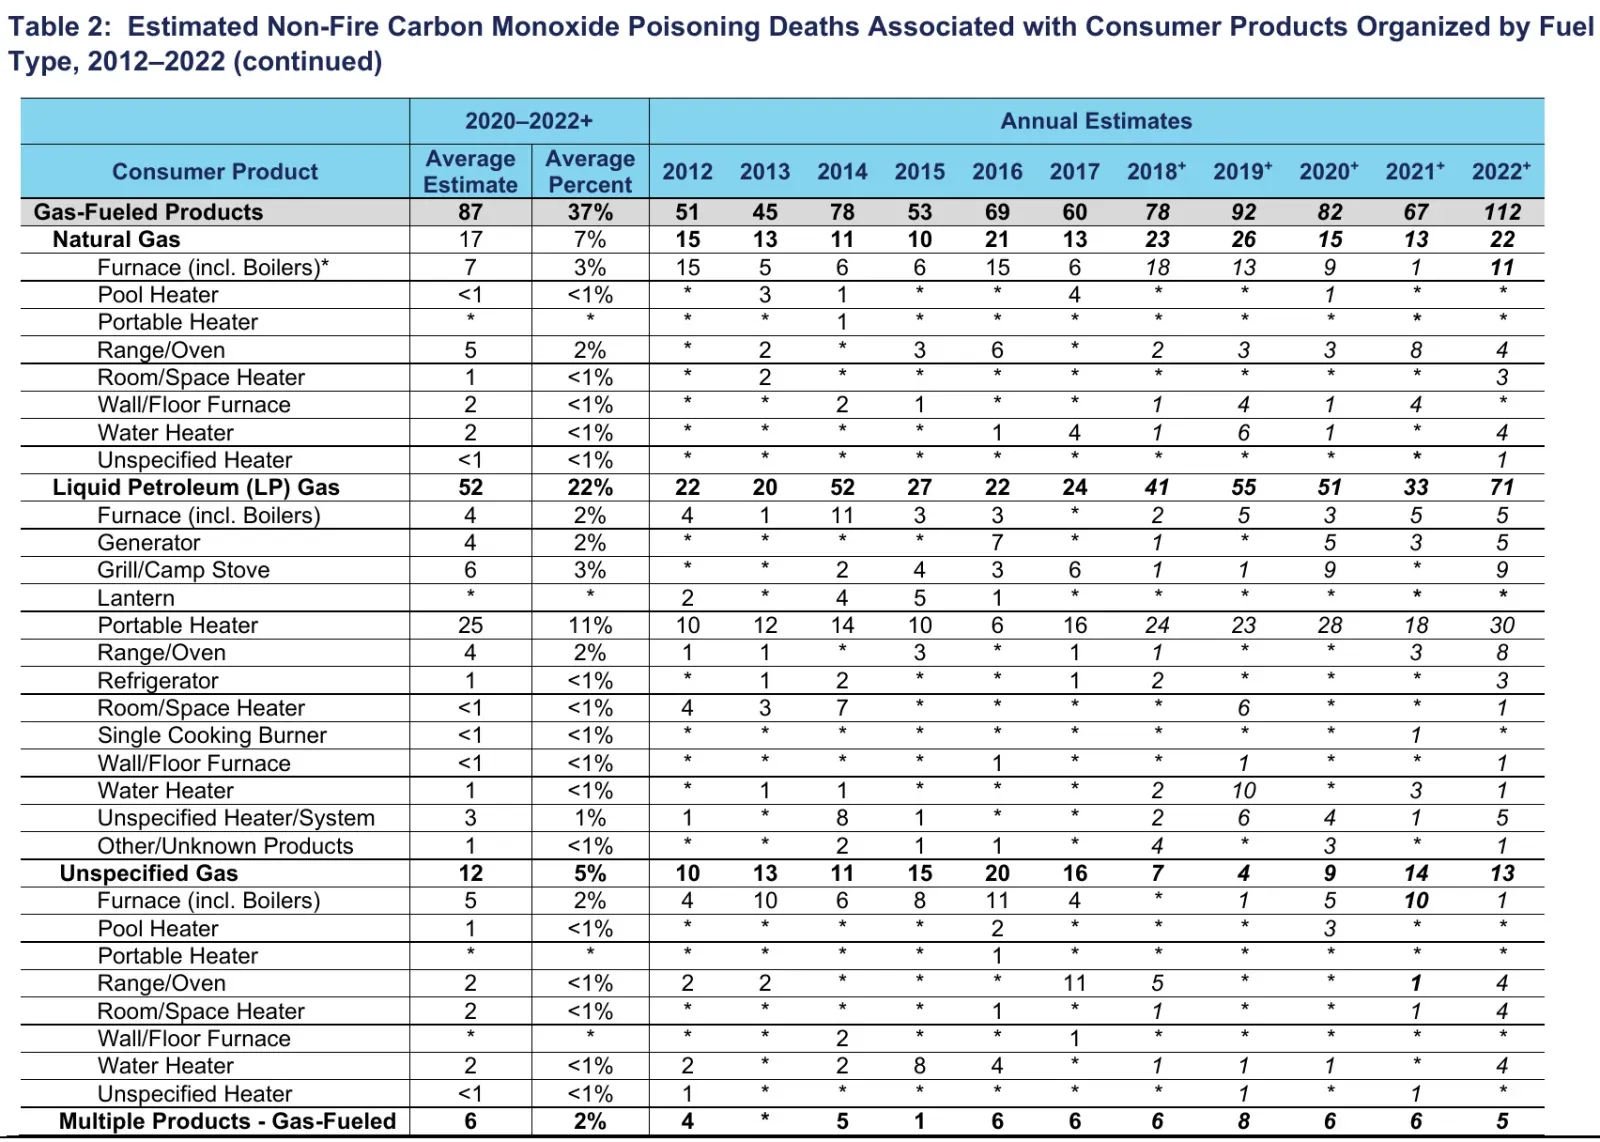 Figure 10: Gas-fueled products reached their highest yearly estimate of non-fire carbon monoxide deaths in 2022, in a series that starts in 2012. Source: CPSC, Non-Fire Carbon Monoxide Deaths Associated with the Use of Consumer Products, 2022 Annual Estimates, Table 2, May 2026. Screenshot of the source table, captured 21 Oct 2026.
How many deaths come from gas appliances?
About 87 a year on average in 2020 to 2022, and most are heating equipment.
- Gas-fueled products averaged an estimated 87 deaths a year in 2020 to 2022, 37 percent of consumer product CO deaths (CPSC, May 2026).
- An estimated 75 of the gas-fueled deaths in 2022, or 67 percent, were tied to heating systems or heaters (CPSC, May 2026).
- Natural gas products were tied to 22 deaths in 2022 and LP gas products to 71 (CPSC, May 2026).
- Natural gas furnaces and boilers were tied to 11 deaths in 2022, and natural gas ranges and ovens to 4 (CPSC, May 2026).
- LP gas portable heaters were tied to 30 deaths in 2022 (CPSC, May 2026).
- 59 percent of consumer product CO deaths in 2020 to 2022 happened in November, December, January and February (CPSC, May 2026).
- 64 percent of the 2022 deaths happened in a home location (CPSC, May 2026).
What does CPSC say about gas furnaces?
CPSC counts furnaces and boilers on their own, and it has proposed a rule to make them shut down when carbon monoxide builds up.
- Gas furnaces and boilers were tied to an estimated 21 CO deaths a year in 2017 to 2019, and 539 in the 20 years from 2000 to 2019 (CPSC, Oct 2023).
- CPSC staff estimated 30,587 nonfatal CO injuries from gas furnaces and boilers from 2014 to 2018 (CPSC, Oct 2023).
- The proposed rule would require a CO sensing shutdown and is projected to prevent 576 deaths and 160,699 injuries over 30 years (CPSC, Oct 2023).
What does the CDC advise?
Service the equipment every year and keep working alarms.
- The CDC says to have the heating system, water heater and any other gas appliance serviced by a qualified technician every year (CDC, Jan 2026).
- It says to replace a CO detector every 5 years or as the maker says, and never to heat a house with a gas oven (CDC, Jan 2026).
How Much Methane Escapes From Pipes and Stoves?
Less than in 1990, but more than the official counts say. Field studies keep finding more leaks than the inventory does.
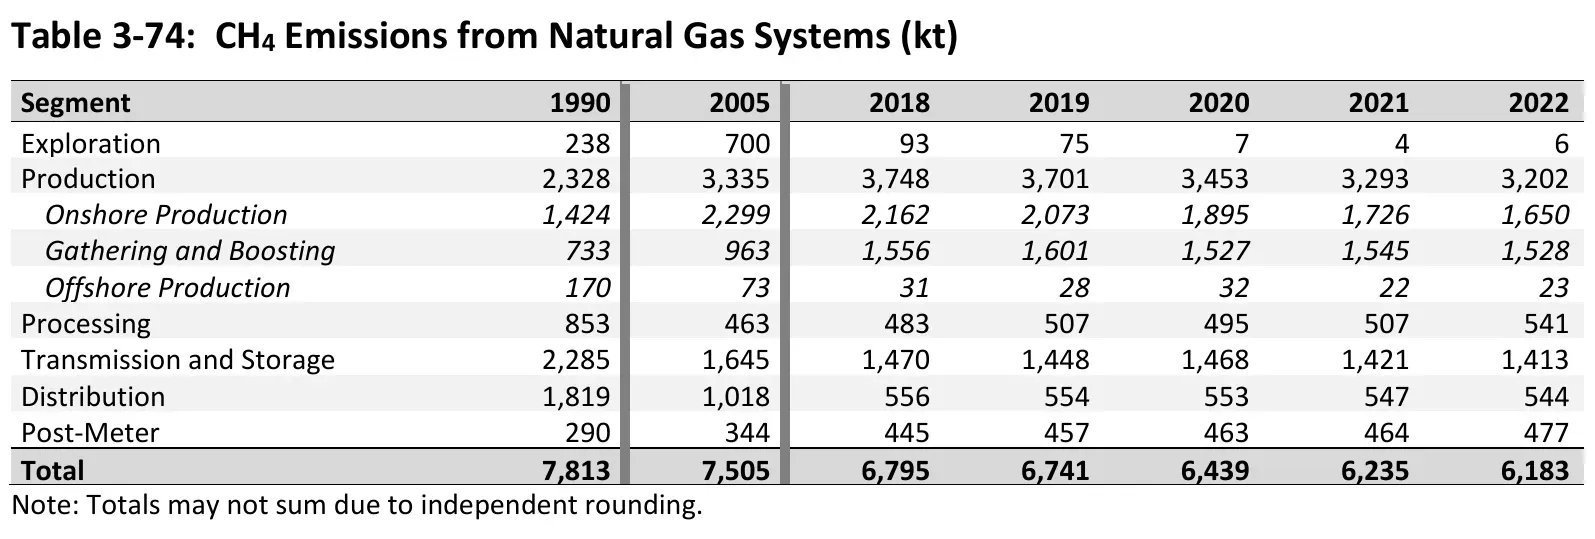 Figure 11: Distribution emissions fell sharply from 1990 to 2022, while post-meter emissions rose. Source: EPA, Inventory of U.S. Greenhouse Gas Emissions and Sinks 1990 to 2022, Table 3-74, Apr 2024. Screenshot of the source table, captured 21 Oct 2026.
What does the EPA inventory count?
Distribution pipes are 9 percent of natural gas system methane, and the part past the meter is 8 percent and growing.
- Distribution emissions were 9 percent of methane from natural gas systems in 2022, and 70 percent lower than in 1990 (EPA, Apr 2024).
- Post-meter emissions were about 8 percent of the total in 2022 and rose 65 percent from 1990, partly because more homes use gas (EPA, Apr 2024).
- Post-meter methane was 13.4 million metric tons of carbon dioxide equivalent in 2022 (EPA, Apr 2024).
What do field studies find in pipes?
More leaks than the inventory assumes.
- A national estimate found 630,000 leaks in US distribution mains, emitting 0.69 teragrams of methane a year, about 5 times the EPA’s figure for mains (Weller et al., Jul 2020).
- In the Boston region, 2.5 percent of the gas entering the area was lost, about three times higher than bottom-up estimates, with no significant trend over 8 years (Sargent et al., Nov 2021).
- A car-mounted survey found 5,893 pipeline leaks across 1,500 road miles of Washington, DC, and 12 of 19 tested manholes held concentrations in the explosive range (Jackson et al., Jan 2014).
What do field studies find in homes?
Stoves leak even when they are off.
- Natural gas stoves are in more than 40 million US homes, and total US stove emissions were estimated at 28.1 gigagrams of methane a year (Lebel et al., Jan 2022).
- More than three-quarters of the methane measured in 53 homes was released while the stove was off (Lebel et al., Jan 2022).
- Benzene was found in 99 percent of 185 unburned gas samples from 159 California stoves, at up to 66 parts per million by volume (Lebel et al., hazardous air pollutants, Oct 2022).
What Do Federal Rules Require After a Gas Leak?
The rules set how often utilities must look for leaks and how they must respond to a call. They say little about leaks that are not hazardous.
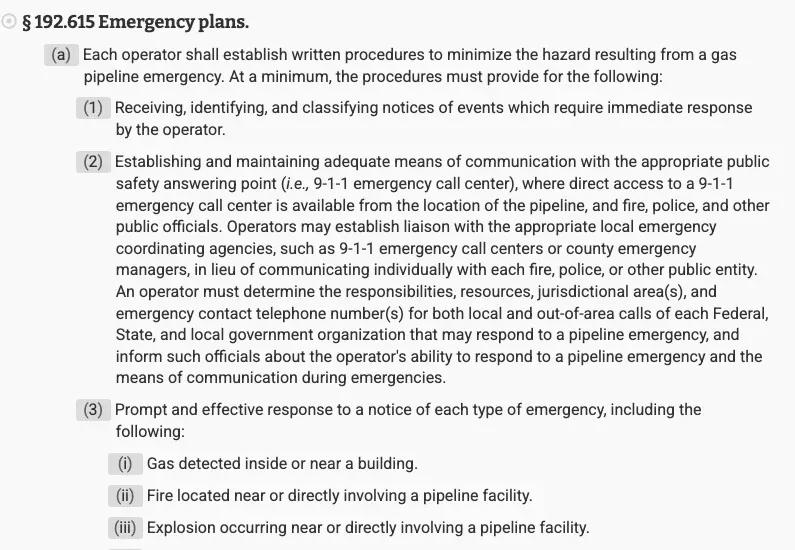 Figure 12: Gas detected inside or near a building is one of the emergencies every operator must have a written plan for. Source: eCFR, 49 CFR 192.615, Oct 2026. Screenshot of the source page, captured 21 Oct 2026.
How often must utilities survey for leaks?
At least yearly in business districts, and at least every five years elsewhere.
- Business districts must be surveyed at intervals not exceeding 15 months, and at least once each calendar year (eCFR, Oct 2026).
- Areas outside business districts must be surveyed at least once every 5 calendar years, at intervals not exceeding 63 months (eCFR, Oct 2026).
- Federal rules say only that hazardous leaks must be repaired promptly (eCFR, Oct 2026).
- An industry guide called the GPTC Guide calls for grade 2 leaks to be repaired within one calendar year and no later than 15 months, and states largely require 12 to 24 months (PHMSA, May 2023).
- In May 2023 PHMSA proposed a repair deadline of 3 years after a final rule is published for grade 3 leaks already known (PHMSA, May 2023).
What must a utility do on a leak call?
Have a written plan, answer it, and talk to 911.
- The emergency plan must cover prompt response to gas detected inside or near a building, plus fire, explosion and natural disaster (eCFR, Oct 2026).
- Since April 14, 2017, operators must install an excess flow valve on new or replaced service lines to single-family homes, and to multifamily and small commercial customers using up to 1,000 standard cubic feet per hour (eCFR, Oct 2026).
- Existing customers with eligible service lines can ask for an excess flow valve (eCFR, Oct 2026).
What changed after Merrimack Valley?
Congress told PHMSA to write new rules after Merrimack Valley. PHMSA published its proposal in September 2023.
- PHMSA proposed in September 2023 to require an opt-in customer alert system within 18 months of a final rule (PHMSA, Sep 2023).
- It would also require notifying emergency officials when a gas release shuts off service to 50 or more customers (PHMSA, Sep 2023).
- PHMSA expects an average of 75 incidents a year where distribution operators would need to alert customers (PHMSA, Sep 2023).
Methodology and Sources
This page uses primary sources only: federal agencies, the NTSB, a standards body that publishes its own research, and peer-reviewed studies. Every figure was read from the source document itself. Where the source is PHMSA’s incident or annual report file, the numbers were totaled by this page from the public data files, and any per-mile or per-ticket rate is this page’s own division. The incident file covers January 2010 through April 2026, so 2026 is excluded from yearly counts. The annual report files cover report year 2025. Reports can be revised by supplemental filings, so counts may shift by small amounts. PHMSA’s website blocks automated requests, so the data files were retrieved from Internet Archive copies of PHMSA’s pages dated September and October 2026. The links go to PHMSA’s own pages. Fire and explosion figures from NFPA are national estimates, not counts. The page is refreshed monthly.
Glossary
- 811: the national call-before-you-dig number.
- CGA: Common Ground Alliance, the damage prevention group that publishes the DIRT report.
- CO: carbon monoxide.
- CPSC: US Consumer Product Safety Commission.
- DIRT: Damage Information Reporting Tool.
- EIA: US Energy Information Administration.
- EPA: US Environmental Protection Agency.
- Grade 1, 2 and 3 leaks: utility rankings of a leak, from a hazard needing immediate action to a leak expected to stay harmless.
- LP-gas: liquefied petroleum gas, such as propane.
- Main: the large gas pipe under the street. A service line runs from the main to the meter.
- NFPA: National Fire Protection Association.
- NTSB: National Transportation Safety Board.
- PHMSA: Pipeline and Hazardous Materials Safety Administration.
- Post-meter: gas piping and appliances downstream of the meter.
Sources
- PHMSA, Gas Distribution Incident Data
- PHMSA, Gas Distribution Annual Report Data
- PHMSA, Gas Pipeline Leak Detection and Repair proposed rule
- PHMSA, Safety of Gas Distribution Pipelines and Other Pipeline Safety Initiatives proposed rule
- NTSB, Merrimack Valley, Massachusetts, NTSB/PAR-19/02
- NTSB, Silver Spring, Maryland, NTSB/PAR-19/01
- NTSB, Dallas, Texas, NTSB/PAR-21/01
- NTSB, Millersville, Pennsylvania, NTSB/PAB-19/01
- NTSB, Canton, Illinois, NTSB/PAB-18/02
- NFPA, Structure Fires Involving Flammable Gases and supporting tables
- NFPA, NFPA 715
- CPSC, Non-Fire Carbon Monoxide Deaths Associated with the Use of Consumer Products, 2022 Annual Estimates
- CPSC, Safety Standard for Residential Gas Furnaces and Boilers, proposed rule
- CDC, Carbon Monoxide Poisoning Basics
- CGA, 2024 DIRT Report
- EIA, Number of Natural Gas Residential Consumers
- EIA, Residential Energy Consumption Survey 2020, Table HC3.1 and Table HC6.1
- EIA, Natural gas pipelines
- EPA, Inventory of U.S. Greenhouse Gas Emissions and Sinks 1990 to 2022, Chapter 3
- eCFR, 49 CFR 191.3, 192.383, 192.615, 192.625, 192.703 and 192.723
- Lebel et al., Methane and NOx Emissions from Natural Gas Stoves, Cooktops, and Ovens in Residential Homes
- Lebel et al., Composition, Emissions, and Air Quality Impacts of Hazardous Air Pollutants in Unburned Natural Gas from Residential Stoves in California
- Weller et al., A National Estimate of Methane Leakage from Pipeline Mains in Natural Gas Local Distribution Systems
- Sargent et al., Majority of US urban natural gas emissions unaccounted for in inventories
- Jackson et al., Natural gas pipeline leaks across Washington, DC