Water consumption statistics tell two stories at once. Worldwide, the total taken from rivers and wells has leveled off in recent years, and farms still take most of it. In the places that run short, demand and supply are already close to even, and forecasts say more people will live that way by 2050.
This page gathers the latest numbers from the UN, the Food and Agriculture Organization, the World Bank, the World Resources Institute, the World Meteorological Organization, the US Geological Survey, the US Department of Agriculture and others. It covers global and US withdrawals, who uses the water, where it comes from, water stress, people without safe water, forecasts, energy and data centers, and efficiency. A withdrawal is water taken from a river, lake or well. Consumption is the part that does not come back, because it evaporates, ends up in crops or products, or is drunk. Sources differ in year and method, so totals do not always match. Every number carries its source and date.
For a plumbing shop, the big picture explains why local water rules, rebates and efficient fixtures keep spreading. For how a US home uses water, see the household water use numbers. For what leaks waste, see the water leak numbers. For tap water quality, see the drinking water numbers. For the trade itself, see the plumbing industry numbers. Updated October 2026.
Key Takeaways
- The world withdrew 3,853 billion cubic meters of freshwater in 2022 (World Bank WDI, Oct 2026).
- Between 1900 and 2010, world population grew 4.4 times while water withdrawal grew 7.3 times (FAO AQUASTAT, Oct 2026).
- Agriculture took 72% of global freshwater withdrawals in 2023, industry 15% and services 13% (UN SDG Extended Report 2026, Jul 2026).
- US water withdrawals were 322 billion gallons a day in 2015, the lowest level since before 1970 (USGS Circular 1441, Jun 2018).
- About 72% of the water withdrawn for US crop irrigation in 2020 was consumed and did not return to a river or aquifer (USGS Irrigation Water Use, Aug 2026).
- Groundwater-level declines have accelerated over the past four decades in 30% of the world’s regional aquifers (Nature, Jasechko et al., Jan 2024).
- 25 countries, home to one-quarter of the world’s people, face extremely high water stress every year (WRI, Aug 2023).
- About 4 billion people, half the world, live under highly water-stressed conditions for at least one month a year (WRI, Aug 2023).
- Global water demand is projected to rise 20% to 25% by 2050 (WRI, Aug 2023).
- 961 million people gained safely managed drinking water between 2015 and 2024 (UN SDG Report 2026, Jul 2026).
- Only 56% of household wastewater was safely treated in 2024 (UN SDG Extended Report 2026, Jul 2026).
- Rivers worldwide had one of their driest years in 35 years in 2025, with below-normal flows over 36% of global basin area (WMO, Sep 2026).
- US data centers directly consumed 21.2 billion liters of water in 2014 (Lawrence Berkeley National Laboratory, Dec 2024).
- Global water-use efficiency rose 24% between 2015 and 2023, from $17.4 to $21.5 of economic output per cubic meter (UN SDG Report 2026, Jul 2026).
How Much Freshwater Does the World Withdraw?
People take far more water from rivers and wells than a century ago, but the climb has slowed. Totals differ by source and year, so read each number with its date.
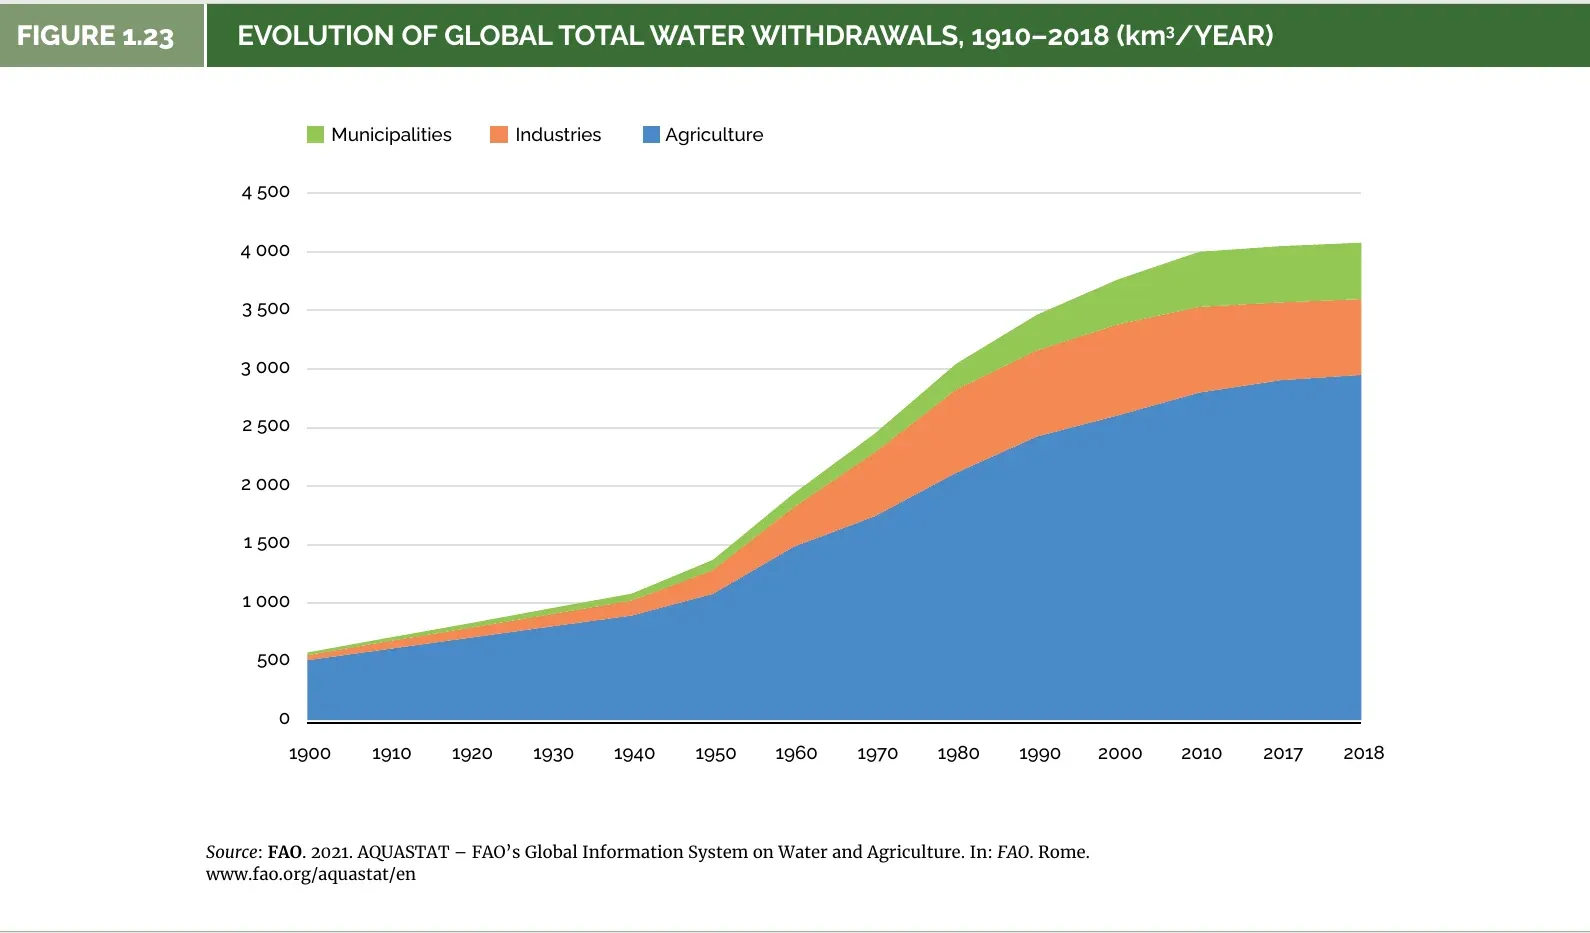 Figure 1: Global withdrawals rose from roughly 600 cubic kilometers a year in 1900 to more than 4,000 by 2018, and the blue farm layer is most of the total. Source: FAO, The State of the World’s Land and Water Resources for Food and Agriculture 2021, Figure 1.23, May 2022. Screenshot of page 71 of the source report (chart from FAO AQUASTAT), captured 21 Oct 2026.
How much water do people take from rivers and wells each year?
- Estimated withdrawals for all sectors exceeded 4,000 cubic kilometers a year in 2018, almost 10% of internal renewable water resources (FAO SOLAW 2021, May 2022).
- Total withdrawals were 4,022 billion cubic meters in 2023, only 0.29% above 2015 (UN SDG Extended Report 2026, Jul 2026).
- Global freshwater withdrawals have increased by roughly 1% a year since the 1980s as demand in developing countries surged (IEA, Mar 2017).
- Growth in withdrawals slowed to 0.5% a year between 2000 and 2010, from a peak of 4.2% a year between 1950 and 1960 (FAO AQUASTAT, Oct 2026).
- Global demand for water has more than doubled since 1960 (WRI, Aug 2023).
- Current demand for domestic, industrial and agricultural uses is about 4,600 cubic kilometers a year (IPCC AR6 Working Group II, Chapter 4, Feb 2022).
Which countries withdraw the most?
- India withdrew 647.5 billion cubic meters of freshwater in 2022, the most of any country, and China withdrew 568.5 billion (World Bank WDI, Oct 2026).
- The United States withdrew 444.3 billion cubic meters in 2022, third among all countries (World Bank WDI, Oct 2026).
- Indonesia withdrew 222.6 billion cubic meters and Pakistan 179.3 billion (World Bank WDI, Oct 2026).
How much fresh water does the planet have to draw on?
- About 110,000 cubic kilometers of precipitation fall on land each year, and 39%, or 43,000, becomes runoff and groundwater recharge, the renewable freshwater resources (FAO AQUASTAT, Oct 2026).
- Freshwater makes up only 2.5% of global water resources (IEA, Mar 2017).
- Renewable internal freshwater averaged 5,393 cubic meters per person worldwide in 2022 (World Bank WDI, Oct 2026).
- Canada had 73,170 cubic meters per person and the United States 8,437 (World Bank WDI, Oct 2026).
- China had 1,992 cubic meters per person and India 1,014 (World Bank WDI, Oct 2026).
- The United Arab Emirates had 14.9 cubic meters per person and Egypt 8.9 (World Bank WDI, Oct 2026).
- EU countries average about 8 to 9 thousand cubic meters per inhabitant, and Croatia has the most at 30,600 (Eurostat, Jul 2026).
- By the UN threshold of 1,700 cubic meters per inhabitant, Poland, Czechia, Cyprus and Malta are water stressed (Eurostat, Jul 2026).
Who Uses the Water: Farms, Factories or Cities?
Cities get the attention, but farms decide the totals. Only in rich countries does industry or the tap come first.
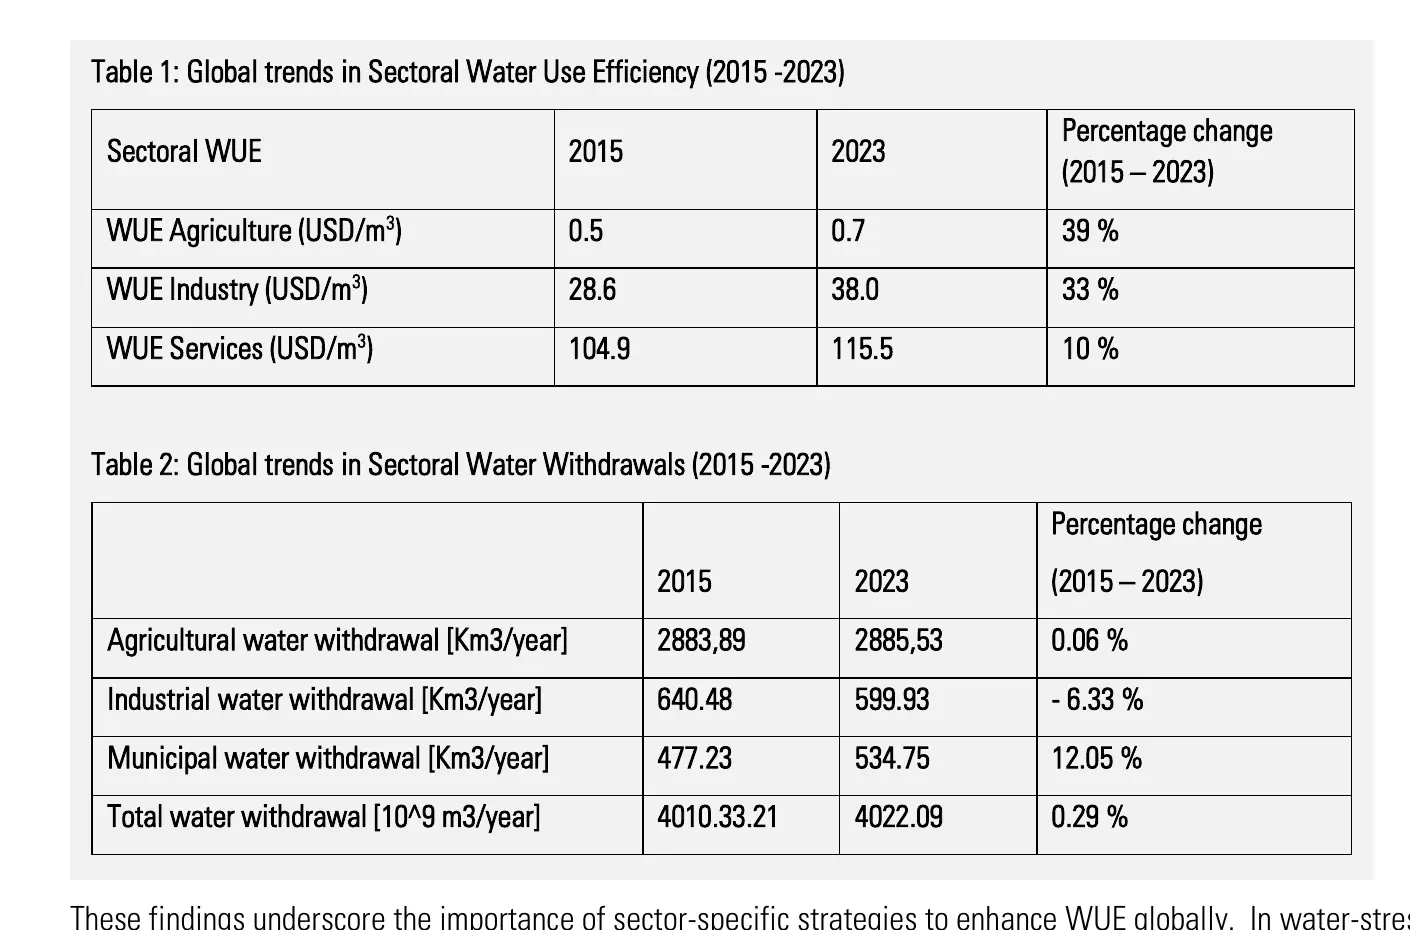 Figure 2: From 2015 to 2023, farm withdrawals stayed flat, city withdrawals grew and industrial withdrawals fell, while farms remain far less productive per cubic meter than industry or services. Source: UN, SDG Extended Report 2026, Goal 6, Jul 2026. Screenshot of the report’s Tables 1 and 2 (FAO data), captured 21 Oct 2026.
How is global withdrawal split between farms, industry and cities?
- In 2018, agriculture withdrew 2,950 cubic kilometers, industry 646 and municipalities 483 (FAO SOLAW 2021, May 2022).
- Municipal withdrawals grew 12.05% from 2015 to 2023, to 534.75 cubic kilometers a year (UN SDG Extended Report 2026, Jul 2026).
- Industrial withdrawals fell 6.33% over the same years, to 599.93 cubic kilometers a year, though industrial use is often underreported (UN SDG Extended Report 2026, Jul 2026).
- Agricultural withdrawals were essentially flat, up 0.06% to 2,885.53 cubic kilometers a year (UN SDG Extended Report 2026, Jul 2026).
- Globally, withdrawal ratios are 69% agricultural, 12% municipal and 19% industrial, but the average country is 59%, 23% and 18% because a few heavy users skew the global figure (FAO AQUASTAT, Oct 2026).
- Irrigated agriculture takes roughly 70% of global freshwater withdrawals and up to 85% in some developing countries (IEA, Mar 2017).
How different is the split by region and country?
- South Asia splits 91% agricultural, 7% municipal and 2% industrial, while Western Europe splits 5%, 23% and 73% (FAO AQUASTAT, Oct 2026).
- Across Europe, agriculture withdraws 30%, municipalities 26% and industry 45% (FAO SOLAW 2021, May 2022).
- Agriculture took 90.4% of India’s freshwater withdrawals in 2022 and 94.0% of Pakistan’s (World Bank WDI, Oct 2026).
- In the United States, agriculture took 39.7% of freshwater withdrawals in 2022 (World Bank WDI, Oct 2026).
- Industry took 47.2% of US freshwater withdrawals and domestic use 13.1% (World Bank WDI, Oct 2026).
- Domestic use took 74.0% of withdrawals in the United Kingdom, and industry took 54.3% in Germany (World Bank WDI, Oct 2026).
How much does irrigation matter?
- Land equipped for irrigation almost doubled in 60 years, from 139 million hectares in 1961 to over 328 million in 2018 (FAO SOLAW 2021, May 2022).
- China and India each had 70 million hectares equipped for irrigation in 2018, the United States 27 million and Pakistan 20 million (FAO SOLAW 2021, May 2022).
- Irrigated production is responsible for approximately 40% of agricultural output (FAO SOLAW 2021, May 2022).
- Globally, 23% of croplands are irrigated, providing 34% of global calorie production (IPCC AR6 Working Group II, Chapter 4, Feb 2022).
- Some 12% of irrigation water withdrawals is attributable to fodder crops (FAO SOLAW 2021, May 2022).
How much water goes into growing food?
- The global water footprint of crop production in 1996 to 2005 was 7,404 billion cubic meters a year, 78% green, 12% blue and 10% grey (Mekonnen and Hoekstra, Hydrology and Earth System Sciences, May 2011).
- The global average blue water footprint of crop production was 899 billion cubic meters a year (Mekonnen and Hoekstra, Hydrology and Earth System Sciences, May 2011).
How Much Water Does the United States Withdraw, and for What?
Two uses dominate in the US: cooling power plants and watering crops. Public supply, the system that feeds homes and businesses, is a distant third.
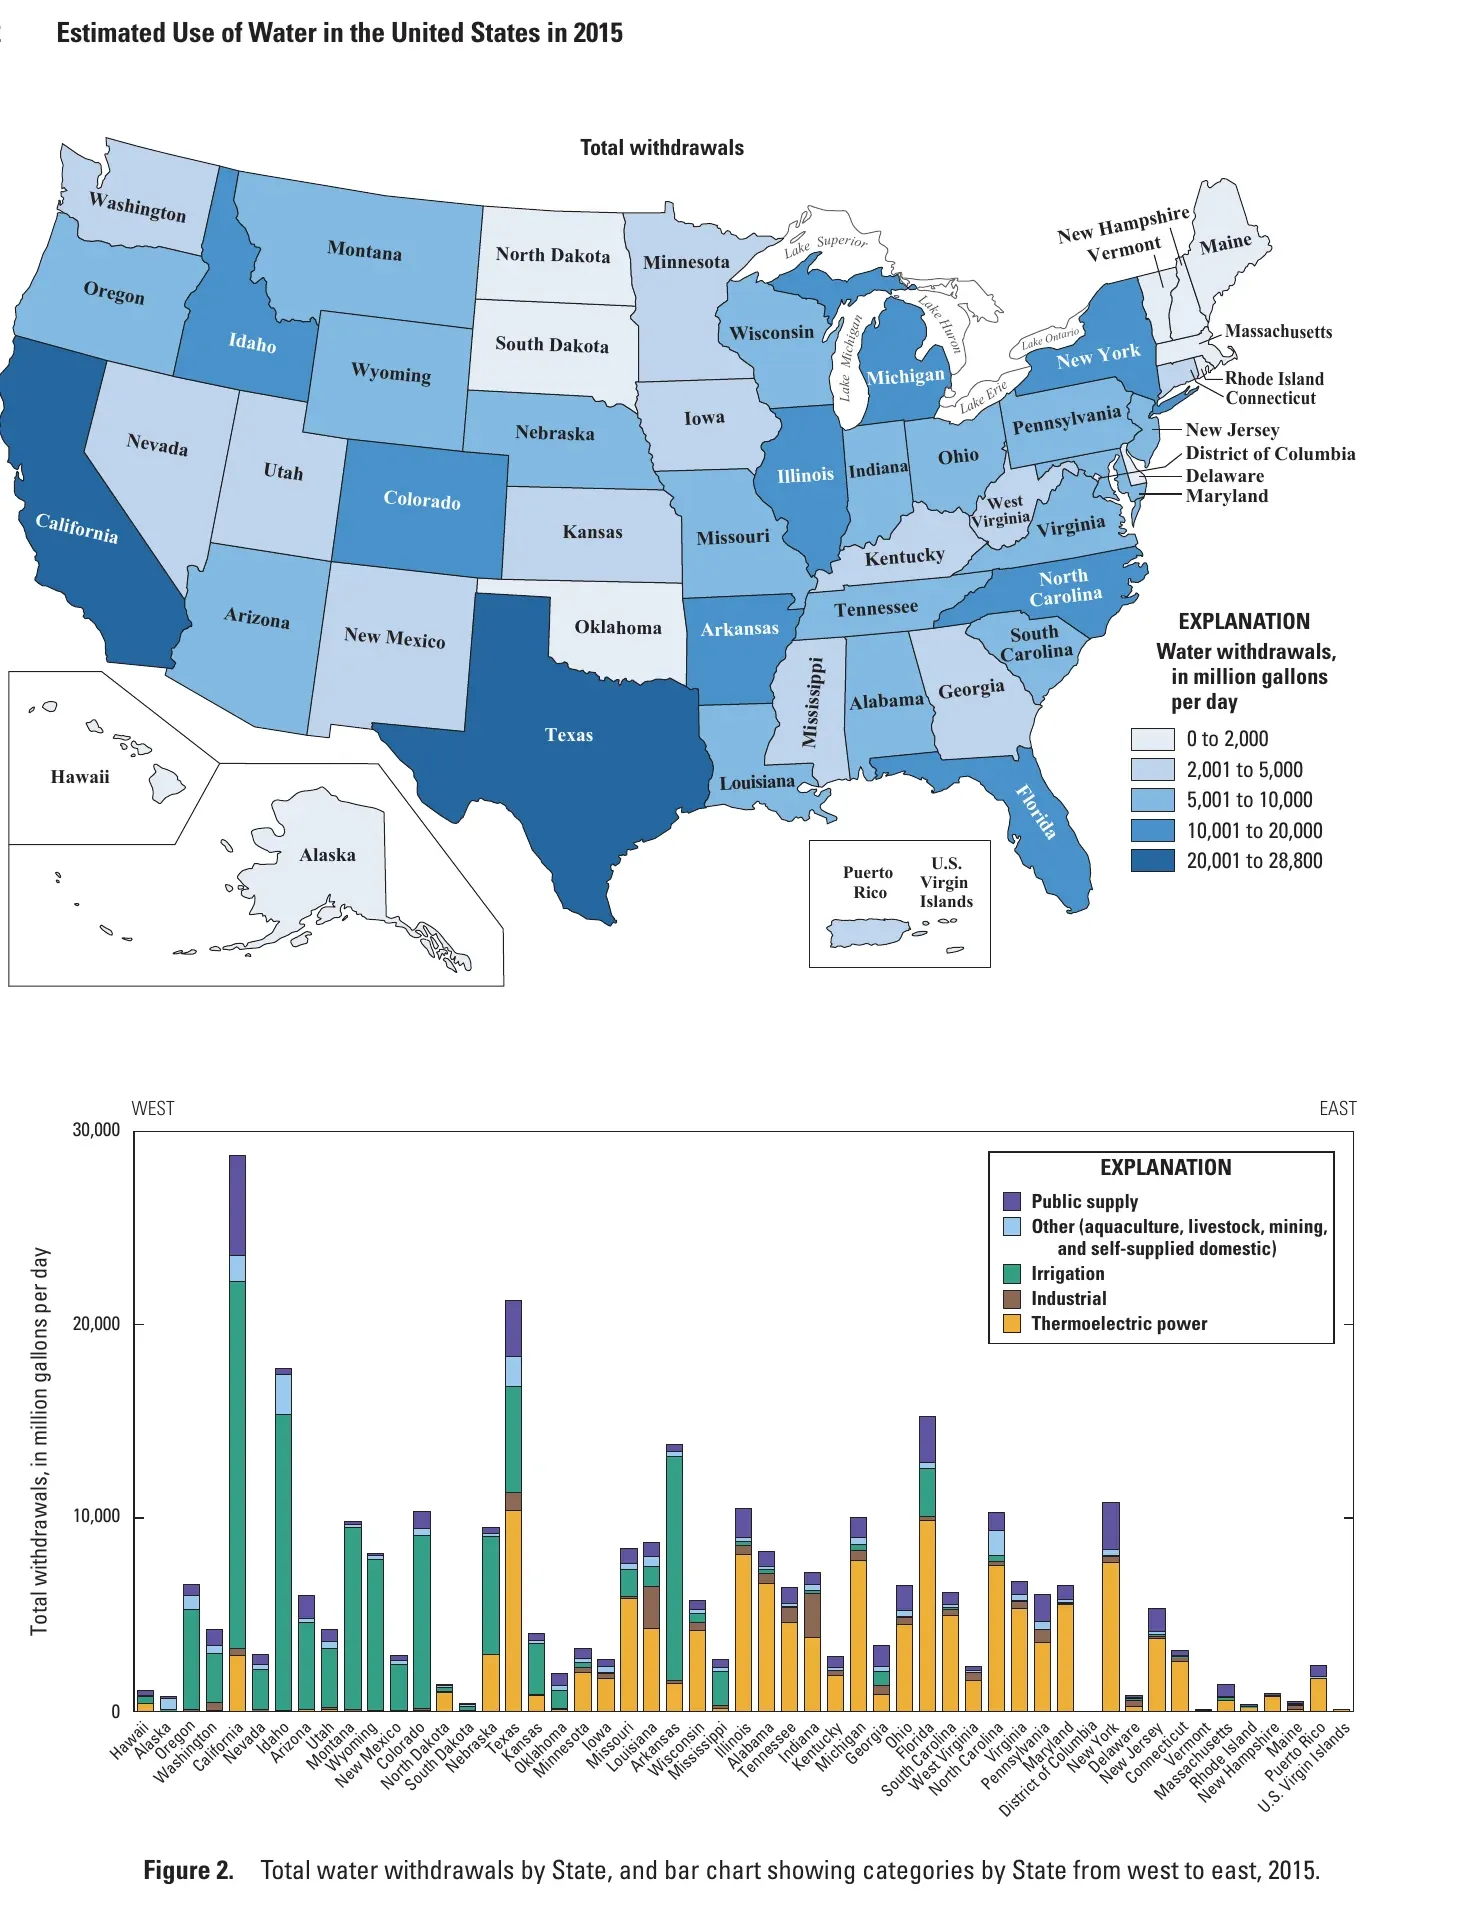 Figure 3: Withdrawals by state split into two water economies, with irrigation (green) dominating the West and power plants (orange) dominating the East. Source: USGS, Estimated Use of Water in the United States in 2015, Circular 1441, Jun 2018. Screenshot of page 12 of the source report, captured 21 Oct 2026.
How much water does the US withdraw?
- Freshwater withdrawals were 281 billion gallons a day in 2015, 87% of the total, and saline withdrawals were 41.0 billion gallons a day (USGS Circular 1441, Jun 2018).
- Total withdrawals in 2015 were 9% lower than in 2010 (USGS Circular 1441, Jun 2018).
- More than 50% of total US withdrawals in 2015 came from 12 states (USGS Circular 1441, Jun 2018).
- California accounted for almost 9% of total withdrawals and Texas for almost 7% (USGS Circular 1441, Jun 2018).
Which uses take the most?
- Thermoelectric power withdrew 133 billion gallons a day in 2015, which was 41% of all withdrawals (USGS Circular 1441, Jun 2018).
- Irrigation withdrew 118 billion gallons a day, 42% of all freshwater withdrawals (USGS Circular 1441, Jun 2018).
- Public supply withdrew 39.0 billion gallons a day, 7% less than in 2010 (USGS Circular 1441, Jun 2018).
- Self-supplied industrial withdrawals were 14.8 billion gallons a day, down from a peak of 47 in 1970 (USGS Circular 1441, Jun 2018).
- Aquaculture withdrew 7.55 billion gallons a day, 16% less than in 2010 (USGS Circular 1441, Jun 2018).
- Mining withdrew 4.00 billion gallons a day and livestock 2.00 (USGS Circular 1441, Jun 2018).
What do the newer 2020 estimates show?
- Around 90% of daily water use in the lower 48 states goes to crop irrigation, thermoelectric power plants and public supply, which add up to 224,000 million gallons of freshwater a day (USGS Water Use in the United States, Sep 2026).
- About 110,904 million gallons a day were withdrawn for crop irrigation in 2020 (USGS Irrigation Water Use, Aug 2026).
- The California-Nevada region withdrew the most for irrigation, about 24.6% of the national total (USGS Irrigation Water Use, Aug 2026).
- About 59,889 million gallons a day of freshwater were withdrawn for thermoelectric power in 2020 (USGS Thermoelectric Power Water Use, Sep 2026).
- About 35,823 million gallons a day were withdrawn for public supply in 2020 (USGS Public Supply Water Use, Sep 2026).
- Public supply withdrawals peak in July at 43,697 million gallons a day and bottom out in January at 29,971 (USGS Public Supply Water Use, Sep 2026).
- About 83% of people in the United States got their water from public systems in 2020 (USGS Public Supply Water Use, Sep 2026).
- Self-supplied domestic withdrawals, typically from private wells, were about 4,740 million gallons a day in 2020 (USGS Domestic Self-Supplied Water Use, Oct 2026).
How much of the water withdrawn is consumed?
- Consumptive use for irrigation was 73.2 billion gallons a day in 2015, 62% of the water used for irrigation (USGS Circular 1441, Jun 2018).
- Consumptive use for thermoelectric power was 4.31 billion gallons a day, 3% of its withdrawals (USGS Circular 1441, Jun 2018).
- Consumptive use was about 12% of public-supply withdrawals in 2020, or 4,241 million gallons a day (USGS Public Supply Water Use, Sep 2026).
What does USDA say about irrigated farms?
- Irrigation accounted for 47% of the nation’s freshwater withdrawals between 2010 and 2020 (USDA ERS, Jan 2026).
- Farms with some irrigation made more than 50% of US crop sales, on irrigated land that is less than 17% of harvested cropland (USDA ERS, Jan 2026).
- The 2022 Census of Agriculture counted 54.9 million acres of irrigated crop and pastureland, and California had the most irrigated cropland at 8.2 million acres (USDA ERS, Jan 2026).
- The average irrigation application rate fell from more than 2 acre-feet per acre in 1979 to just over 1.5 in 2022 (USDA ERS, Jan 2026).
How Much Water Comes From Wells and Aquifers?
Groundwater is the quiet half of the story. It is pumped more every decade, and most countries watch it less closely than they watch rivers.
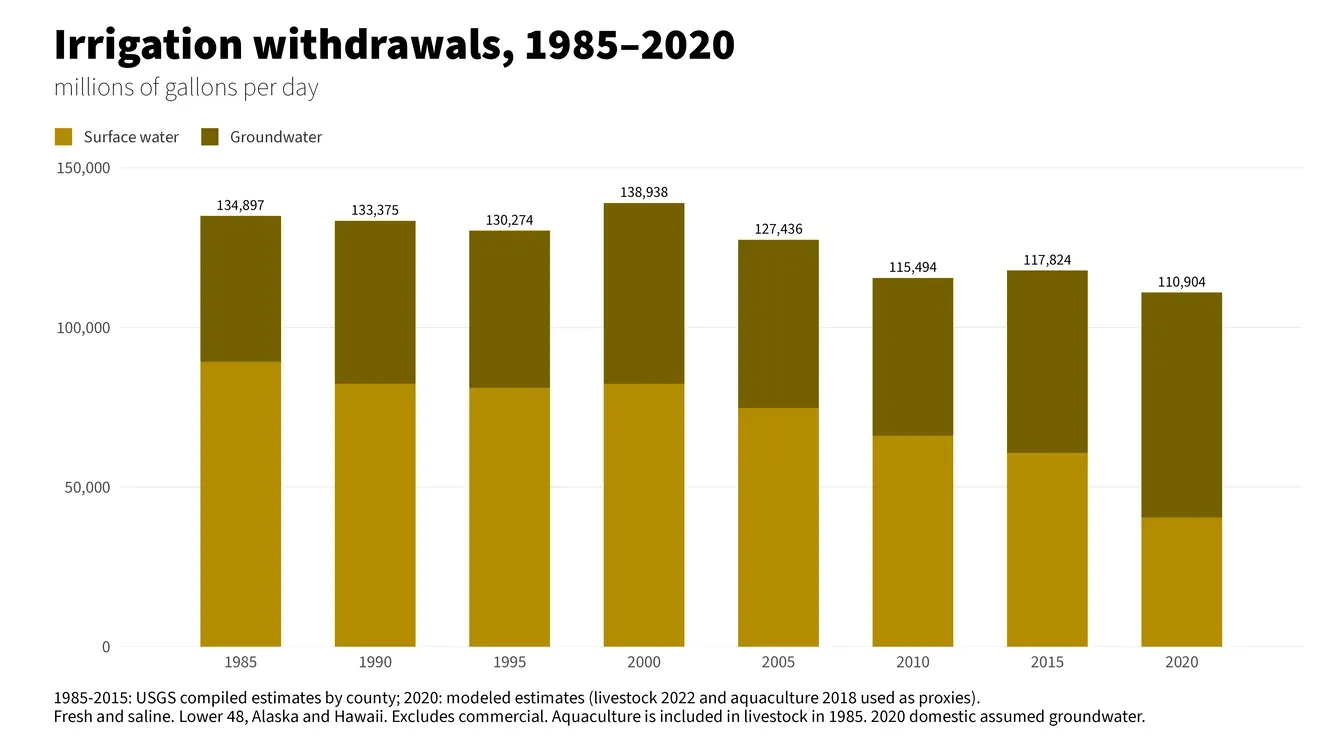 Figure 4: US irrigation withdrawals trend down since 2000, but the dark groundwater layer keeps getting thicker as surface water supplies shrink. Source: USGS, Irrigation Water Use, Aug 2026. Chart published by the source, captured 21 Oct 2026.
How much groundwater do people pump?
- Global groundwater abstraction is 789 cubic kilometers a year, about 6% of annual recharge, though hotspots of depletion have emerged (IPCC AR6 Working Group II, Chapter 4, Feb 2022).
- Groundwater withdrawals for irrigated agriculture were 820 cubic kilometers in 2018, up 19% from 688 in 2010, a growth rate of 2.2% a year (FAO SOLAW 2021, May 2022).
- Groundwater accounts for over 30% of freshwater withdrawals for irrigated agriculture (FAO SOLAW 2021, May 2022).
- About 70% of groundwater withdrawals irrigate food, fibre and industrial crops and water livestock (FAO SOLAW 2021, May 2022).
How is the US shifting toward groundwater?
- Fresh surface-water withdrawals were 198 billion gallons a day in 2015, 14% less than in 2010, while fresh groundwater withdrawals were 82.3 billion, about 8% more (USGS Circular 1441, Jun 2018).
- Groundwater supplied about 34% of US irrigation withdrawals in 1985, 48% in 2015 and 64% in 2020 (USGS Irrigation Water Use, Aug 2026).
- Groundwater supplied 48% of public-supply withdrawals in 2020, up from 39% in 2015 (USGS Public Supply Water Use, Sep 2026).
Are aquifers holding up?
- A study of in-ground water levels used about 170,000 monitoring wells and 1,693 aquifer systems in countries that account for about 75% of global groundwater withdrawals (Nature, Jasechko et al., Jan 2024).
- Rapid groundwater-level declines of more than 0.5 meters a year are widespread, especially in dry regions with extensive croplands (Nature, Jasechko et al., Jan 2024).
- Groundwater exploitation is considered responsible for a loss of aquifer storage of 250 cubic kilometers a year (FAO SOLAW 2021, May 2022).
- Between 10% and 23% of the world’s watersheds have reached environmental flow limits because of groundwater pumping (IPCC AR6 Working Group II, Chapter 4, Feb 2022).
- Nearly two-thirds of monitored wells worldwide showed conditions outside the historical norm in 2025 (WMO, Sep 2026).
Which Countries and People Face Water Stress?
Water stress compares what people take with what nature supplies. A country can be rich overall and still have cities and farms that run short.
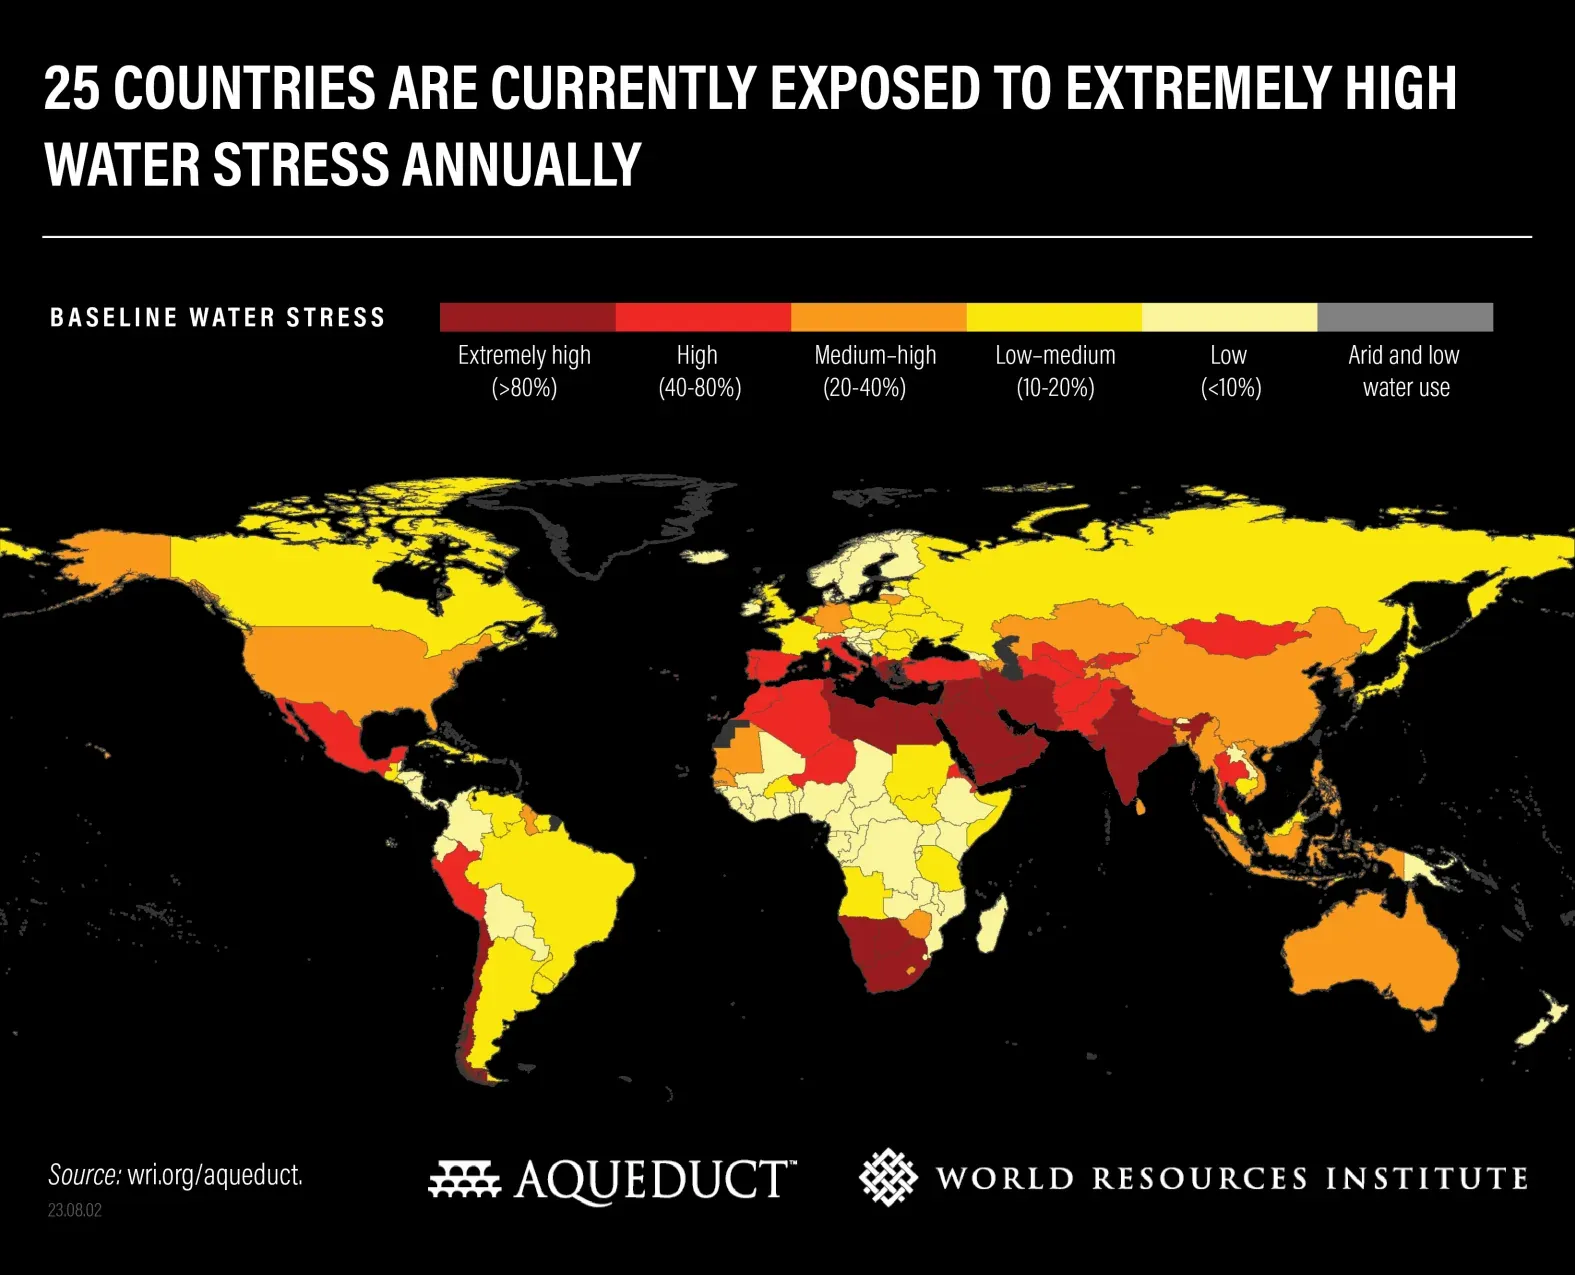 Figure 5: The darkest red countries use more than 80% of their supply every year, a band that runs from North Africa through the Middle East and South Asia. Source: WRI, 25 Countries Face Extremely High Water Stress, Aug 2023. Chart published by the source, captured 21 Oct 2026.
How much of the water supply do countries use?
- The global average level of water stress held at 18% in 2023, nearly matching 2015 (UN SDG Report 2026, Jul 2026).
- In Northern Africa and Western Asia and in Central and Southern Asia, water stress exceeds 75% (UN SDG Report 2026, Jul 2026).
- Around 10% of the global population lives in countries with high or critical stress (UN SDG Report 2026, Jul 2026).
- WRI calls a country extremely stressed when it uses at least 80% of its available supply and highly stressed at 40% (WRI, Aug 2023).
Which countries and regions are the most stressed?
- WRI’s ranking of the most water-stressed countries includes Bahrain, Cyprus, Kuwait, Lebanon, Oman and Qatar (WRI, Aug 2023).
- In the Middle East and North Africa, 83% of the population is exposed to extremely high water stress (WRI, Aug 2023).
- In South Asia, 74% of the population is exposed to extremely high water stress (WRI, Aug 2023).
- Water scarcity affected 28% of EU territory and 32% of the EU population during at least one season in 2023 (European Environment Agency, Nov 2025).
- In southern Europe, about 30% of the population lives in areas with permanent water stress and up to 70% in areas with seasonal summer stress (European Environment Agency, Nov 2025).
Who and what is exposed?
- 60% of the world’s irrigated agriculture faces extremely high water stress (WRI, Aug 2023).
- 1.42 billion people, including 450 million children, live in areas of high or extremely high water vulnerability (UNICEF, Reimagining WASH: Water Security for All, Mar 2021).
- Nearly 3 billion people and more than half of the world’s food production are in areas where total water storage is projected to decline (Global Commission on the Economics of Water, Oct 2024).
- Water-dependent sectors such as agriculture, energy and industry support around 1.7 billion jobs worldwide (World Bank, Oct 2026).
How Many People Still Lack Safe Water, Sanitation and Hygiene?
The world added billions of safe connections in a decade, and billions are still waiting. The gap runs along income, rural life and conflict.
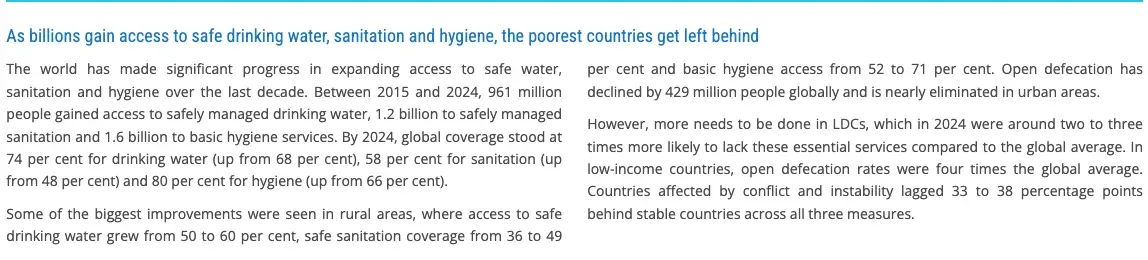 Figure 6: The UN’s 2026 progress summary shows gains in every service and a clear gap for the poorest countries and for conflict zones. Source: UN, The Sustainable Development Goals Report 2026, Goal 6, Jul 2026. Screenshot of the source page, captured 21 Oct 2026.
How much progress has the world made?
- By 2024, 74% of the world’s population had safely managed drinking water, 58% safely managed sanitation and 80% basic hygiene, up from 68%, 48% and 66% in 2015 (UN SDG Report 2026, Jul 2026).
- Between 2015 and 2024, 1.2 billion people gained safely managed sanitation and 1.6 billion gained basic hygiene services (UN SDG Report 2026, Jul 2026).
- Between 2000 and 2024, about a third of the world, 2.8 billion people, gained safely managed sanitation (WHO/UNICEF JMP, Aug 2025).
Where is the gap widest?
- In rural areas, safe drinking water grew from 50% to 60% of people, safe sanitation from 36% to 49% and basic hygiene from 52% to 71% (UN SDG Report 2026, Jul 2026).
- In least developed countries, people were two to three times more likely to lack these services than the global average (UN SDG Report 2026, Jul 2026).
- Open defecation declined by 429 million people globally, but low-income countries had rates four times the global average (UN SDG Report 2026, Jul 2026).
- Countries affected by conflict and instability lagged 33 to 38 percentage points behind stable countries on all three measures (UN SDG Report 2026, Jul 2026).
What would it cost to close the gap?
- Meeting the water supply and sanitation goals requires $131 to $140 billion a year, nearly double current public funding (World Bank, Oct 2026).
- Universal access to safe drinking water, sanitation and hygiene by 2030 needs an estimated $1.04 trillion in infrastructure (World Bank, Oct 2026).
- Aid commitments to the water sector rose from $10.3 billion in 2023 to $11.0 billion in 2024 (UN SDG Extended Report 2026, Jul 2026).
- Aid disbursements to the water sector rose from $8.9 billion in 2023 to $9.6 billion in 2024 (UN SDG Extended Report 2026, Jul 2026).
- Women and girls spend 200 million hours each day collecting and hauling water (Global Commission on the Economics of Water, Oct 2024).
How Fast Is Water Demand Growing, and What Do Forecasts Say?
Demand will not grow evenly. Rich countries have flattened out, while demand in Africa is set to jump, and several forecasters expect the strain to reach food and income.
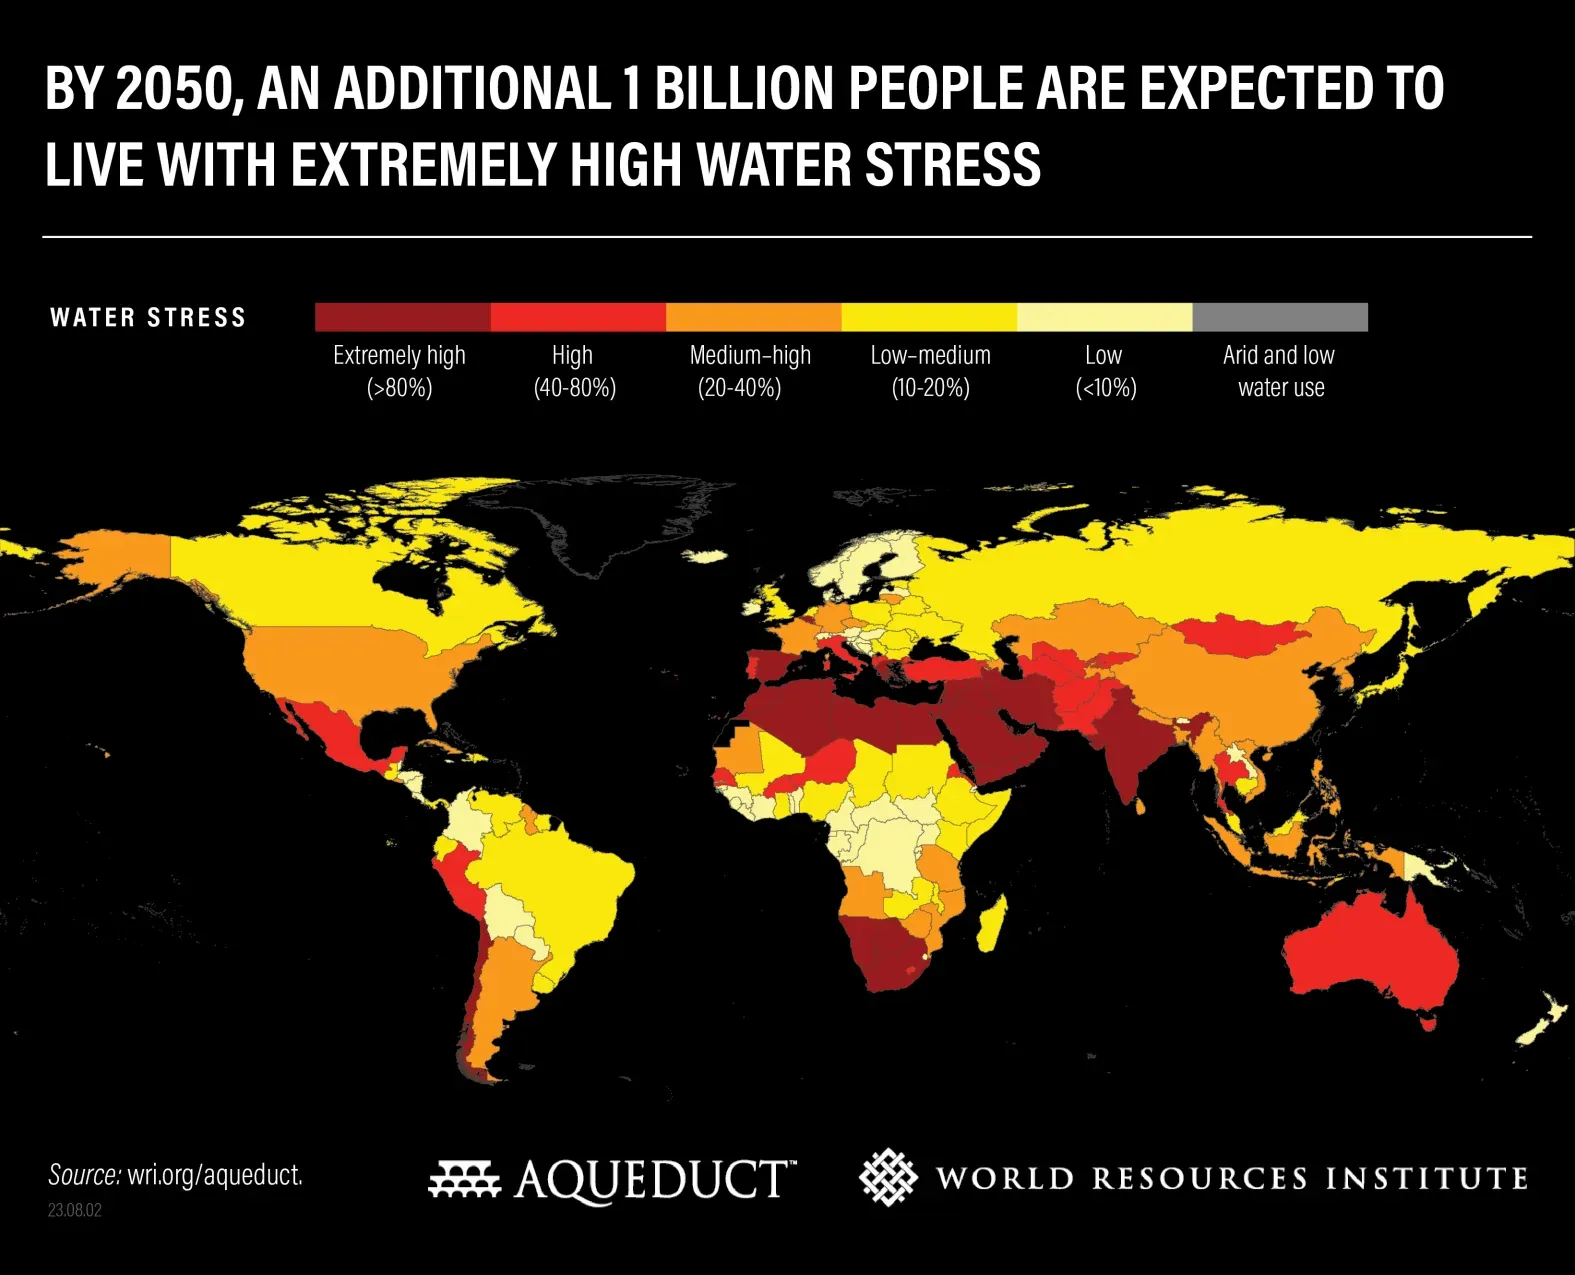 Figure 7: By 2050 the extremely high stress band widens across North Africa and the Middle East, and Australia moves into the high stress category. Source: WRI, 25 Countries Face Extremely High Water Stress, Aug 2023. Chart published by the source, captured 21 Oct 2026.
How much more water will the world want?
- Water demand in Sub-Saharan Africa is expected to rise 163% by 2050, four times the rate of Latin America, the next highest region at 43% (WRI, Aug 2023).
- An additional 1 billion people are expected to live with extremely high water stress by 2050 (WRI, Aug 2023).
- The number of watersheds with highly variable year-to-year supply is expected to rise 19% by 2050 (WRI, Aug 2023).
- By 2050, the share of people exposed to water stress for at least one month a year could be closer to 60% (WRI Aqueduct 4.0 technical note, Aug 2023).
- The IPCC projects global water demand to rise 20% to 30% by 2050, depending on the socioeconomic scenario (IPCC AR6 Working Group II, Chapter 4, Feb 2022).
- Domestic water withdrawal is projected to reach 700 to 1,500 cubic kilometers a year by 2050, an increase of 50% to 250% over 2010 (IPCC AR6 Working Group II, Chapter 4, Feb 2022).
- Industry and energy are projected to rise to 24% of global water demand by 2050 (IPCC AR6 Working Group II, Chapter 4, Feb 2022).
- The IEA expected withdrawals to rise almost 10% from 2014 to 2040 and consumption to rise over 20% (IEA, Mar 2017).
- Municipal withdrawals were 13% of the total in 2014 and are projected to reach 17% in 2040 (IEA, Mar 2017).
What could shortages cost?
- 31% of global GDP, or $70 trillion, will be exposed to high water stress by 2050, up from $15 trillion in 2010 (WRI, Aug 2023).
- India, Mexico, Egypt and Turkey account for over half of the GDP exposed to high water stress in 2050 (WRI, Aug 2023).
- Water scarcity, worsened by climate change, could cost some regions up to 6% of GDP by 2050 (World Bank, High and Dry, May 2016).
- High-income countries could see GDP shrink 8% by 2050 on average from water pressures, and lower-income countries 10% to 15% (Global Commission on the Economics of Water, Oct 2024).
- If current trends persist, extreme water storage declines could make irrigation unfeasible and cut global cereal production by 23% (Global Commission on the Economics of Water, Oct 2024).
How many people face scarcity as the climate warms?
- Between 3 and 4 billion people are projected to face physical water scarcity at 2 and 4 degrees of warming, a finding the IPCC rates low confidence (IPCC AR6 Working Group II, Chapter 4, Feb 2022).
- Water demand in nearly a third of the world’s largest cities could exceed surface water availability by 2050 (IPCC AR6 Working Group II, Chapter 4, Feb 2022).
- Globally, 11% of croplands are estimated to be vulnerable to climate-driven water scarcity by 2050 (IPCC AR6 Working Group II, Chapter 4, Feb 2022).
What Are Droughts and Shrinking Rivers Doing to Supply?
Supply is getting less predictable, and that matters as much as the average. Systems are built for normal years, and normal is rarer. For the flood side, see the flood numbers.
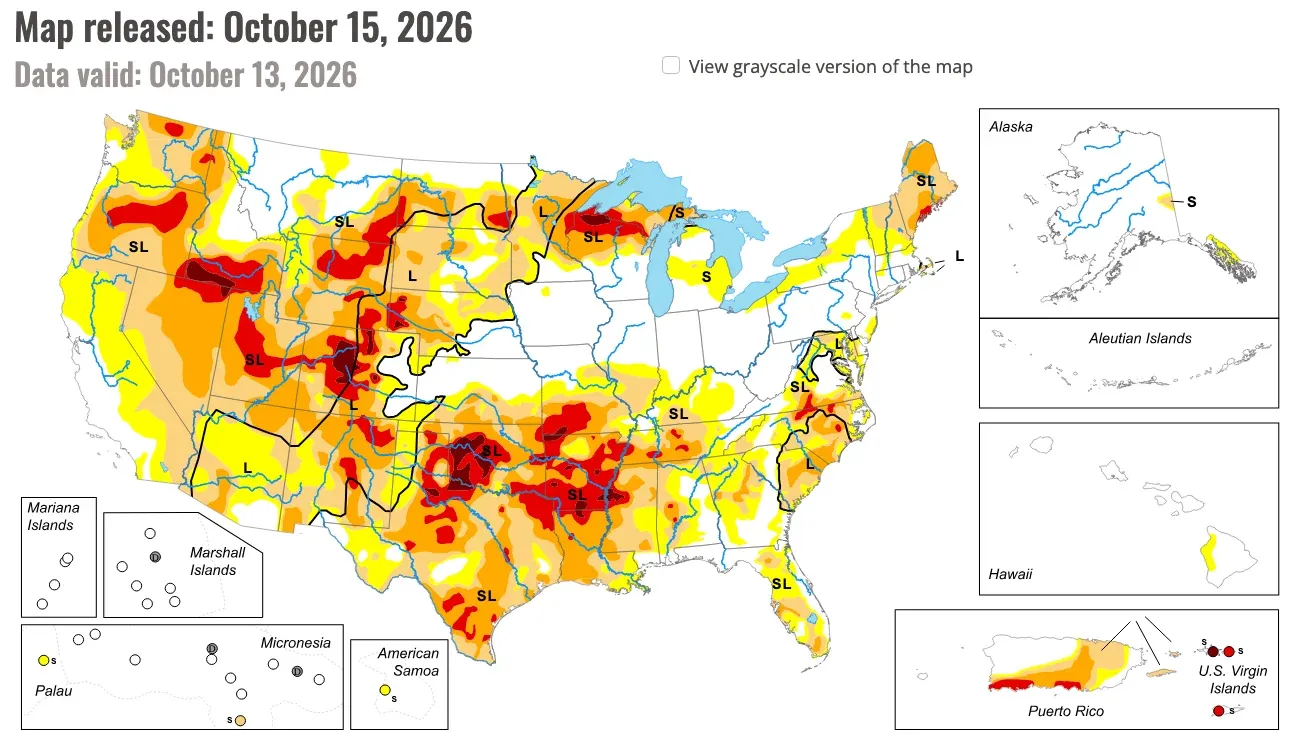 Figure 8: Drought covers large parts of the West, the Plains and the Mississippi Valley, with the deepest red over the southern Plains and the Great Basin. Source: U.S. Drought Monitor, National Drought Mitigation Center, Oct 2026. Screenshot of the Current Map page (map released 15 Oct 2026, data valid 13 Oct 2026), captured 21 Oct 2026.
What is the global picture for rivers and stored water?
- For the seventh year in a row, river basins with normal conditions were a minority, between 34% and 38%, against an average of 46% from 1991 to 2020 (WMO, Sep 2026).
- Global terrestrial water storage has shown a declining trend since 2014 to 2016 (WMO, Sep 2026).
- Glaciers lost 1,400 gigatonnes of mass between 2023 and 2025, roughly one third of annual freshwater withdrawals (WMO, Sep 2026).
- Asia and Africa had more than 80% of the reported deaths from water-related extreme events over the past five years (WMO, Sep 2026).
- Around 46% of countries saw minimum river flows shrink between 2019 and 2023, and over one fifth reported reductions above 10% (UN SDG Report 2026, Jul 2026).
What about drought in the US and Europe?
- 45.0% of the 50 states and Puerto Rico were in drought in mid-October 2026 (NIDIS, Drought.gov, Oct 2026).
- EU water abstraction fell 14% between 2000 and 2023, yet there was no overall reduction in the area affected by water scarcity (European Environment Agency, Nov 2025).
- The 10% most water-stressed basins account for 35% of global irrigated calorie production (IPCC AR6 Working Group II, Chapter 4, Feb 2022).
How Much Water Do Power Plants and Data Centers Use?
Energy and water are one system. Power plants need water, and water systems need power, and the newest big user is computing.
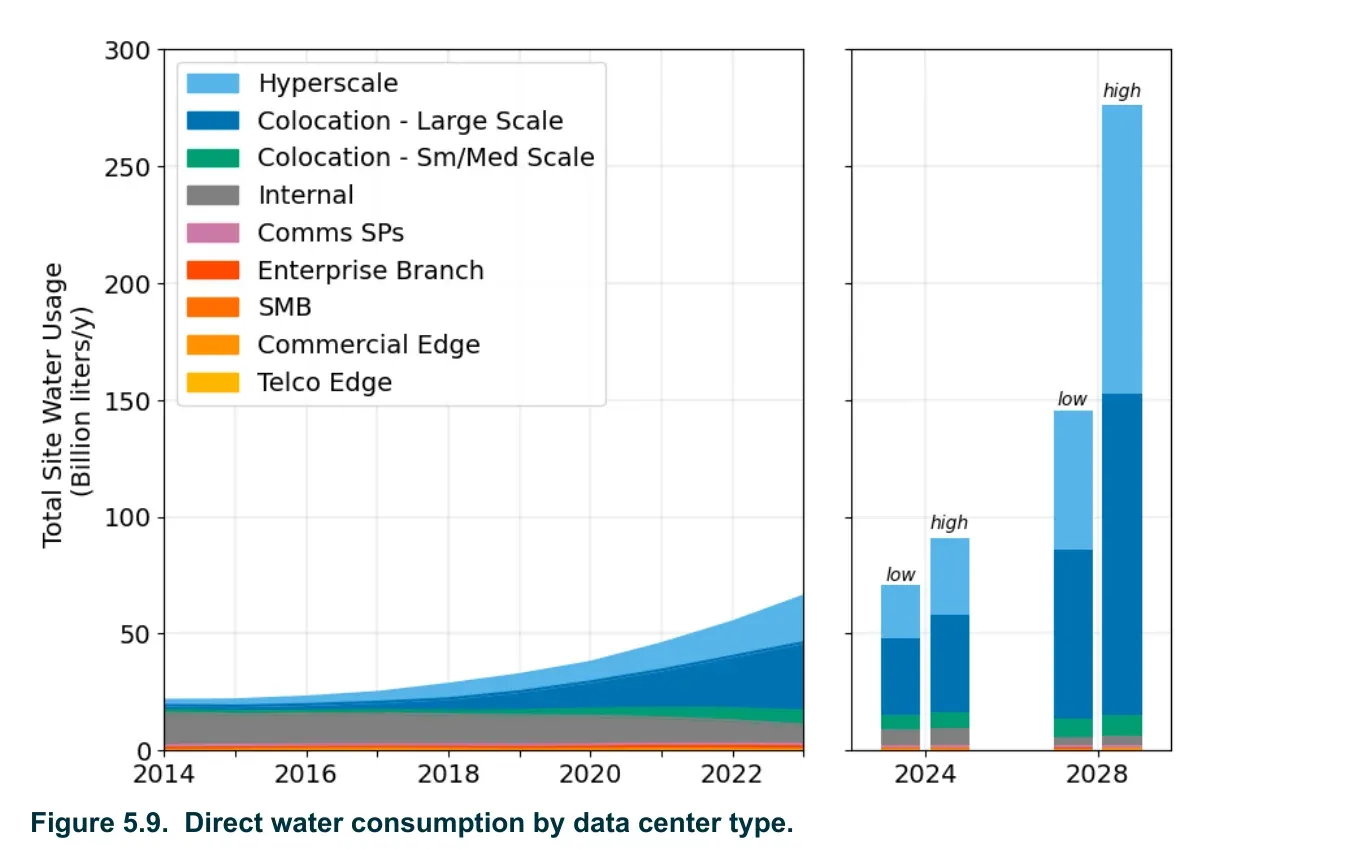 Figure 9: Direct water use by US data centers has roughly tripled since 2014, and most of the growth sits in hyperscale and large colocation sites, with the 2028 scenarios rising much further. Source: Lawrence Berkeley National Laboratory, 2024 United States Data Center Energy Usage Report, Dec 2024. Screenshot of Figure 5.9 in the source report, captured 21 Oct 2026.
How much water does the energy sector take?
- The energy sector is responsible for 10% of global water withdrawals, mainly for power plant operation and for producing fossil fuels and biofuels (IEA, Mar 2017).
- Energy-related water consumption is set to increase by nearly 60% between 2014 and 2040 (IEA, Mar 2017).
- In 2014, about 4% of global electricity consumption was used to extract, distribute and treat water and wastewater (IEA, Mar 2017).
- Desalination and water re-use meet less than 1% of global water needs but account for almost a quarter of the water sector’s energy use (IEA, Mar 2017).
- 32% of the world’s coal-fired power plants experience water scarcity for at least five months a year (IPCC AR6 Working Group II, Chapter 4, Feb 2022).
- 27% of US thermoelectric production may be at severe risk of low-capacity utilization due to water stress by 2030 (IPCC AR6 Working Group II, Chapter 4, Feb 2022).
- Only 3.9% of the water US thermoelectric plants withdrew in 2020 was consumed, and the plants also withdrew about 18,740 million gallons a day of saline water (USGS Thermoelectric Power Water Use, Sep 2026).
How much water do US data centers use?
- By 2023, hyperscale and colocation data centers accounted for 84% of the 66-billion-liter direct total, while internal data centers fell to 12% (Lawrence Berkeley National Laboratory, Dec 2024).
- Hyperscale data centers are expected to consume between 60 and 124 billion liters directly in 2028 (Lawrence Berkeley National Laboratory, Dec 2024).
- The indirect water footprint of US data centers, from the electricity they use, was nearly 800 billion liters in 2023 (Lawrence Berkeley National Laboratory, Dec 2024).
- The national average indirect water consumption was 4.52 liters per kilowatt-hour of data center energy in 2023 (Lawrence Berkeley National Laboratory, Dec 2024).
- After 2023, the average water usage effectiveness of data centers rises slightly to between 0.45 and 0.48 liters per kilowatt-hour (Lawrence Berkeley National Laboratory, Dec 2024).
How Efficiently Is Water Used, Reused and Lost?
Efficiency is improving, mostly because economies are growing faster than water use, not because people take less. The biggest lever is still the farm.
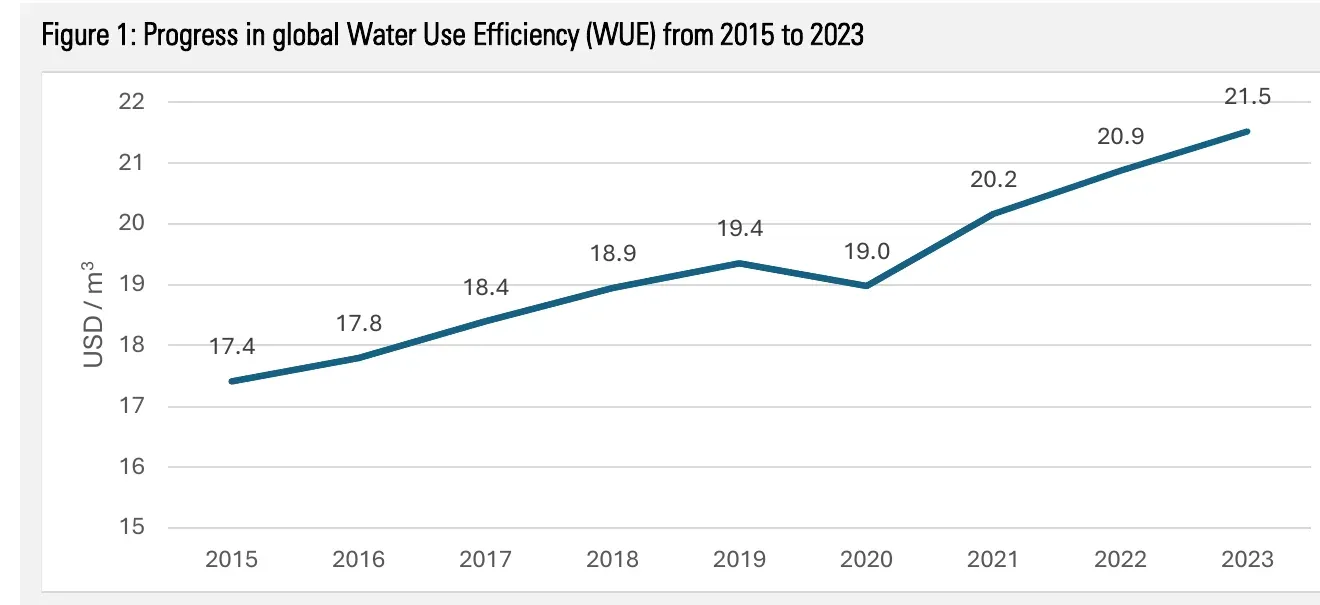 Figure 10: Global water-use efficiency climbed in most years from 2015 to 2023, with one dip in 2020, because output grew while withdrawals barely moved. Source: UN, SDG Extended Report 2026, Goal 6, Jul 2026. Screenshot of Figure 1 in the source report (FAO data), captured 21 Oct 2026.
Is water use getting more efficient?
- Agriculture’s efficiency rose 39% from $0.5 to $0.7 of output per cubic meter between 2015 and 2023 (UN SDG Extended Report 2026, Jul 2026).
- Industry’s efficiency rose 33% from $28.6 to $38.0 and services rose 10% from $104.9 to $115.5 (UN SDG Extended Report 2026, Jul 2026).
- 54% of countries still operate below $20 of output per cubic meter (UN SDG Extended Report 2026, Jul 2026).
- Sprinkler and microirrigation systems irrigated 63% of US irrigated land in 2015 (USGS Circular 1441, Jun 2018).
How much wastewater is treated or reused?
- Households generated an estimated 332 billion cubic meters of wastewater in 2024, and only 185 billion was safely treated (UN SDG Extended Report 2026, Jul 2026).
- About 8% of today’s total freshwater withdrawals can be reclaimed from wastewater every year (Global Commission on the Economics of Water, Oct 2024).
- The volume of treated urban wastewater used for irrigation is estimated at 5 cubic kilometers a year (FAO SOLAW 2021, May 2022).
- About 10% of the world’s irrigated land receives untreated or partially treated wastewater, more than 30 million hectares in 50 countries (FAO SOLAW 2021, May 2022).
- Non-conventional sources, such as reclaimed wastewater and desalinated water, supply only 0.12% of consumptive irrigation use (FAO SOLAW 2021, May 2022).
How much is lost, desalinated or subsidized?
- Roughly 40% of urban water is lost through leakage, for example from ageing pipelines (Global Commission on the Economics of Water, Oct 2024).
- Global desalination operating capacity was estimated at 28.6 cubic kilometers a year in 2021 (FAO SOLAW 2021, May 2022).
- Installed desalination capacity grew about 7% a year from 2010 to the end of 2019 (FAO SOLAW 2021, May 2022).
- By 2040, desalination and re-use would supply 4% of water but use 60% of the water sector’s energy (IEA, Mar 2017).
- Inefficient subsidies in agriculture and in water and sanitation are estimated at no less than $700 billion a year (Global Commission on the Economics of Water, Oct 2024).
Methodology and Sources
Every number on this page comes from the agency, regulator or research body that produced it, and each link goes to the original report, release or data page. No statistics roundups are cited. Withdrawals, consumptive use, water stress and efficiency are measured in different ways by different bodies, so totals differ by source, year and definition; where two figures cover the same thing, both are named with their own source and year. Some FAO and World Bank figures come from the same AQUASTAT data. The page is refreshed monthly. Updated October 2026.
Glossary
- Withdrawal: water taken from a river, lake, aquifer or other source for use.
- Consumptive use: the part of a withdrawal that does not return to a river or aquifer, because it evaporates, goes into crops or products, or is drunk.
- Water stress: the share of available freshwater supply that is withdrawn each year (SDG indicator 6.4.2).
- Renewable freshwater resources: water that rain and snow refill each year as runoff and groundwater recharge.
- Green, blue and grey water: rain stored in soil and used by plants; water taken from rivers, lakes and aquifers; and the water needed to dilute pollution.
- Water-use efficiency: dollars of economic output per cubic meter of water withdrawn (SDG indicator 6.4.1).
- Water usage effectiveness: liters of water used per kilowatt-hour of data center equipment energy.
- Hyperscale: very large data centers run by the biggest cloud companies.
- Thermoelectric power: electricity made by steam turbines, which use water for steam and cooling.
- Km³: cubic kilometer, one trillion liters.
- Bgal/d and mgd: billion gallons a day and million gallons a day.
- FAO, AQUASTAT: the UN Food and Agriculture Organization and its global water and agriculture database.
- SOLAW: FAO’s State of the World’s Land and Water Resources report.
- WDI: the World Bank’s World Development Indicators database.
- SDG: United Nations Sustainable Development Goal; Goal 6 covers clean water and sanitation.
- WRI: World Resources Institute.
- WMO: World Meteorological Organization.
- IPCC: Intergovernmental Panel on Climate Change.
- IEA: International Energy Agency.
- USGS: US Geological Survey.
- NIDIS: National Integrated Drought Information System.
- JMP: the WHO/UNICEF Joint Monitoring Programme for water supply, sanitation and hygiene.
- ODA: official development assistance.
Sources
- World Bank WDI, Oct 2026
- FAO AQUASTAT, Oct 2026
- UN SDG Extended Report 2026, Jul 2026
- USGS Circular 1441, Jun 2018
- USGS Irrigation Water Use, Aug 2026
- Nature, Jasechko et al., Jan 2024
- WRI, Aug 2023
- UN SDG Report 2026, Jul 2026
- WMO, Sep 2026
- Lawrence Berkeley National Laboratory, Dec 2024
- FAO SOLAW 2021, May 2022
- IEA, Mar 2017
- IPCC AR6 Working Group II, Chapter 4, Feb 2022
- World Bank WDI, Oct 2026
- Eurostat, Jul 2026
- World Bank WDI, Oct 2026
- World Bank WDI, Oct 2026
- World Bank WDI, Oct 2026
- Mekonnen and Hoekstra, Hydrology and Earth System Sciences, May 2011
- USGS Water Use in the United States, Sep 2026
- USGS Thermoelectric Power Water Use, Sep 2026
- USGS Public Supply Water Use, Sep 2026
- USGS Domestic Self-Supplied Water Use, Oct 2026
- USDA ERS, Jan 2026
- European Environment Agency, Nov 2025
- UNICEF, Reimagining WASH: Water Security for All, Mar 2021
- Global Commission on the Economics of Water, Oct 2024
- World Bank, Oct 2026
- WHO/UNICEF JMP, Aug 2025
- WRI Aqueduct 4.0 technical note, Aug 2023
- World Bank, High and Dry, May 2016
- NIDIS, Drought.gov, Oct 2026
- IEA, Mar 2017