Septic system statistics start with one fact that surprises most people: about one in five US homes treats its own wastewater, and no agency keeps a national list of those systems. The best count comes from a Census housing survey. Everything else is pieced together from state programs, federal reports and field studies.
This page uses only the people who produced the numbers: the Census Bureau, EPA, state agencies, the US Geological Survey, the Bureau of Labor Statistics and peer-reviewed journals. Where two sources disagree, both are shown with their dates. Where a figure is our own arithmetic on a public Census file, the text says so.
If you run a plumbing shop, a septic job is a call about a slow drain, a gurgling toilet or a wet patch in the yard. These figures show how many homes are in that position, how often systems fail, what a repair costs and what rules the work falls under. For trade-wide wages and licensing, see plumbing statistics and the overview in plumbing industry statistics.
Key Takeaways
- 24.6 million occupied US homes, out of 133.2 million, were on a septic tank or cesspool in 2023. (Census Bureau, Jan 2025)
- In the 1990 census, 55.0% of Vermont homes were on septic, against 9.8% in California. (Census Bureau, Apr 1990)
- Florida has an estimated 2.6 million septic systems, about 12% of all systems in the country. (Florida DEP, Oct 2026)
- Minnesota local programs estimate that 87,745 systems fail to protect groundwater and 23,500 pose an imminent threat to public health. (Minnesota Pollution Control Agency, May 2025)
- Massachusetts reports a 20% failure rate from inspections done before each home sale. (EPA, Feb 2002)
- Owners reported 548,000 septic tank add or replace projects in the two years before the 2023 survey, with a median cost of $5,000. (Census Bureau, Jan 2025)
- Nitrogen-removing septic systems on Long Island cost about $20,000 to $30,000, and grants can cover up to $45,000. (Peconic Estuary Partnership, Oct 2026)
- EPA counts $74.7 billion in 20-year needs for decentralized wastewater systems, up 172% since 2012. (EPA, Apr 2024)
- The 2022 Economic Census counted 3,821 septic tank and related services firms with $6.3 billion in revenue. (Census Bureau, Dec 2024)
- 2,385 of the 4,054 septic tank service establishments in 2023 had fewer than five employees. (Census Bureau, Jun 2025)
- Hawaii has about 88,000 cesspools that release about 53 million gallons of untreated sewage into the ground each day. (Hawaii Department of Health, Oct 2026)
- EPA says a household septic tank should be inspected at least every three years and is typically pumped every three to five years. (EPA, Aug 2026)
- The US had 30,650 septic tank servicers and sewer pipe cleaners in May 2025, with median pay of $49,880 a year. (Bureau of Labor Statistics, May 2025)
Septic Tank Statistics: How Many US Homes Use One?
The installed base is large, spread thin and badly counted. The federal agency in charge of the topic says it has no database of its own, so the national picture rests on one Census survey.
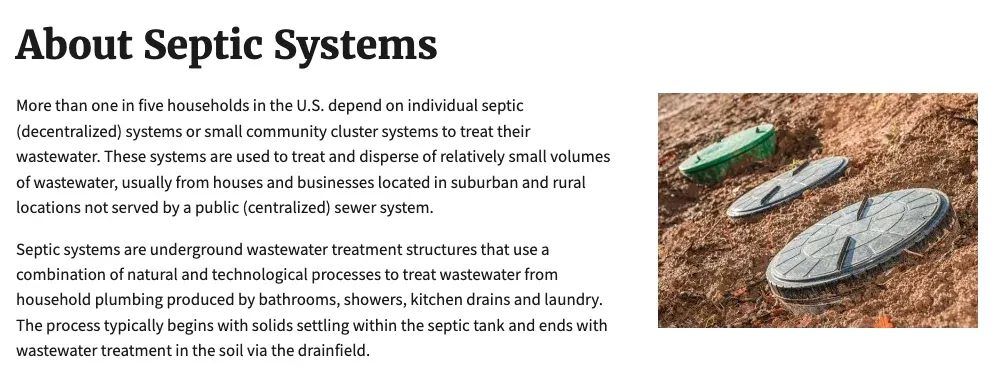 Figure 1: EPA’s own overview page opens with the headline number, that more than one in five households relies on a septic or small cluster system rather than a public sewer. Source: EPA, About Septic Systems, Jul 2026. Screenshot of the source page, captured 21 Oct 2026.
What share of US households have a septic system?
About one in five. EPA put the share at about 18% of households using the 2017 American Housing Survey (EPA, Jul 2021).
- EPA’s overview page says more than one in five US households depend on individual septic systems or small community cluster systems (EPA, Jul 2026).
- The 2015 American Housing Survey put the share at 19.9% of households, before the 2017 survey brought it down again (EPA, Jul 2021).
- Census data from 1999 gave about 23% of an estimated 115 million occupied homes, and more than 60 million people (EPA, Feb 2002).
- The 1970 census counted 16.6 million homes on a septic tank or cesspool, 24.5% of all housing units (Census Bureau, Apr 1970).
- The 1980 census counted 20.9 million, or 24.1% (Census Bureau, Apr 1980).
- The 1990 census, the last year in the Census Bureau’s historical sewage disposal series, counted 24.7 million homes, again 24.1% (Census Bureau, Apr 1990).
- Of the homes on septic in 2023, 23.3 million have a standard tank with a subsurface leach field and 784 thousand use a pump to distribute the wastewater (Census Bureau, Jan 2025).
- About 759 thousand homes are on a system that serves 2 to 5 units, and 347 thousand are on one that serves 6 or more (Census Bureau, Jan 2025).
Why is the national count so hard to pin down?
Because septic systems are permitted by local health offices, and each office keeps its own records.
- EPA says it has no database of septic systems across the US because they are regulated at the state and local level (EPA, Mar 2026).
- The 2017 survey put the national figure at 17.8% of households, while Vermont estimates that 55 percent of its residents rely on decentralized systems (EPA, Jul 2021).
- More than half of new single-family homes in Michigan are built with a septic system, yet the state has no central system to track them (EPA, Jul 2021).
- Pennsylvania issues permits through local sewage enforcement officers, and its environmental agency has no comprehensive database of them (EPA, Jul 2021).
- Each of Washington State’s 39 county governments has its own method of managing septic system data (EPA, Jul 2021).
Who has a septic system?
Owners of detached homes on large lots, and often homes with their own well.
- In the 2023 survey, 24.8% of owner households were on septic, against 5.4% of renter households (our calculation from the Census Bureau, Jan 2025).
- 48.1% of mobile homes and 24.1% of detached one-family houses were on septic, against under 1% of apartments in buildings of 3 or more units (our calculation from the Census Bureau, Jan 2025).
- 67.9% of homes on lots of 1 up to 5 acres were on septic, against 2.6% of homes on lots under one eighth of an acre (our calculation from the Census Bureau, Jan 2025).
- About half of homes on septic (49.4%) get water from their own well, and 87.7% of homes on an individual well use septic (our calculation from the Census Bureau, Jan 2025).
- More than 43 million people, about 15 percent of the US population, rely on domestic wells for drinking water (US Geological Survey, Nov 2009).
- Of 1,005 thousand single-family houses completed in 2025, 160 thousand (16%) had an individual septic system (Census Bureau, Jul 2026).
- Among new houses, 51% of contractor-built ones had septic, against 9% of houses built for sale (Census Bureau, Jul 2026).
- The septic share of new homes ran from 26% in the Northeast to 7% in the West in 2025 (Census Bureau, Jul 2026).
- About 52 percent of households on decentralized systems earn $61,000 or less, which is 9.5 percent of all US households (EPA, Jul 2021).
Which States Rely Most on Septic Tanks?
The Northeast and the Southeast lean on septic far more than the West. The most recent state-by-state Census count is more than 30 years old, so state agency figures fill in the rest.
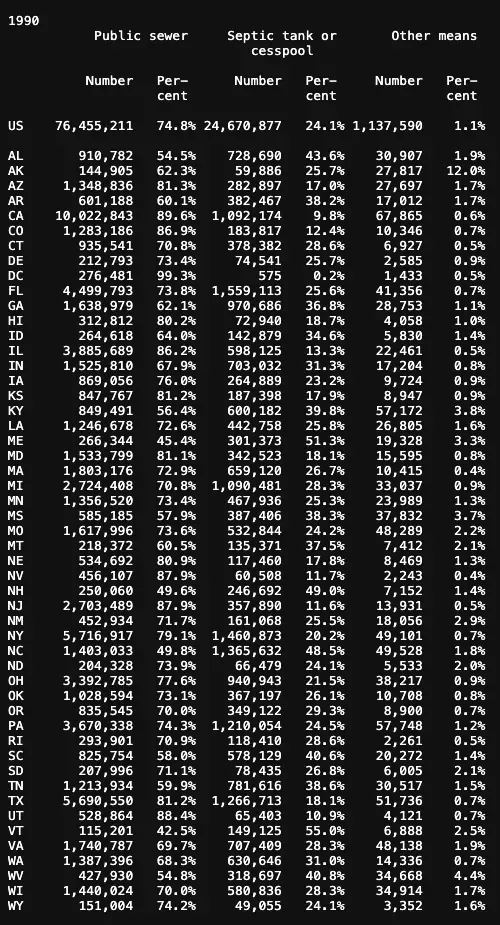 Figure 2: The 1990 census table shows how wide the gap between states was, from about half of homes on septic in Vermont and Maine to under one in ten in California. Source: Census Bureau, Historical Census of Housing Tables: Sewage Disposal, Apr 1990. Screenshot of the source page, captured 21 Oct 2026.
Which states have the highest share of homes on septic?
Vermont, Maine, New Hampshire and North Carolina, where about half of all homes were on septic in the last census to ask.
- Maine had 51.3% of homes on septic, New Hampshire 49.0% and North Carolina 48.5% (Census Bureau, Apr 1990).
- West Virginia had 40.8%, South Carolina 40.6% and Kentucky 39.8% (Census Bureau, Apr 1990).
- After California, the lowest shares were Utah at 10.9%, New Jersey at 11.6% and Nevada at 11.7% (Census Bureau, Apr 1990).
- Florida counted 1,559,113 homes on septic, the most of any state, followed by New York at 1,460,873 and North Carolina at 1,365,632 (Census Bureau, Apr 1990).
- Approximately 50 percent of homes in the New England states and the Carolinas rely on onsite systems (EPA, Dec 2024).
- In the 2023 survey, 36.8% of homes in the East South Central division and 30.1% in New England were on septic, against 9.8% in the Pacific division and 12.4% in the Mountain division (our calculation from the Census Bureau, Jan 2025).
- Roughly 40 percent of homes in Puerto Rico are on septic, and most of those systems are substandard or failing (EPA, Jul 2021).
How many systems do states and counties report?
State programs give the firmest counts, but they use different definitions.
- Florida’s systems serve about 30% of the state’s population, and groundwater provides 90% of its drinking water (Florida DEP, Oct 2026).
- Minnesota’s local programs report 648,641 systems, and St. Louis County alone has 40,627 (Minnesota Pollution Control Agency, May 2025).
- Maryland has 420,000 onsite systems (Maryland Department of the Environment, Jun 2025).
- Miami-Dade County has over 112,000 septic systems, some at risk from a rising water table (Ground Water, Aug 2024).
- In Delaware, about 80 percent of households in Kent County and 70 percent in Sussex County were on septic, against 23 percent in New Castle County (EPA, Jul 2021).
- 74% of Suffolk County, New York residents rely on cesspools and septic systems (Suffolk County Department of Health Services, Oct 2024).
- More than 85 percent of the wastewater in Nags Head, North Carolina is treated by onsite systems (EPA, Dec 2024).
- Texas issued 43,165 septic permits in 2025, down from 54,593 in 2022 (Texas Commission on Environmental Quality, Oct 2026).
How Old Are Septic Tanks and How Often Do They Fail?
Many systems are old, and failure is common but badly measured. Every national estimate rests on a few state surveys and on what homeowners report. A backup into the house can also come from wipes and grease in the line, which is covered in wet wipes and sewer blockage statistics.
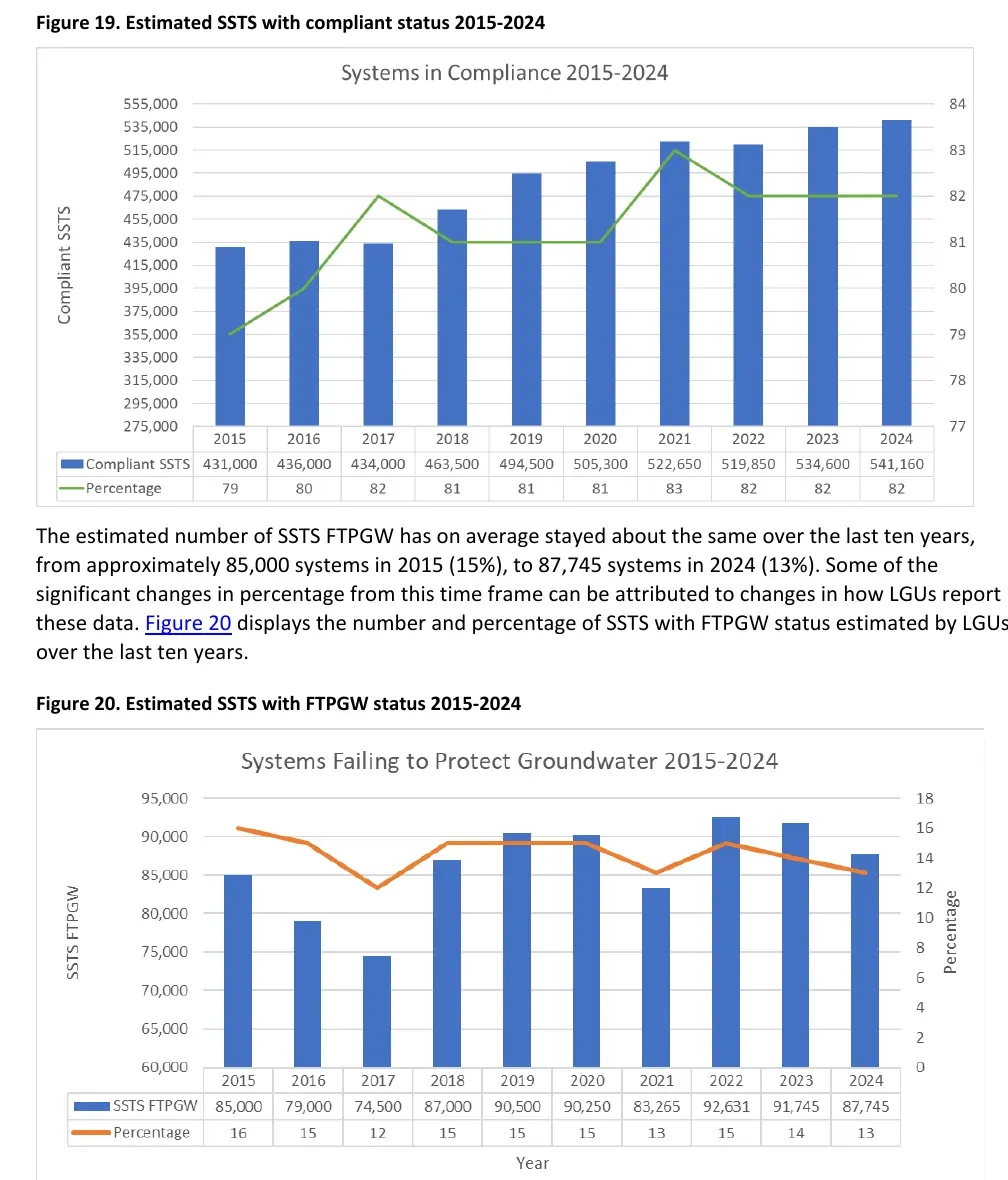 Figure 3: Minnesota is one of the few states that counts compliance every year, and its local officials rate about four in five systems as compliant while roughly one in seven fails to protect groundwater. Source: Minnesota Pollution Control Agency, 2024 SSTS Annual Report, May 2025. Chart published by the source, captured 21 Oct 2026.
How old are most septic systems?
About half are more than 30 years old, which is past the point where drainfields start to struggle.
- About half of occupied homes with onsite treatment systems are more than 30 years old (EPA, Feb 2002).
- A concrete tank may last 50 years or more, but a pump or control usually needs replacing every 10 to 20 years (EPA, Mar 2026).
- Once a drainfield passes 25 to 30 years, the biomat that forms in the trenches can thicken and cause ponding or backups (EPA, Mar 2026).
- The median year built of homes on septic was 1980, against 1970 for homes not on septic (our calculation from the Census Bureau, Jan 2025).
- Over 16% of Minnesota’s systems were built in the last ten years or contain parts that are less than ten years old (Minnesota Pollution Control Agency, May 2025).
- Of the 108,800 Minnesota construction permits issued since 2015, about 55% were for replacement systems and 45% for new ones (Minnesota Pollution Control Agency, May 2025).
What share of septic systems fail?
Studies that EPA reviewed put failure at 10 to 20 percent, and the real figure is probably higher.
- EPA’s 2002 manual cites failure rates of 10 to 20 percent, and says surveys miss systems that quietly contaminate groundwater (EPA, Feb 2002).
- A 1997 Census survey estimated that 403,000 homes had a septic system breakdown within three months, and 31,000 reported four or more at the same home (EPA, Feb 2002).
- Surveys indicate that at least 10 percent of older systems back up onto the ground or into the home each year (EPA, Mar 2003).
- Other data show that at least 20 percent of systems are malfunctioning to some degree (EPA, Mar 2003).
- In the 2023 survey, 396 thousand homes on septic reported a breakdown in the previous three months, against 1.26 million homes on public sewer (Census Bureau, Jan 2025).
- A Hawaii inspection survey found about 68% of onsite systems in good working condition and the other 32% failing or in danger of failing (Water Science and Technology, Sep 2014).
- In the same Hawaii survey, about 70% of effluent samples had total nitrogen and total phosphorus above typical values (Water Science and Technology, Sep 2014).
Is the failure rate improving?
In Minnesota it is, slowly, because the state counts and enforces.
- Minnesota’s estimated compliant systems rose from about 431,000 in 2015 to 541,160 in 2024, or from 79% to 82% of the total (Minnesota Pollution Control Agency, May 2025).
- The state requires a system identified as an imminent threat to be upgraded, replaced, repaired or discontinued within ten months of the notice (Minnesota Pollution Control Agency, May 2025).
- Local programs ran 12,810 compliance inspections of existing systems in 2024, a 9% drop from 14,111 in 2023 (Minnesota Pollution Control Agency, May 2025).
- Of 1,446 noncompliant properties resolved in 2024 without a new system, 934 connected to a sewer and 501 were abandoned or removed (Minnesota Pollution Control Agency, May 2025).
Does flooding and sea level rise make failures worse?
Yes, because a system needs dry soil below the drainfield to treat wastewater. For wider flood data, see flood statistics.
- Water tables can rise by 31 to 35 percent of the rate of sea level rise, which cuts the separation between groundwater and the drainfield (EPA, Dec 2024).
- Over 80% of water table readings in North Fort Myers, Florida were too shallow, under 1.07 metres, for septic systems to work properly (Science of the Total Environment, Sep 2022).
- In Maryland’s Chesapeake Bay region, the number of septic systems exposed to coastal flooding more than doubles by 2060 (Climatic Change, Apr 2026).
- Dorchester County, Maryland would have more than 1,700 septic systems exposed to flooding by 2060 (Climatic Change, Apr 2026).
How Often Should a Septic Tank Be Pumped?
Every three to five years is EPA’s rule of thumb, and few programs check that owners follow it. The numbers below show the triggers, the exceptions and who keeps records.
 Figure 4: EPA’s care page sets the baseline schedule for inspection and pumping and lists the four factors that move it up or down. Source: EPA, How to Care for Your Septic System, Aug 2026. Screenshot of the source page, captured 21 Oct 2026.
How do you know when a tank needs pumping?
By the layers inside the tank, not by the calendar alone.
- A tank needs pumping if the bottom of the scum layer is within six inches of the bottom of the outlet, if the top of the sludge is within 12 inches of the outlet, or if more than 25 percent of the liquid depth is sludge and scum (EPA, Aug 2026).
- A rule of thumb is to pump when solids fill two-thirds of the tank volume (EPA, Mar 2026).
- Alternative systems with float switches, pumps or mechanical parts are generally inspected once a year (EPA, Aug 2026).
- Massachusetts advises pumping every 3 years, and every year for homes with a garbage disposal (Massachusetts Department of Environmental Protection, Jun 2025).
- The Chesapeake Bay Program gives a 5 percent nitrogen reduction credit for pumping out a septic tank (Chesapeake Bay Program, Feb 2014).
Who tracks maintenance?
Few places do, which is why so many owners cannot say when their tank was last serviced.
- In Hawaii, 80% of homeowners interviewed said their onsite system was not serviced in any way (Water Science and Technology, Sep 2014).
- Only 42% of Minnesota’s 191 local septic programs track system maintenance (Minnesota Pollution Control Agency, May 2025).
- Suffolk County requires a nitrogen-removing system to be maintained at least once a year by a licensed service provider (Suffolk County Department of Health Services, Oct 2024).
- Maintenance on those systems is expected to cost about $300 a year once the three-year warranty ends (Peconic Estuary Partnership, Oct 2026).
- Approved nitrogen-removing systems use $74 to $228 of electricity a year (Suffolk County Department of Health Services, Oct 2024).
- Suffolk will reimburse homeowners in the Peconic Estuary area up to $500 a year for renewing a maintenance contract on a nitrogen-removing system (Peconic Estuary Partnership, Oct 2026).
Pump-out intervals of three to five years are easy to lose across a customer list. Tank size, sludge depth and last service date are the records that keep a maintenance plan honest.
How much water does a household send to the tank?
More than most owners think, and water use is the lever they control. Household use and leak data are in water usage statistics and water leak statistics.
- Average indoor water use in a typical single-family home is nearly 70 gallons per person per day (EPA, Sep 2012).
- A single leaky toilet can waste as much as 200 gallons of water per day (EPA, Sep 2012).
- Toilets account for 25 to 30 percent of household water use (EPA, Aug 2026).
- Minnesota estimates its systems treat 44.4 billion gallons a year, assuming 2.5 people per permit and 75 gallons per person per day (Minnesota Pollution Control Agency, May 2025).
What Does a Septic Repair or Replacement Cost?
The honest answer is a wide range, set by soil, lot size and local rules. Census data shows the typical job is a few thousand dollars, and the advanced systems required near water cost several times that.
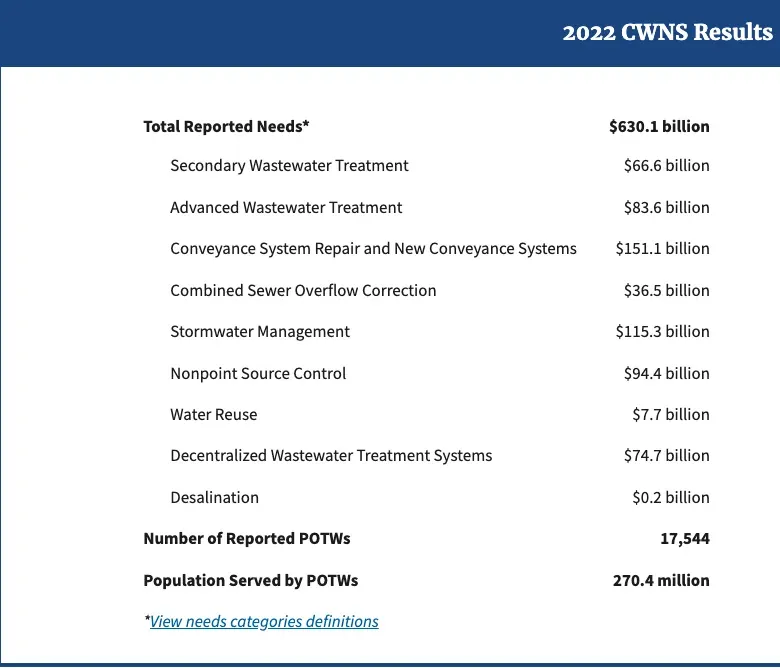 Figure 5: EPA’s survey of 20-year wastewater needs lists decentralized systems as the fifth largest of nine categories, behind conveyance, stormwater, nonpoint source control and advanced treatment. Source: EPA, 2022 Clean Watersheds Needs Survey, Apr 2024. Screenshot of the source page, captured 21 Oct 2026.
How much do homeowners spend on septic tank projects?
The average is higher than the median because a minority of jobs run to five figures.
- The mean cost of an owner’s septic tank project was $7,924, with a 90% margin of error of $1,544 (Census Bureau, Jan 2025).
- Total owner spending on septic tank projects in the two-year window was about $3.9 billion (Census Bureau, Jan 2025).
- 86% of septic tank projects were done by a hired contractor rather than the owner (our calculation from the Census Bureau, Jan 2025).
- About one in four septic tank projects with a reported cost ran $10,000 or more (our calculation from the Census Bureau, Jan 2025).
- 71% of septic tank projects were paid for with cash from savings (our calculation from the Census Bureau, Jan 2025).
- The 2023 septic figures come from a small sample of 149 projects, so treat the dollar values as ranges, not point prices (our count from the Census Bureau, Jan 2025).
What do advanced systems add?
Near water, a nitrogen-removing system is often required, and it changes the quote.
- On Long Island the nitrogen-removing system price excludes engineering and design, which are billed on top (Peconic Estuary Partnership, Oct 2026).
- Low-to-moderate-income Suffolk homeowners can get an additional $5,000 grant on top of the base grants (Suffolk County Department of Health Services, Oct 2024).
- Suffolk says homeowners may have to replace a pump or blower on these systems after about 10 years, but not dig up the whole system (Suffolk County Department of Health Services, Oct 2024).
- Massachusetts allows up to 2 years to complete repairs after a failed inspection (Massachusetts Department of Environmental Protection, Jun 2025).
- Massachusetts law provides a septic repair tax credit of up to $6,000 per homeowner (Massachusetts Department of Environmental Protection, Jun 2025).
What help is there paying for it?
Federal loans and grants exist but are narrow, and many owners pay cash.
- USDA’s Section 504 repair program offers loans up to $40,000 and grants up to $10,000 for eligible rural homeowners, for up to $50,000 combined (USDA Rural Development, May 2025).
- Those loans carry a fixed 1% rate and a 20-year term (USDA Rural Development, May 2025).
- The USDA decentralized water systems grant funds nonprofit revolving loans of up to $15,000 per household for wells and septic systems (USDA Rural Development, Jun 2025).
- A regional nonprofit lends up to $15,000 at 1 percent to rural residents for a new septic system (EPA, Jun 2026).
- Of the $145.4 billion in Clean Water State Revolving Fund assistance given since 1988, 93 percent of projects involved centralized wastewater treatment (EPA, Jul 2021).
- Maryland collects a $60 annual fee from each septic user, about $27 million a year, and 60 percent funds septic upgrades (Maryland Department of the Environment, Jun 2025).
- Reported decentralized wastewater needs rose as the number of reporting states went from 27 in 2012 to 43 in 2022 (EPA, Apr 2024).
- Florida, Texas, New York, Georgia and North Carolina report the highest decentralized needs (EPA, Apr 2024).
Who Installs and Services Septic Tanks?
A few thousand firms, most of them small. For a plumbing shop owner this is the trade next door: the one that digs, pumps and certifies.
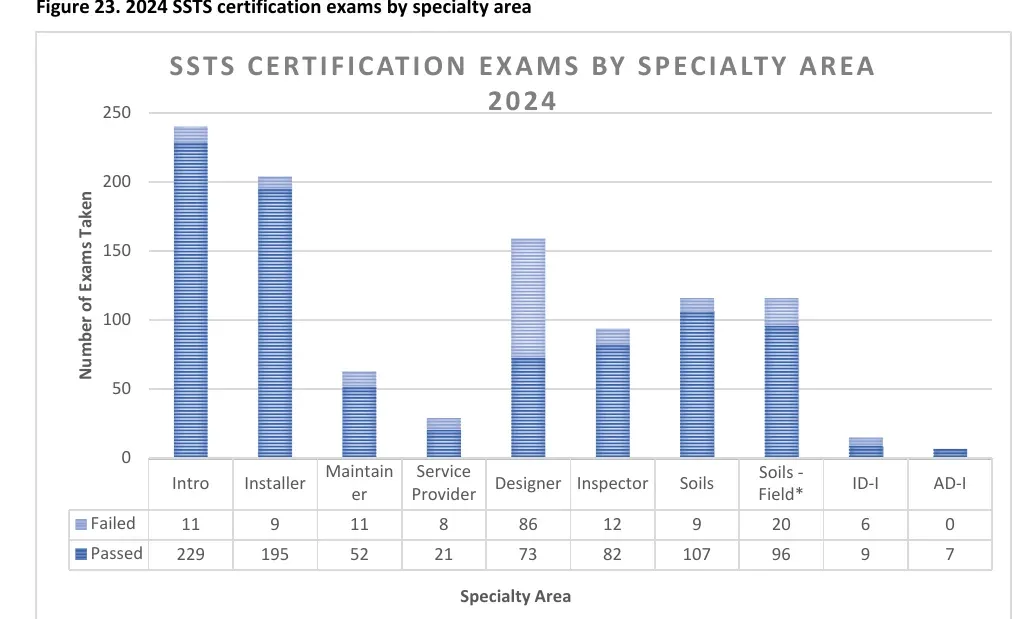 Figure 6: Minnesota’s 2024 certification results show where the entry barrier sits, with 86 of 159 designer exams failed against 9 of 204 installer exams. Source: Minnesota Pollution Control Agency, 2024 SSTS Annual Report, May 2025. Chart published by the source, captured 21 Oct 2026.
How big is the septic services industry?
Large enough to employ tens of thousands, and made of small firms.
- The 2022 Economic Census counted 3,991 establishments, 37,308 employees and $1.78 billion in annual payroll (Census Bureau, Dec 2024).
- County Business Patterns counted 4,054 establishments and 32,666 employees in March 2023 (Census Bureau, Jun 2025).
- Annual payroll in those establishments was $2.0 billion in 2023 (Census Bureau, Jun 2025).
- 865 establishments had 5 to 9 employees, 457 had 10 to 19 and 256 had 20 to 49 (Census Bureau, Jun 2025).
- Only 91 establishments had 50 or more employees (Census Bureau, Jun 2025).
- Texas had the most septic services establishments with 343, followed by California with 282, Florida with 240 and New York with 194 (Census Bureau, Jun 2025).
What do septic workers earn?
About $50,000 a year at the median, and EPA finds the skilled-trades jobs in this sector pay less than regulator and professional roles.
- The median hourly wage for septic tank servicers and sewer pipe cleaners was $23.98 and the mean annual wage was $53,500 (Bureau of Labor Statistics, May 2025).
- EPA found an average median hourly wage of $21.67 for skilled-trades jobs in decentralized wastewater, and an average annual salary of $45,000 (EPA, Feb 2021).
- EPA found average median hourly wages of $30.52 for regulators, $41.49 for private-sector professionals and $40.17 for university roles in the sector (EPA, Feb 2021).
- EPA says many stakeholders fear shortages of skilled workers in decentralized wastewater, worsened by an expected wave of retirements (EPA, Feb 2021).
How is the work licensed and permitted?
By states, and in some states by local programs as well.
- Minnesota made certification and licensing mandatory for septic professionals in 1994 (Minnesota Pollution Control Agency, May 2025).
- Since then, just under 1,300 business licenses and just under 3,500 individual certifications have been awarded in Minnesota (Minnesota Pollution Control Agency, May 2025).
- Minnesota local programs issued 10,551 construction permits in 2024 (Minnesota Pollution Control Agency, May 2025).
- Minnesota installers pay a $25 fee for each tank installed, and 13,315 tanks were installed in 2024 (Minnesota Pollution Control Agency, May 2025).
- In Florida, the state environmental agency issued 7,819 septic permits and ran 7,940 inspections from January to October 2025, in 16 northwest counties and, from July, Marion County (Florida DEP, Nov 2025).
- Florida’s average time to issue a repair permit fell from 7.9 weekdays in January 2025 to 1.5 in October (Florida DEP, Nov 2025).
How Do Septic Tanks Affect Water Quality?
A working system treats wastewater well, but a failing or poorly placed one is a nitrogen and bacteria source. The effect is clearest in coastal areas and in places with wells close to drainfields.
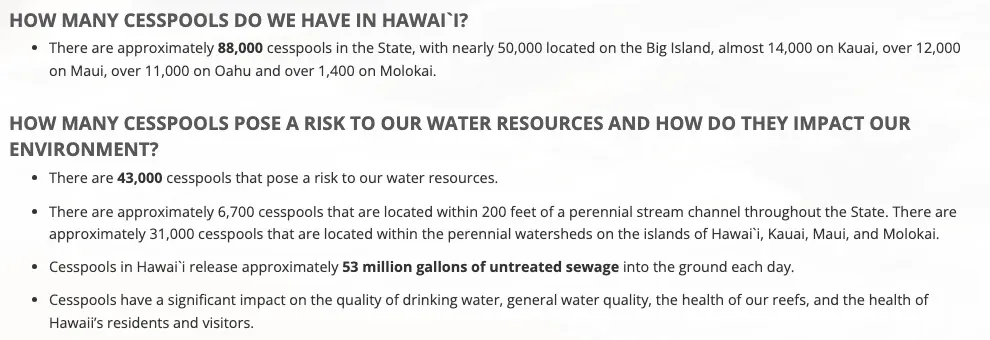 Figure 7: Hawaii’s health department counts cesspools by risk to water, and the numbers show why the state ordered every one replaced. Source: Hawaii Department of Health, Cesspools in Hawaii, Oct 2026. Screenshot of the source page, captured 21 Oct 2026.
How much nitrogen does a septic system release?
Enough to matter when homes sit close together near water.
- A conventional septic tank effluent carries about 5 kg of total nitrogen per person per year, and about 4 kg reaches the edge of the drainfield (Chesapeake Bay Program, Feb 2014).
- The average residential septic system on Long Island discharges approximately 40 pounds of nitrogen per year (Suffolk County Department of Health Services, Oct 2024).
- The Chesapeake Bay Program found that 55 to 85 percent of the nitrogen entering an onsite system can be discharged to ground water (EPA, Feb 2002).
- Conventional systems accounted for 74 percent of the nitrogen entering Buttermilk Bay in Massachusetts in a 1991 study (EPA, Feb 2002).
- Septic systems and cesspools supply about 80% of the controllable reactive nitrogen load to many impaired Cape Cod estuaries (Journal of Environmental Management, Nov 2024).
- The 45,000 septic systems in Sarasota County, Florida contribute four times more nitrogen to Sarasota Bay than the city’s advanced treatment plant (EPA, Mar 2003).
- Nitrogen from cesspools and septic systems is the largest single cause of degraded water quality in the Peconic Estuary (Peconic Estuary Partnership, Oct 2026).
- Virginia requires 50 percent nitrogen removal from alternative systems in the Chesapeake Bay watershed (Chesapeake Bay Program, Feb 2014).
What do field studies find near septic systems?
Wastewater markers show up in canals, estuaries and private wells, and private wells sit outside federal drinking water rules.
- In the central Indian River Lagoon in Florida, septic systems make up more than 50% of wastewater disposal, and nutrients ran higher near them than in natural areas (Marine Pollution Bulletin, Nov 2021).
- In Lee County, Florida, ammonium was high in 55% of surface water samples and fecal bacteria were high in 66% (Science of the Total Environment, Jun 2023).
- A human waste marker was detected in 50% of those Lee County samples (Science of the Total Environment, Jun 2023).
- In southwestern Wisconsin, human fecal microbes were detected in 46% of the 138 private wells tested for pathogens (Water Research, May 2025).
- Sucralose from household wastewater reached up to 32.0 micrograms per litre in groundwater at residential sites on the St. Lucie Estuary (Harmful Algae, Dec 2017).
- Water from domestic wells is not regulated by the Federal Safe Drinking Water Act or, in most cases, by state laws (US Geological Survey, Nov 2009).
- More than one in five (23 percent) domestic wells held at least one contaminant above a human-health benchmark (US Geological Survey, Nov 2009).
- Nitrate is the only mainly man-made contaminant found above a health benchmark in more than 1 percent of domestic wells (US Geological Survey, Nov 2009).
What does EPA say about the risk?
That a properly sited system is safe, and that density and age are the problem. Public supply quality is covered in drinking water statistics.
- More than four billion gallons of wastewater are dispersed below the ground’s surface every day (EPA, Mar 2026).
- Coastal waters are more sensitive to nitrogen from failing septic systems, and freshwater lakes and rivers are more sensitive to phosphorus (EPA, Jun 2026).
- State agencies ranked septic systems the second most frequently cited potential source of groundwater contamination in the 1996 national water quality report (EPA, Mar 2003).
- The 1995 National Shellfish Register listed septic tanks as a pollution source in 32 percent of harvest-limited growing areas (EPA, Mar 2003).
- Hawaii has 43,000 cesspools that pose a risk to water resources and about 6,700 within 200 feet of a perennial stream (Hawaii Department of Health, Oct 2026).
- Florida identified 30 Outstanding Florida Springs in 2016, and its restoration plans require nitrogen-reducing septic systems in some areas (Florida DEP, Sep 2026).
What Rules and Inspections Apply to Septic Tanks?
There is no federal septic code. States and counties write the rules, and the biggest differences are whether a sale triggers an inspection and whether near-water systems must remove nitrogen.
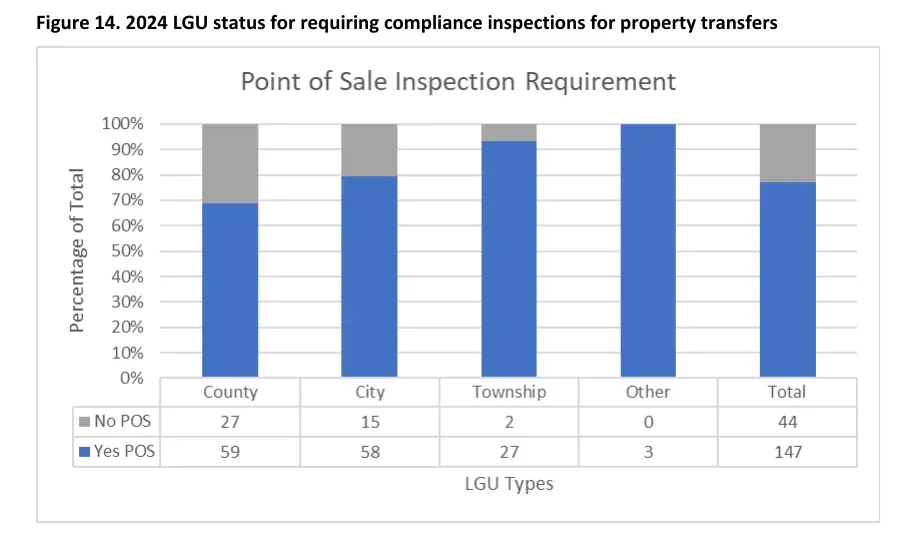 Figure 8: In Minnesota, 147 of 191 local programs require a compliance inspection when a property is sold, even though the state does not mandate it. Source: Minnesota Pollution Control Agency, 2024 SSTS Annual Report, May 2025. Chart published by the source, captured 21 Oct 2026.
Who regulates septic systems?
Local health departments, under state rules, with only voluntary federal guidance.
- In many states, a septic system must be inspected with the transfer of real estate (EPA, Mar 2026).
- EPA’s voluntary national guidelines for onsite systems set out five management models (EPA, Mar 2003).
- EPA’s Decentralized Wastewater Partnership was first signed on January 12, 2005 with eight partner organizations and has been renewed six times (EPA, Sep 2026).
- Of Minnesota’s 191 local septic programs, 98% approve system designs before issuing a construction permit and 99% verify soils (Minnesota Pollution Control Agency, May 2025).
- Florida’s Clean Waterways Act of 2020 moved septic enforcement to the state environmental agency effective July 1, 2021 (Florida DEP, Oct 2026).
- Tennessee fills gaps in its permit records with the 1990 census count (EPA, Jul 2021).
Which states inspect septic systems at sale?
Some by state rule and some by county.
- In Massachusetts, a Title 5 inspection is required when a home with a septic system is put up for sale, a bedroom is added or the use changes (Massachusetts Department of Environmental Protection, Jun 2025).
- Minnesota has no state requirement for transfer inspections, yet 147 of its 191 local programs (77%) have one (Minnesota Pollution Control Agency, May 2025).
- Local programs in Minnesota say a transfer inspection is the most effective way to find noncompliant systems (Minnesota Pollution Control Agency, May 2025).
- Hawaii’s Act 125 of 2017 requires every cesspool in the state to be replaced by 2050 (Hawaii Department of Health, Oct 2026).
- Suffolk County’s Article 19 makes its health department the responsible management entity for nitrogen-removing systems (Suffolk County Department of Health Services, Oct 2024).
- A Section 4107(b) report to Congress found that the lack of current electronic data on decentralized systems is a significant impediment to analysis (EPA, Jul 2021).
Methodology and Sources
Every figure comes from the body that produced it: federal and state agencies, the Census Bureau, the US Geological Survey and peer-reviewed journals. Pages without a visible date carry the month they were read. Several state pages block automated readers, so those were read from an archived copy of the same page and are dated to the copy. Figures marked as our calculation are weighted counts from the public American Housing Survey 2023 file and the Census sewage disposal tables, and they match the Census published totals. The Bureau of Labor Statistics page blocks automated readers, so its wage and employment values were read from the agency’s public data API. Septic is counted differently in each source, so compare numbers only within one source. This page is refreshed monthly.
Sources
- Bureau of Labor Statistics, Occupational Employment and Wage Statistics, Septic Tank Servicers and Sewer Pipe Cleaners (47-4071), May 2025
- Census Bureau, Characteristics of New Housing, Type of Sewage System by Water Supply Source, 2025
- Census Bureau, American Housing Survey 2023, National Public Use File v1.1
- Census Bureau, American Housing Survey 2023, Table Specifications and PUF Estimates
- Census Bureau, County Business Patterns 2023, state file
- Census Bureau, County Business Patterns 2023, national file
- Census Bureau, Historical Census of Housing Tables: Sewage Disposal, 1970
- Census Bureau, Historical Census of Housing Tables: Sewage Disposal, 1980
- Census Bureau, Historical Census of Housing Tables: Sewage Disposal, 1990
- Census Bureau, Economic Census 2022, Sector 56 basic statistics
- Chesapeake Bay Program, Recommendations of the On-Site Wastewater Treatment Systems Nitrogen Reduction Technology Expert Review Panel, final report
- Climatic Change, Estimating the impacts of recurrent and expanding coastal flooding on septic systems in Maryland’s Chesapeake Bay
- EPA, About Septic Systems
- EPA, EPA’s Decentralized Wastewater Partnership
- EPA, Frequent Questions about Septic Systems
- EPA, Funding for Septic Systems
- EPA, How to Care for Your Septic System
- EPA, Septic System Impacts on Water Sources
- EPA, Why Maintain Your Septic System
- EPA, Onsite Wastewater Treatment Systems Manual (EPA/625/R-00/008)
- EPA, Voluntary National Guidelines for Management of Onsite and Clustered (Decentralized) Wastewater Treatment Systems (EPA 832-B-03-001)
- EPA, A Homeowner’s Guide to Septic Systems (EPA-832-B-12-005)
- EPA, Pipeline to a Sustainable Workforce: Decentralized/Onsite Wastewater Occupations (EPA-830-R-21-001)
- EPA, Report to Congress on the Prevalence of Low- and Moderate-Income Households Without Access to a Treatment Works
- EPA, Report to Congress on Alternative Decentralized and Centralized Wastewater Treatment Technology
- EPA, 2022 Clean Watersheds Needs Survey Report to Congress (EPA 832-R-24-002)
- EPA, Safeguarding Against Natural Hazards and Extreme Weather Events: A Resource Guide for Onsite Wastewater Treatment Systems
- Florida DEP, Onsite Sewage Program
- Florida DEP, Program Update: Phase I Transition
- Florida DEP, Springs Protection and Basin Management Action Plans
- Ground Water, Septic Return Flow Pathlines, Endpoints, and Flows Based on the Urban Miami-Dade Groundwater Model
- Harmful Algae, Septic systems contribute to nutrient pollution and harmful algal blooms in the St. Lucie Estuary
- Hawaii Department of Health, Cesspools in Hawaii
- Journal of Environmental Management, Reducing wastewater nitrogen loading by more than 90% with carbon-amended septic systems, Barnstable, Massachusetts
- Marine Pollution Bulletin, Septic systems drive nutrient enrichment of groundwaters and eutrophication in the urbanized Indian River Lagoon, Florida
- Maryland Department of the Environment, Bay Restoration Fund
- Massachusetts Department of Environmental Protection, Consumer Protection Tips: Septic System Inspections and Repairs
- Minnesota Pollution Control Agency, 2024 SSTS Annual Report: Subsurface Sewage Treatment Systems in Minnesota
- Peconic Estuary Partnership, Innovative/Alternative Onsite Wastewater Treatment System Maintenance Grant
- Science of the Total Environment, Septic system-groundwater-surface water couplings in waterfront communities contribute to harmful algal blooms in Southwest Florida
- Science of the Total Environment, Widespread human waste pollution in surface waters observed throughout the urbanized, coastal communities of Lee County, Florida
- Suffolk County Department of Health Services, Septic Improvement Program FAQ
- Texas Commission on Environmental Quality, Permitting Data for OSSF (Septic Systems)
- US Geological Survey, Circular 1332, Quality of Water from Domestic Wells in Principal Aquifers of the United States, 1991 to 2004
- USDA Rural Development, Single Family Housing Repair Loans and Grants
- USDA Rural Development, Rural Decentralized Water Systems Grant Program
- Water Research, Sources and risk factors for nitrate, pathogens, and fecal contamination of private wells in rural southwestern Wisconsin
- Water Science and Technology, Condition assessment survey of onsite sewage disposal systems (OSDSs) in Hawaii
Glossary
- AHS: American Housing Survey, run by the Census Bureau
- Cesspool: a pit that holds household waste and lets it seep into the soil with little or no treatment
- CBP: County Business Patterns, a Census Bureau count of business establishments
- Decentralized wastewater system: a septic system or small cluster system that treats wastewater near where it is produced
- Drainfield: the soil area where treated liquid from a septic tank is released
- I/A OWTS: innovative or alternative onsite wastewater treatment system, usually one that removes nitrogen
- OWTS: onsite wastewater treatment system
- SSTS: subsurface sewage treatment system, the term used in Minnesota