Flood statistics describe the most common disaster in the country and the one homeowners are least likely to be covered for. Most people picture a river overtopping its banks. The data shows something quieter and closer to home: rain that has nowhere to go, basements that fill, sump pumps that stop when the power does, and claims that come from streets nobody mapped as risky.
This page collects primary data on US flooding: how often it happens, what it costs, who it kills, which homes are exposed, how many carry flood insurance, and what a flooded basement means for the pipes, water heaters and pumps inside it. Every number is traced to the agency or research group that produced it, with the date of the data. Where two sources measure the same thing differently, both are shown and labelled. This page is about floods only. Water damage from household causes is covered in water damage statistics and homeowners claims in water damage claims statistics.
Updated October 2026. We refresh the page every month. Figures that come from a count of FEMA public data files are marked in the methodology below.
Key Takeaways
- Flooding caused 45 of the 403 US weather disasters that cost $1 billion or more from 1980 to 2024, with losses of $203.3 billion in 2024 dollars (NOAA NCEI, Jan 2025).
- NOAA has stopped updating its billion-dollar disaster list, so the 1980 to 2024 record is now the last official count of its kind (NOAA NCEI, Oct 2026).
- Floods killed 230 people in 2025, more than in any year since 1972 (NWS, Jul 2026).
- 99% of US counties have had a flood in the past 20 years (FEMA FloodSmart, Oct 2026).
- Floods did $8.8 billion of damage in 2024, and $3.9 billion of it hit communities that are not considered high risk (FEMA FloodSmart, Oct 2026).
- Only 41.0% of the nation’s modeled flood risk sits inside FEMA’s high-risk flood zones (Nature Climate Change, Jan 2022).
- 2.9% of US residential structures hold a National Flood Insurance Program policy, and 47.9% of those in high-risk zones do (OpenFEMA Penetration Rates, Aug 2026).
- From 2020 to 2024, FEMA’s household disaster grants averaged $2,704 while the average flood insurance claim paid $63,691 (FEMA NFIP Media Toolkit, Jul 2025).
- 44% of all flood insurance claims since 1978 came from an accumulation of rainfall or snowmelt, not from a river or the sea (OpenFEMA NFIP Claims, Sep 2026).
- 2.8 million US homes reported water leaking into the basement from outside in the past 12 months (Census Bureau AHS, Jan 2025).
- Among homes with a basement or crawl space that lost power, 343,000 had water collect because the sump pump stopped, and 3.7 million had no sump pump at all (Census Bureau AHS, Jan 2025).
- Over 300,000 structures flooded in southeastern Texas during Hurricane Harvey (NHC, May 2018).
- Eleven people in New York drowned inside their own homes or apartments during the Hurricane Ida flooding (NHC, Apr 2022).
- Retrofitting older homes in the 100-year floodplain could save about $6 for every $1 spent (NIBS, Dec 2019).
How Often Do Floods Hit the United States?
Flooding does not need a hurricane or a coastline. It reaches nearly every county, and the official record shows it arriving in more clusters than it used to.
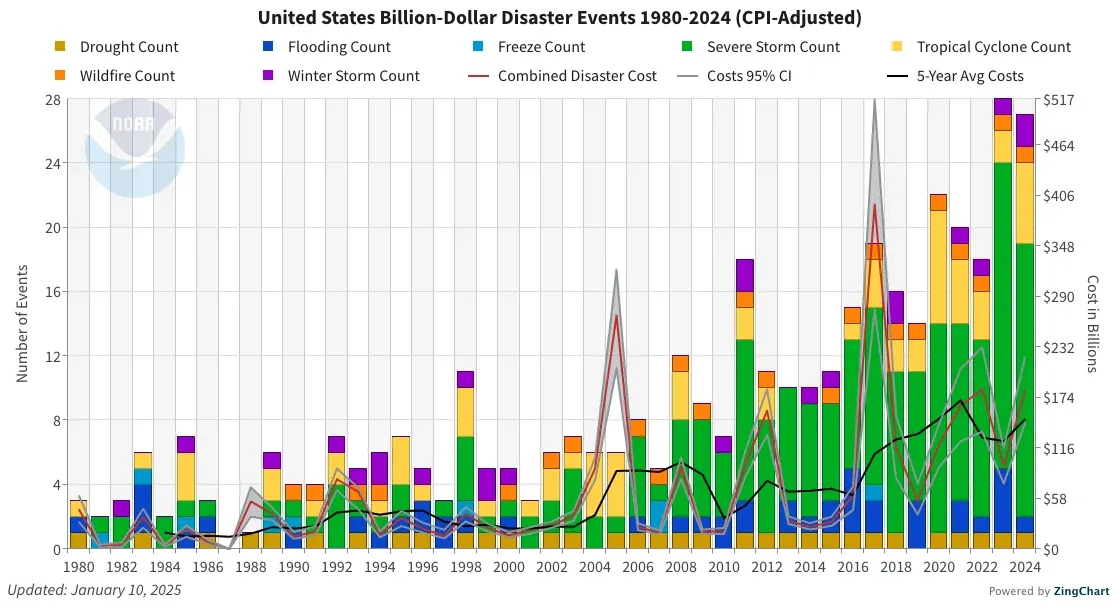 Figure 1: Flooding is a modest slice of each year’s billion-dollar disaster count, but the total number of events per year has climbed steeply since 2010, and flood years cluster in the 1990s and 2010s. Source: NOAA NCEI, U.S. Billion-Dollar Weather and Climate Disasters, Jan 2025. Screenshot of the source page, captured 21 Oct 2026.
How many billion-dollar flood events has the US had?
- Flooding averaged 1.0 billion-dollar event per year from 1980 to 2024 (NOAA NCEI, Jan 2025).
- Flooding made up 11.2% of all billion-dollar events in that period (NOAA NCEI, Jan 2025).
- The 2010s had 18 billion-dollar flood events, against 4 in the 2000s (NOAA NCEI, Jan 2025).
- Eight billion-dollar flood events fell in the five years from 2020 to 2024 (NOAA NCEI, Jan 2025).
- All billion-dollar disaster types together averaged 23.0 events per year in 2020 to 2024, against 9.0 per year over 1980 to 2024 (NOAA NCEI, Jan 2025).
How many counties have flooded?
- Nearly half of US counties, 49%, had a flood in the past five years (FEMA FloodSmart, Oct 2026).
- 888 of the 2,952 major disaster declarations since 1953 were for floods, which is 30.1% and second only to severe storms at 1,106 (OpenFEMA Disaster Declarations, Oct 2026).
- The President declared 21 flood major disasters in 2023 and 20 in 2024 (OpenFEMA Disaster Declarations, Oct 2026).
- The count was 11 in 2025 and 12 so far in 2026 (OpenFEMA Disaster Declarations, Oct 2026).
How likely is a flood during a mortgage?
- A property in a 1% annual chance flood zone has a 26% chance of flooding over a 30-year mortgage (FEMA, Nov 2025).
How Much Damage Do Floods Cause?
Every tally of flood damage is partial. Billion-dollar lists leave out the small events, insurance data leaves out the uninsured, and models fill the gap with estimates. Read them together.
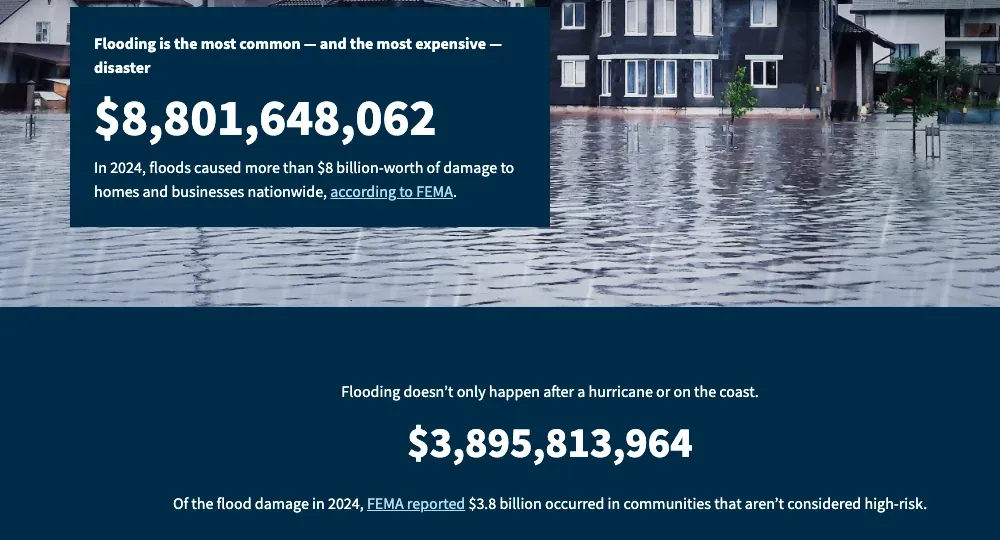 Figure 2: FEMA’s own count puts 2024 flood damage above $8.8 billion, with more than $3.8 billion landing outside the zones the agency maps as high risk. Source: FEMA FloodSmart, The Cost of Flooding, Oct 2026. Screenshot of the source page, captured 21 Oct 2026.
What do the billion-dollar flood events add up to?
- Flooding was 7.0% of the total cost of all billion-dollar disasters, which came to $2,918.1 billion (NOAA NCEI, Jan 2025).
- A billion-dollar flood event cost $4.5 billion on average, against $23.0 billion for a tropical cyclone (NOAA NCEI, Jan 2025).
- The 1993 Midwest flood cost $46.3 billion, the largest on the list (NOAA NCEI, Jan 2025).
- The 2008 Midwest flood cost $14.9 billion (NOAA NCEI, Jan 2025).
- The March 2019 Missouri River and North Central flood cost $13.4 billion (NOAA NCEI, Jan 2025).
- The August 2016 Louisiana flood cost $13.3 billion (NOAA NCEI, Jan 2025).
What do flood insurance claims show?
- The National Flood Insurance Program paid 101,494 claims worth more than $7.96 billion in 2024 (FEMA NFIP Media Toolkit, Jul 2025).
- FEMA’s public claims file holds 2,725,989 claims since 1978 (OpenFEMA NFIP Claims, Sep 2026).
- Those claims paid out about $89.9 billion on buildings, contents and compliance costs combined (OpenFEMA NFIP Claims, Sep 2026).
- Losses in 2005 produced $17.8 billion in payments, the largest year in the file (OpenFEMA NFIP Claims, Sep 2026).
- Losses in 2017 produced $10.7 billion in payments (OpenFEMA NFIP Claims, Sep 2026).
- Hurricane Ian in 2022 led to close to 50,000 claims and $5 billion in payments (FEMA NFIP Media Toolkit, Jul 2025).
- Flood events in the Midwest and South in 2019 left damage of more than $20 billion (FEMA NFIP Media Toolkit, Jul 2025).
What do modeled losses say?
- A peer-reviewed national model puts average annual US flood losses at $32.1 billion in the 2020 climate (Nature Climate Change, Jan 2022).
- Of that, $13.2 billion falls inside FEMA’s high-risk zones and $19.1 billion outside them (Nature Climate Change, Jan 2022).
- River and stream flooding alone causes $2.9 billion of damage each year, according to FEMA (FEMA FloodSmart, Oct 2026).
- The National Weather Service recorded $1.35 billion of flash flood property damage in 2025 (NWS, Jul 2026).
How Deadly Are Floods?
Floods are the weather hazard people underestimate most. The deaths are rarely in the house. They happen in cars, at low crossings and at campsites, and the numbers have been rising.
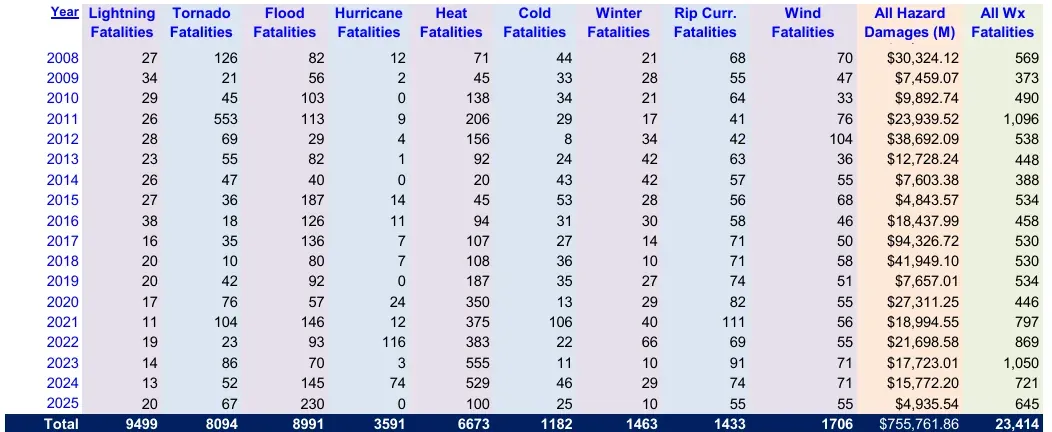 Figure 3: Flood deaths swing with single events, but 2025 stands out against every other hazard in the National Weather Service’s own table. The Total row covers 1940 to 2025, not just the years shown. Source: NWS, Weather Related Fatality and Injury Statistics, 81-year list, Jul 2026. Table rendered from the source PDF, captured 21 Oct 2026.
How many people die in floods each year?
- Of the 2025 flood deaths, 209 were flash flood deaths and 21 were river flood deaths (NWS, Jul 2026).
- Floods caused 35.7% of the 645 weather deaths recorded in 2025 (NWS, Jul 2026).
- Heat killed 100 people in 2025, tornadoes 67 and rip currents 55 (NWS, Jul 2026).
- The 10-year average is 118 flood deaths a year and the 30-year average is 94 (NWS, Jul 2026).
- The table records 8,991 flood deaths from 1940 to 2025 (NWS, Jul 2026).
- Billion-dollar flood events killed an average of 17 people a year from 1980 to 2024, 765 deaths in all (NOAA NCEI, Jan 2025).
- The deadliest billion-dollar flood was the November 1985 event across Virginia, West Virginia, Pennsylvania and Maryland, with 62 deaths (NOAA NCEI, Jan 2025).
Where do flood deaths happen?
- 66 of the 230 flood deaths in 2025, or 28.7%, were in vehicles (NWS, Jul 2026).
- 42 people died while camping, 18.3% of the total (NWS, Jul 2026).
- 40 people died in permanent homes, 17.4% of the total (NWS, Jul 2026).
- Texas had 144 of the 230 deaths (NWS, Jul 2026).
- Kentucky had 19 and West Virginia 12 (NWS, Jul 2026).
- 38 of the victims, or 16.5%, were under 10 years old (NWS, Jul 2026).
How much moving water does it take?
- Six inches of fast-moving flood water can knock over an adult (NWS, Oct 2026).
- Twelve inches of rushing water can carry away most cars (NWS, Oct 2026).
- Two feet of rushing water can carry away SUVs and trucks (NWS, Oct 2026).
- The CDC reports that over half of flood-related drownings happen when a vehicle is driven into flood water (NWS, Oct 2026).
What Did Recent Major Flood Disasters Do to Homes?
Big storms are where the damage to plumbing, water heaters and basements stops being abstract. The hurricane reports from the National Hurricane Center count structures, not just dollars.
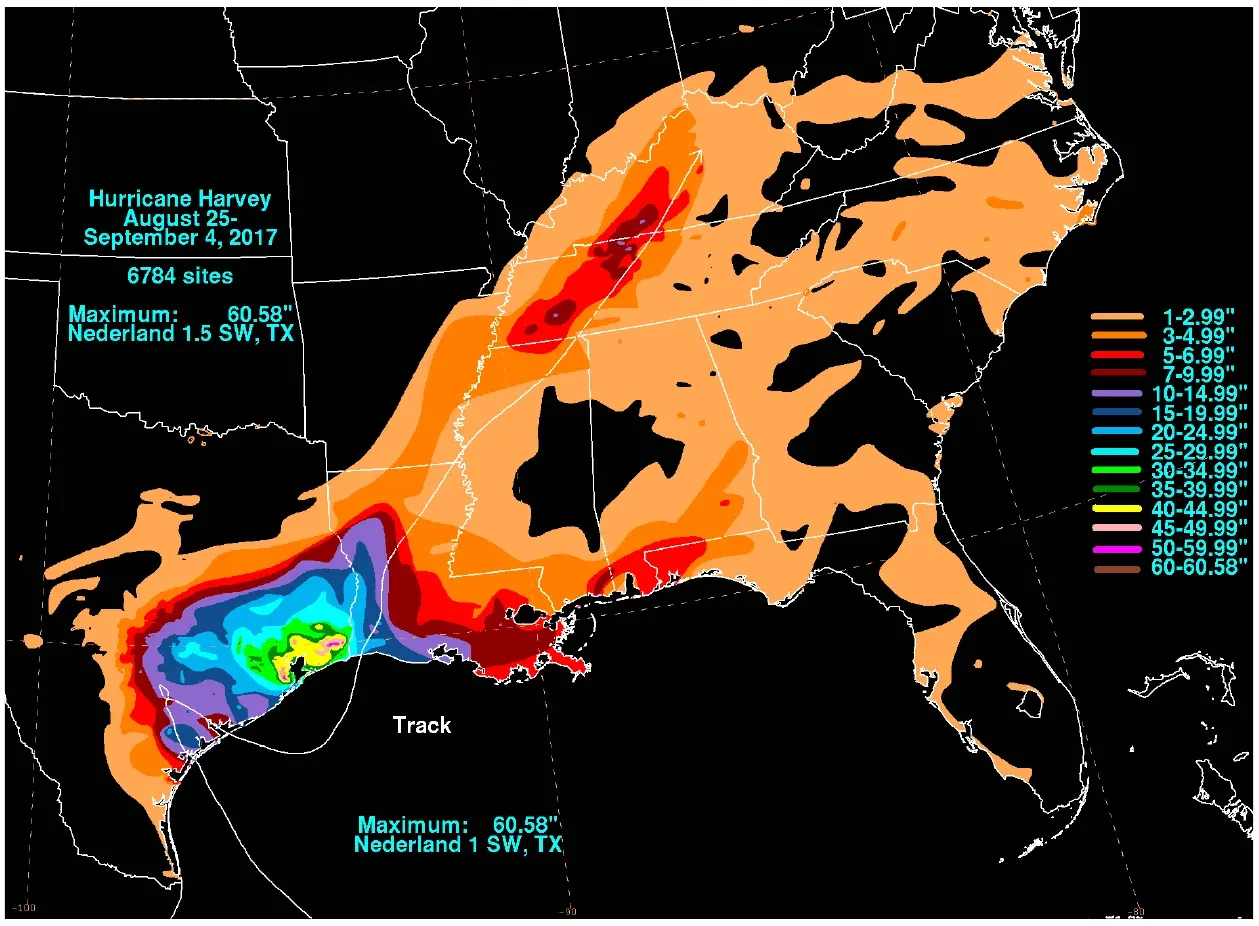 Figure 4: Harvey stalled over southeastern Texas and dropped rain totals that set the US record for a tropical cyclone. Source: NHC, Tropical Cyclone Report: Hurricane Harvey, May 2018. Chart published by the source (figure courtesy NOAA Weather Prediction Center), captured 21 Oct 2026.
What happened in Hurricane Harvey?
- The highest rainfall total was 60.58 inches near Nederland, Texas (NHC, May 2018).
- Harvey caused at least 68 direct deaths, all in Texas (NHC, May 2018).
- All but three of those deaths came from freshwater flooding (NHC, May 2018).
- Up to 500,000 cars were reported flooded (NHC, May 2018).
- About 30,000 water rescues were conducted (NHC, May 2018).
- An estimated 40,000 flood victims went to shelters (NHC, May 2018).
- NOAA’s damage estimate is $125 billion (NHC, May 2018).
- The report notes that a majority of residential flood claims came from outside the 500-year floodplain, where flood insurance participation is low (NHC, May 2018).
What happened in Hurricane Helene?
- Helene is responsible for at least 250 deaths in the United States, the most from a hurricane in the contiguous US since Katrina in 2005 (NHC, Feb 2026).
- Freshwater flooding caused at least 94 of the direct deaths, 77 of them in North Carolina (NHC, Feb 2026).
- Rainfall of 20 to 30 inches fell over a large area of the mountains of western North Carolina, and the highest total was 30.78 inches at Busick (NHC, Feb 2026).
What happened in the Northeast during Ida?
- Ida directly caused 49 deaths across the Mid-Atlantic and New England, and 48 of them were from freshwater flooding (NHC, Apr 2022).
- Two people in New Jersey and one in Maryland also drowned in their homes or apartments (NHC, Apr 2022).
- NCEI estimates Ida’s winds, rain, surge and tornadoes caused $75 billion of damage in the United States (NHC, Apr 2022).
- Freshwater flooding in New Jersey caused about $8 billion to $10 billion of damage (NHC, Apr 2022).
- Freshwater flooding in New York caused about $7.5 billion to $9 billion (NHC, Apr 2022).
- Urban flooding inundated the basements of many buildings in the Northeast, and thousands of structures were affected (NHC, Apr 2022).
How Many US Homes Are at Risk of Flooding?
The flood map on a lender’s form is a legal line, not a risk forecast. Homes outside it flood too, and that is where most of the surprise comes from.
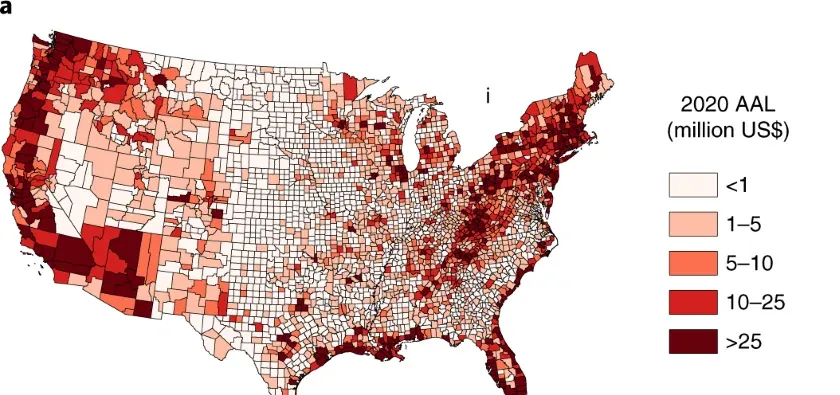 Figure 5: Modeled flood losses are not limited to coasts. Inland counties in the Appalachians, the Northeast and the Pacific states carry some of the largest average annual losses. Source: Nature Climate Change, Inequitable patterns of US flood risk in the Anthropocene, Jan 2022. Chart published by the source (open access), captured 21 Oct 2026.
How much flood risk sits outside the mapped zones?
- Flood loss per dollar of exposure is 14.7 times higher inside the high-risk zones than outside them (Nature Climate Change, Jan 2022).
- Only one-third of US rivers have been modeled by FEMA since mapping began in 1967 (Nature Climate Change, Jan 2022).
- Only one-quarter of those FEMA river models have been updated in the past five years (Nature Climate Change, Jan 2022).
- Over the past 10 years, 29% of flood insurance claims came from outside high-risk zones (FEMA FloodSmart, Oct 2026).
How many homes and people are exposed?
- The US has 109.3 million residential structures in FEMA’s penetration dataset (OpenFEMA Penetration Rates, Aug 2026).
- Only 3.84 million of them, 3.5%, stand in a high-risk flood zone (OpenFEMA Penetration Rates, Aug 2026).
- 15.3% of Louisiana’s residential structures and 13.3% of Florida’s are in high-risk zones (OpenFEMA Penetration Rates, Aug 2026).
- 11.7 million occupied homes are in neighborhoods whose residents agree the area is at high risk for floods or other disasters (Census Bureau AHS, Jan 2025).
- The current US population has an average annual exposure to flooding of 3.63 million people, or 1.18% (Nature Climate Change, Jan 2022).
How will exposure change by 2050?
- Climate change alone is projected to raise US flood risk by 26.4% by 2050 (Nature Climate Change, Jan 2022).
- Population growth in hazardous areas accounts for 74.7% of the projected rise in exposure, and climate change for 19.1% (Nature Climate Change, Jan 2022).
- The average annual exposure is projected to reach 7.16 million people by 2050 (Nature Climate Change, Jan 2022).
How Common Is Basement Flooding, and What Do Sump Pumps Change?
For a plumber, the flooded basement is the job. It is where the water heater, the sump pit, the floor drain and the sewer connection all sit, and the insurance rules treat each of them differently. Water heater failures are a separate topic, covered in water heater statistics.
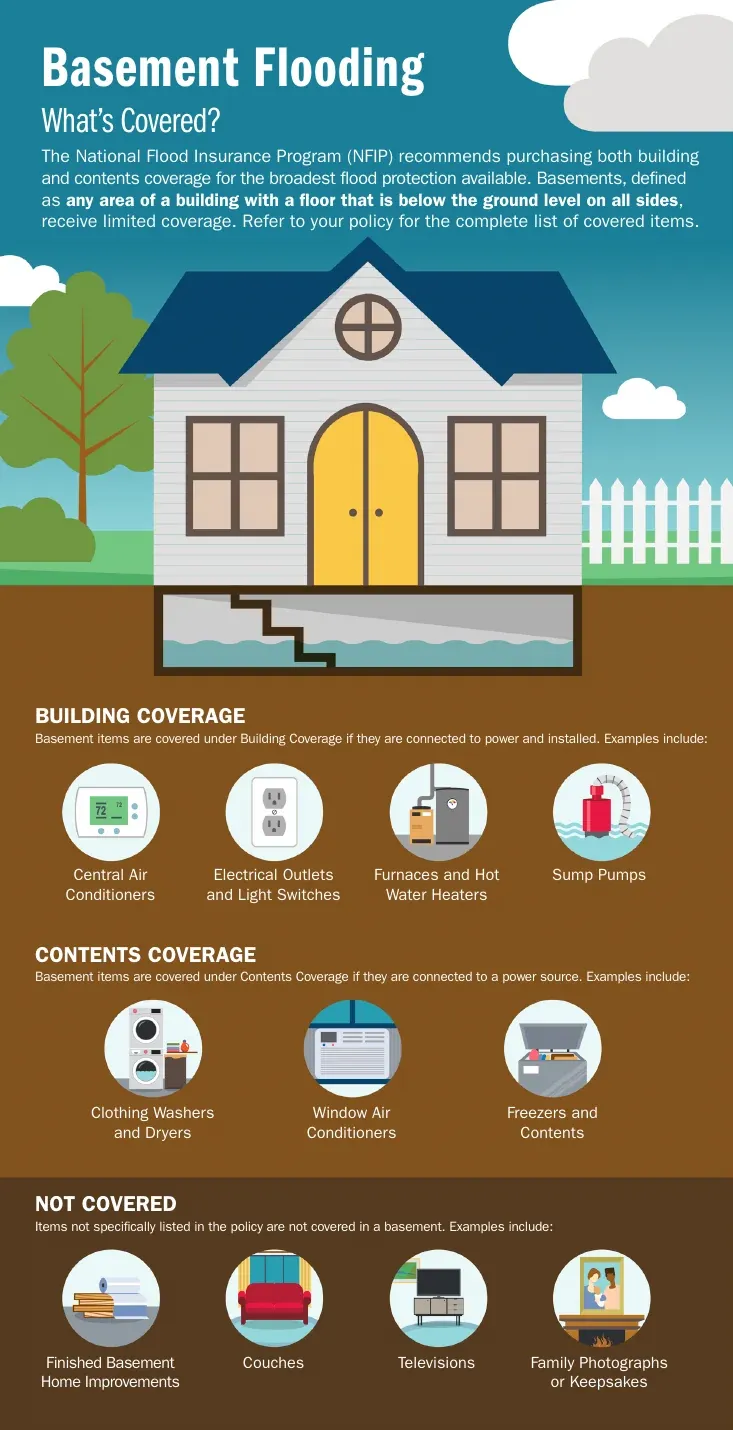 Figure 6: A standard federal flood policy pays for the machinery in a basement, including the sump pump and water heater, but not for finished improvements such as flooring and built-ins. Source: FEMA National Flood Insurance Program, Basement Flooding: What’s Covered, Oct 2021. Infographic published by the source, captured 21 Oct 2026.
What do basement flooding statistics show about leaks and mold?
- 28.3 million single-family homes have a basement under the whole house and 9.7 million have one under part of it (Census Bureau AHS, Jan 2025).
- Another 19.5 million single-family homes sit over a crawl space, and 35.1 million sit on a slab (Census Bureau AHS, Jan 2025).
- 389,000 homes reported mold in the basement (Census Bureau AHS, Jan 2025).
How often do sump pumps fail when the power goes out?
- 13.4 million homes with a basement or crawl space that lost power had no water collect (Census Bureau AHS, Jan 2025).
- FEMA advises a working sump pump, a water alarm and a battery-operated backup pump to limit basement flood damage (FEMA FloodSmart, Oct 2026).
- Water that backs up through sewers or drains, or comes from a sump pump discharge or overflow, is covered by flood insurance only when a flood as the policy defines it caused it (FEMA NFIP Media Toolkit, Jul 2025).
- The policy defines a flood as covering two or more acres of normally dry land or two or more properties, one of them yours (FEMA NFIP Media Toolkit, Jul 2025).
Where does the water come from?
- 686,709 claims, 25% of the file, came from tidal water overflow (OpenFEMA NFIP Claims, Sep 2026).
- 547,526 claims, 20%, came from a stream, river or lake overflow (OpenFEMA NFIP Claims, Sep 2026).
- 2,211,759 claims, 81%, were on single-family homes (OpenFEMA NFIP Claims, Sep 2026).
- If a community follows basement standards, owners in the high-risk area who have basements face a 15% to 20% higher premium (FEMA NFIP Agents, Oct 2026).
How Many Homeowners Carry Flood Insurance?
Very few. The gap is widest in the places that flood without warning, and it is the main reason a flooded basement turns into a debt instead of a claim.
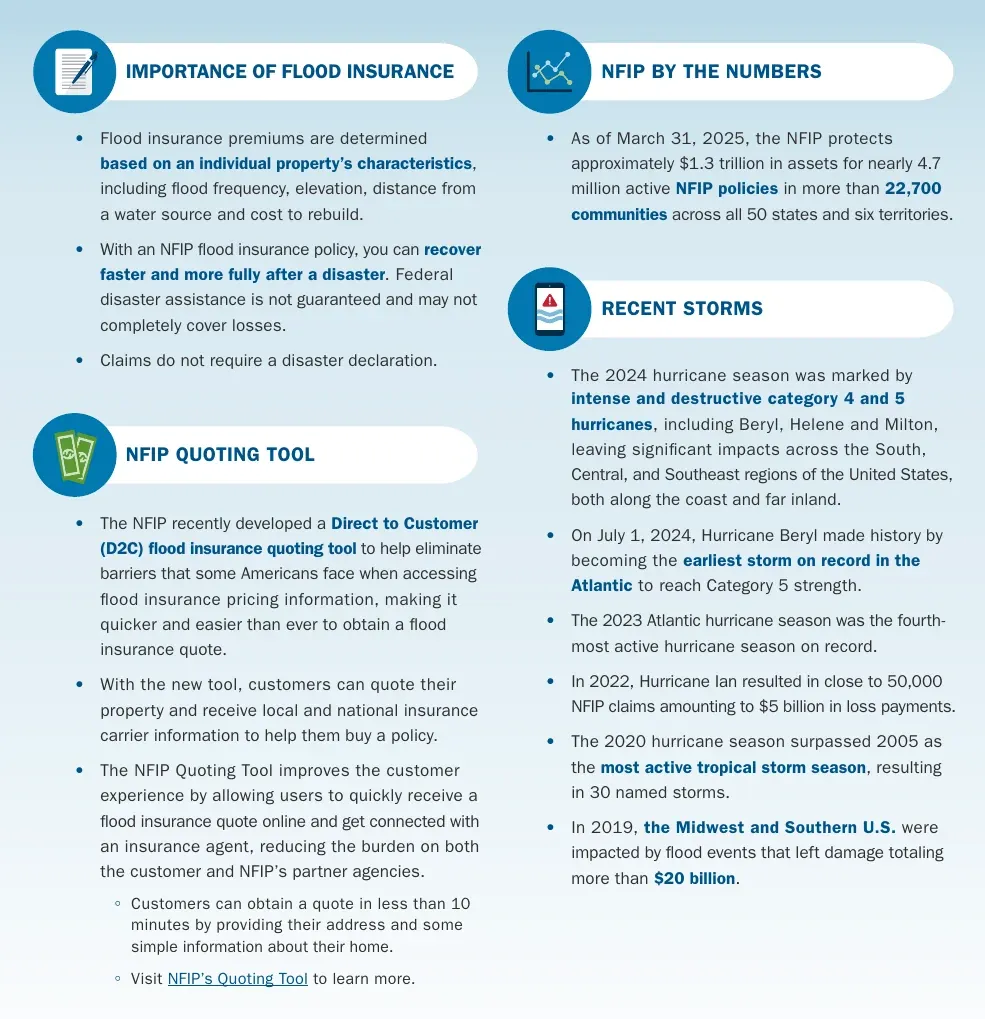 Figure 7: The federal program is large in dollars of coverage but small against the number of US homes. Source: FEMA NFIP Media Toolkit, Fast Facts, Jul 2025. Page published by the source, captured 21 Oct 2026.
How big is the National Flood Insurance Program?
- As of March 31, 2025, the program protected about $1.3 trillion in assets across nearly 4.7 million active policies in more than 22,700 communities (FEMA NFIP Media Toolkit, Jul 2025).
- In FEMA’s Watermark report current as of September 30, 2022, the average annual premium was $935, including the federal policy fee (FEMA, Sep 2022).
- FEMA counted 3,161,236 residential policy contracts in force in August 2026 (OpenFEMA Penetration Rates, Aug 2026).
How many policies sit inside and outside high-risk zones?
- 1.84 million residential contracts are inside high-risk zones, which leaves 41.8% of contracts outside them (OpenFEMA Penetration Rates, Aug 2026).
- 22.0% of Louisiana’s residential structures hold a policy, against 13.7% in Florida and 5.8% in Texas (OpenFEMA Penetration Rates, Aug 2026).
- Among residential structures inside high-risk zones, only 10.3% in West Virginia and 12.5% in Oklahoma hold a policy, the lowest rates of any state (OpenFEMA Penetration Rates, Aug 2026).
Which properties flood again and again?
- FEMA’s multiple-loss property file lists 240,651 properties, and 219,028 are flagged repetitive loss, meaning two or more paid claims over $1,000 within 10 years (OpenFEMA Multiple Loss Properties, Aug 2026).
- 34,996 are flagged severe repetitive loss, which means four or more claims over $5,000 each adding up to more than $20,000, or two building claims that together exceed the building’s market value (OpenFEMA Multiple Loss Properties, Aug 2026).
- Only 105,004 of the 240,651 properties in the file, or 43.6%, are currently insured by the program (OpenFEMA Multiple Loss Properties, Aug 2026).
What rules and limits come with a policy?
- FEMA says most homeowners insurance does not cover flooding and that an NFIP policy is the best way to protect a property (FEMA FloodSmart, Oct 2026).
- A homeowner can insure the building up to $250,000 and contents up to $100,000 (FEMA NFIP Media Toolkit, Jul 2025).
- Most policies take 30 days to take effect after purchase (FEMA NFIP Media Toolkit, Jul 2025).
- A home in a high-risk zone with a mortgage from a federally regulated lender must carry flood insurance, and the premium is escrowed (FEMA NFIP Agents, Oct 2026).
- The program owed Treasury $20.5 billion in March 2020, even after Congress cancelled $16 billion of its debt in 2017 (GAO, Jun 2020).
What Do Flood Claims and Disaster Aid Actually Pay?
Insurance pays on paperwork, and aid pays little. A contractor with itemized estimates and clean invoices is part of how a claim gets finished.
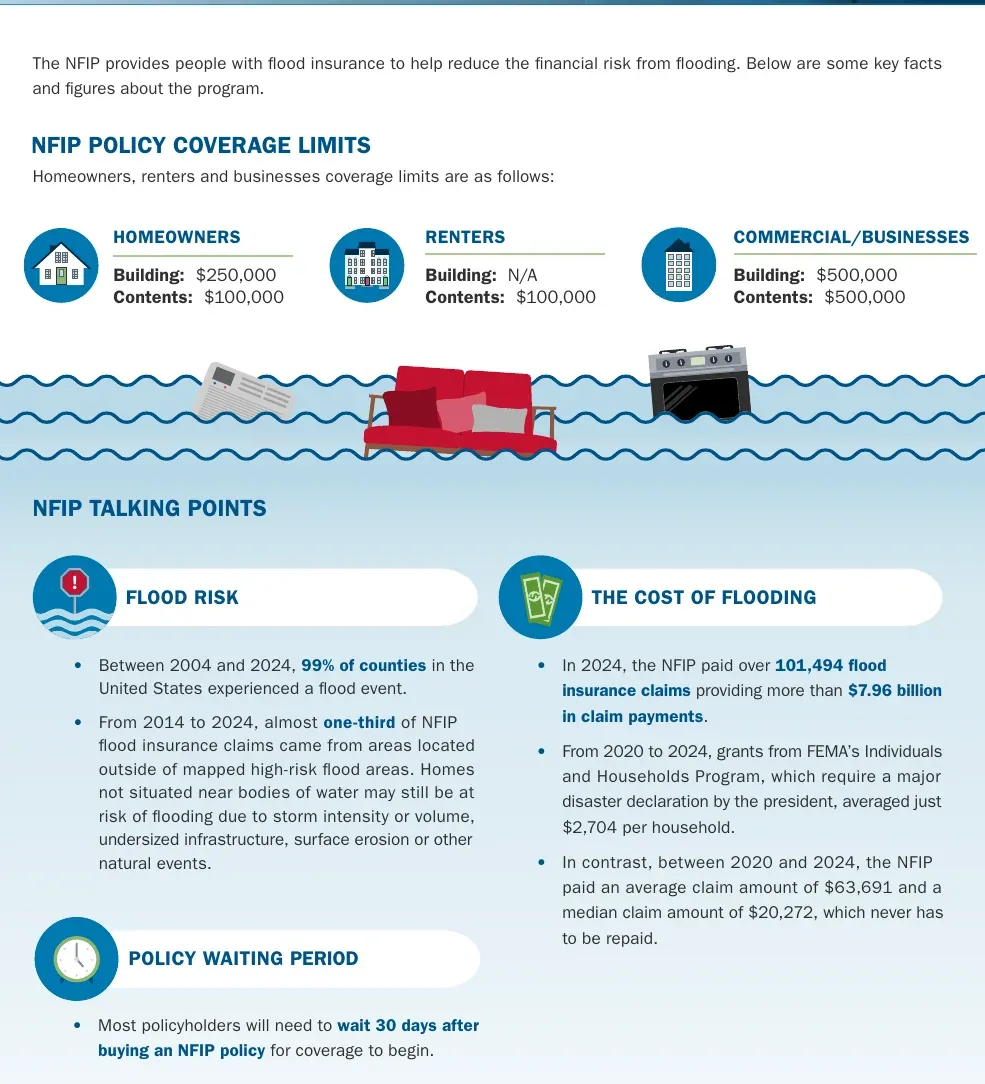 Figure 8: FEMA’s own comparison of insurance and aid, with coverage limits, the 30-day waiting period and the gap between a household grant and an average claim. Source: FEMA NFIP Media Toolkit, Fast Facts, Jul 2025. Page published by the source, captured 21 Oct 2026.
How do insurance payments compare with federal aid?
- The median NFIP claim from 2020 to 2024 was $20,272, which never has to be repaid (FEMA NFIP Media Toolkit, Jul 2025).
- Federal disaster assistance is available only after a presidential declaration, and most flood events do not get one; when aid comes, it is typically a loan that must be repaid with interest (FEMA FloodSmart, Oct 2026).
- A homeowner can borrow up to $500,000 from the SBA to repair or replace a primary residence (SBA, Oct 2026).
- Homeowners and renters can borrow up to $100,000 for personal property (SBA, Oct 2026).
- For applicants who cannot get credit elsewhere, the fixed rate does not exceed 4% and the term runs up to 30 years (SBA, Oct 2026).
What does a flood repair cost an owner?
- Owners reported 214,000 projects to repair flood damage that required extensive repairs, in the two years before the 2023 survey (Census Bureau AHS, Jan 2025).
- The median cost of a flood repair project was $10,000 (Census Bureau AHS, Jan 2025).
- The mean cost was $19,810 (Census Bureau AHS, Jan 2025).
- Total owner spending on flood repair projects came to $4.18 billion (Census Bureau AHS, Jan 2025).
What does the claims process ask of a contractor?
- A standard NFIP claim takes four to eight weeks to be finalized and paid (FEMA, Jan 2026).
- FEMA tells owners to hire contractors who are licensed, bonded and insured, and to get estimates in writing (FEMA, Jan 2026).
- FEMA tells owners to keep contractor invoices, because they must document later that previous flood damage was repaired (FEMA, Jan 2026).
What drives what a policy costs?
- Most rates cannot rise more than 18% in a year under existing law (FEMA, Apr 2026).
- Communities in the Community Rating System can earn policyholder discounts of 5% to 45% (FEMA, Apr 2026).
- Increased Cost of Compliance coverage pays up to $30,000 toward elevation, relocation, demolition or floodproofing (FEMA NFIP Agents, Oct 2026).
What Does Flood Mitigation Save?
Prevention is the one part of this data that is good news. Money spent before the water arrives comes back several times over, and much of the work is plumbing and mechanical work.
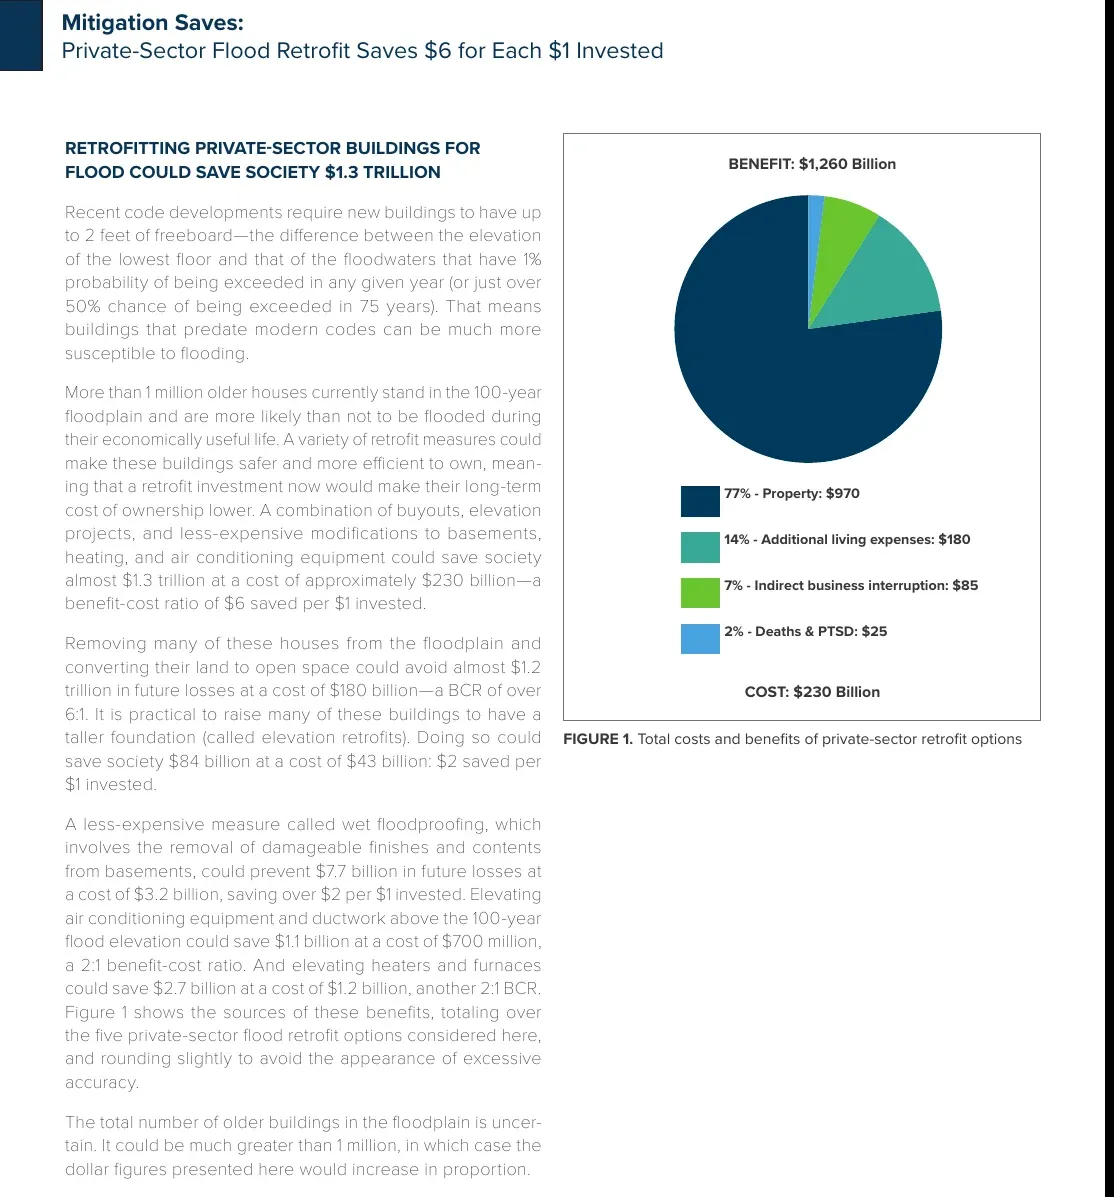 Figure 9: Most of the benefit from retrofitting older floodplain homes is avoided property damage, with smaller shares from living expenses, business interruption and deaths. Source: NIBS, Natural Hazard Mitigation Saves: 2019 Report, Dec 2019. Report page rendered from the source PDF, captured 21 Oct 2026.
What do building codes and elevation save?
- Building new homes one foot above the 100-year flood elevation adds $90 million of cost a year and saves $550 million, a 6-to-1 return (NIBS, Dec 2019).
- Building up to five feet above that elevation could save $4.2 billion for $900 million, a 5-to-1 return (NIBS, Dec 2019).
- Raising older homes on taller foundations could save $84 billion at a cost of $43 billion (NIBS, Dec 2019).
- Federal riverine flood mitigation grants return about $7 for every $1 (NIBS, Dec 2019).
- Past federal riverine grants cost $11.5 billion and will save about $82 billion (NIBS, Dec 2019).
What do retrofits inside the house save?
- More than 1 million older houses stand in the 100-year floodplain (NIBS, Dec 2019).
- Wet floodproofing basements, by removing damageable finishes and contents, could prevent $7.7 billion of losses at a cost of $3.2 billion (NIBS, Dec 2019).
- Elevating air conditioning equipment and ductwork could save $1.1 billion at a cost of $700 million (NIBS, Dec 2019).
- Elevating heaters and furnaces could save $2.7 billion at a cost of $1.2 billion (NIBS, Dec 2019).
- FEMA says electrical and plumbing systems account for a significant portion of flood damage, and elevated utilities are less likely to be damaged (FEMA FloodSmart, Oct 2026).
What do discounts and grants do for owners?
- Raising a building one foot above the base flood elevation often cuts annual premiums by 30% (FEMA NFIP Agents, Oct 2026).
- Raising the deductible to the $10,000 maximum can lower the yearly cost by up to 40% (FEMA NFIP Agents, Oct 2026).
- Policyholders can be reimbursed up to $1,000 for loss avoidance supplies such as sandbags, and for water pumps and labor (FEMA NFIP Agents, Oct 2026).
- Between 1989 and 2018, FEMA helped states and localities mitigate more than 50,000 properties (GAO, Jun 2020).
- About 80% of those mitigated properties were property acquisitions (GAO, Jun 2020).
- Three FEMA grant programs funded $2.3 billion in mitigation projects from fiscal years 2014 through 2018 (GAO, Jun 2020).
- Only 13,182 of the 240,651 properties in the multiple-loss file are recorded as mitigated (OpenFEMA Multiple Loss Properties, Aug 2026).
Methodology and Sources
Statistics were selected from primary publishers only: the National Oceanic and Atmospheric Administration and its National Weather Service, National Hurricane Center and National Centers for Environmental Information; the Federal Emergency Management Agency and its public data service OpenFEMA; the US Census Bureau; the Government Accountability Office; the Small Business Administration; the National Institute of Building Sciences; and one peer-reviewed study in Nature Climate Change. Aggregators and statistics roundups were not used. Each link was opened on 21 October 2026 and the number was read from the saved text of the page, PDF or data file.
Some figures are counts or sums from FEMA public data files rather than published headlines: the claim cause and single-family counts, the policy and structure totals, the repetitive loss counts and the declaration counts come from the OpenFEMA claims, penetration, multiple loss and declarations files, and the dollar total paid is the sum of the building, contents and compliance payment fields in the claims file. Percentages marked in the text, such as 41.8% and 43.6%, are calculated from the cited counts. The OpenFEMA claims counts can be checked with the file’s public API. FEMA’s FloodSmart and agent pages do not show a page date, so they carry the month the page was read. NOAA stopped updating its billion-dollar disaster product, so those figures end with 2024. Weather Service fatality figures for 2025 are preliminary. The page is refreshed monthly. It belongs to the wider set of plumbing industry statistics, and the cleanup trade that follows floods is covered in water damage restoration industry statistics.
Sources
- NOAA NCEI, U.S. Billion-Dollar Weather and Climate Disasters, United States Summary
- NOAA NCEI, Billion-Dollar Weather and Climate Disasters, notice of end of updates
- NWS, Weather Related Fatality and Injury Statistics, 81-year list
- NWS, Summary of Natural Hazard Statistics for 2025
- NWS, 2025 Flash Flood and River Flood Fatalities
- NWS, Turn Around Don’t Drown
- NHC, Tropical Cyclone Report: Hurricane Harvey
- NHC, Tropical Cyclone Report: Hurricane Helene
- NHC, Tropical Cyclone Report: Hurricane Ida
- FEMA FloodSmart, The Cost of Flooding
- FEMA FloodSmart, What Is a Flood
- FEMA FloodSmart, Eligibility
- FEMA FloodSmart, Minimize Damage
- FEMA NFIP Media Toolkit
- FEMA NFIP, Basement Flooding: What’s Covered
- FEMA NFIP Agents, Reducing Insurance Costs
- FEMA NFIP Agents, Flood Insurance 101
- FEMA NFIP Agents, Flood Loss Avoidance
- FEMA, Know Your Risk for Homeowners
- FEMA, Starting Your Recovery After a Flood
- FEMA, NFIP Pricing Approach, Risk Rating 2.0
- FEMA, The Watermark: NFIP Financial Statements
- OpenFEMA, NFIP Redacted Claims v3
- OpenFEMA, NFIP Residential Penetration Rates v1
- OpenFEMA, NFIP Multiple Loss Properties v1
- OpenFEMA, FEMA Web Disaster Declarations v1
- US Census Bureau, American Housing Survey 2023, table specifications and public use file estimates
- Wing et al., Inequitable patterns of US flood risk in the Anthropocene, Nature Climate Change
- National Institute of Building Sciences, Natural Hazard Mitigation Saves: 2019 Report
- GAO, National Flood Insurance Program: Fiscal Exposure Persists Despite Property Acquisitions (GAO-20-508)
- SBA, Physical Damage Loans
Glossary
- AAL: average annual loss, the long-run yearly expected loss from a hazard.
- AHS: the American Housing Survey from the US Census Bureau.
- BFE: base flood elevation, the height floodwater reaches in a 1% annual chance flood.
- CPI-adjusted: adjusted to the dollars of a fixed year for inflation.
- ICC: Increased Cost of Compliance, an NFIP coverage that helps pay to elevate, relocate, demolish or floodproof.
- NCEI: NOAA National Centers for Environmental Information.
- NFIP: the National Flood Insurance Program run by FEMA.
- NHC: the National Hurricane Center.
- NIBS: the National Institute of Building Sciences.
- NWS: the National Weather Service.
- Repetitive loss: a structure with repeated paid flood claims; severe repetitive loss means four or more large claims or similar totals.
- SFHA: Special Flood Hazard Area, the zone FEMA maps as having a 1% or higher annual chance of flooding.
- WYO: the Write Your Own program, where private insurers sell and service NFIP policies.