Water damage claims statistics show a pattern insurers know well and owners rarely see. Water is a top-three cause of homeowners claims, it is not rare, and each claim now costs more than it did five years ago. This page collects the counts, shares, payouts, trends, coverage rules, disputes and deadlines that insurers, data firms and regulators publish for US homeowners insurance.
It covers homeowners insurance claims only. It leaves out causes and prevention, flood policies and frozen-pipe claims. For the restoration trade, see water damage restoration industry statistics. For leaks in homes, see water leak statistics. For the wider trade, see plumbing industry statistics.
Most figures describe insured homes, not every home, and several come from one state or one group of insurers. The text says which. For a plumbing shop, the claim is the other side of the job: the adjuster reads the invoice, the photos and the notes, and the insurer’s deadlines decide when the customer’s money moves. Every number below is dated and linked to the report, rule or page it came from.
Key Takeaways
- About one in 60 insured homes has a water damage or freezing claim each year, based on Triple-I’s calculation from ISO data for 2018 to 2020 (Triple-I, Oct 2026).
- The average water damage and freezing claim paid $15,400 across 2019 to 2023 (Triple-I, Oct 2026).
- Water damage and freezing made up 22.6% of homeowners claims in 2023 (Triple-I, Oct 2026).
- Water was 29.9% of property claim assignments in July to September 2025 (Verisk, Sep 2025).
- The severity of non-weather water claims rose 63.16% between 2019 and 2025 (LexisNexis Risk Solutions, Jul 2026).
- Florida water losses rose at an average 42.1% a year from 2015 to mid-2017, as claim counts and costs both climbed (Florida OIR, Jan 2018).
- Florida water claims with an assignment of benefits cost at least 85% more than those without one (Florida OIR, Jan 2018).
- 11.61% of Florida accidental discharge and overflow claims closed in 2022 were litigated (Florida OIR, Jan 2024).
- 43.7% of those Florida claims were reopened after closing (Florida OIR, Jan 2024).
- Texas insurers must accept or reject a claim within 15 business days of getting every item they asked for (Texas Legislature, Oct 2026).
- Florida insurers must pay or deny a claim within 60 days of notice (Florida Legislature, Oct 2026).
- Washington’s deadline for an insurer to accept or deny a claim becomes 30 calendar days from notice of claim on October 18, 2026 (Washington Administrative Code, Aug 2026).
- Texas home insurers cannot charge more for claims they did not pay, including claims denied because the policy does not cover the damage (Texas Department of Insurance, Feb 2026).
- Only 51% of homeowners know the specific details of their policy and coverage (LexisNexis Risk Solutions, Sep 2024).
How Often Do Homeowners File a Water Damage Insurance Claim?
Most insured homes file nothing in a given year, but water is far from a rare cause. It ranks second only to wind and hail among the perils insurers pay for.
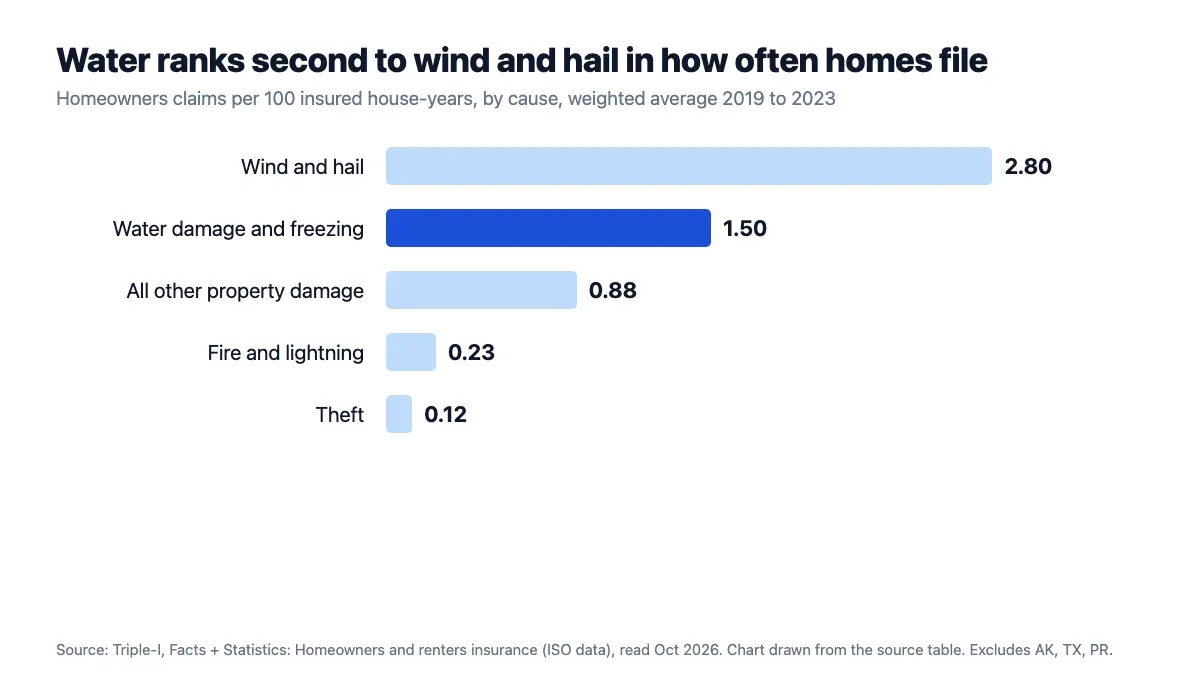 Figure 1: Wind and hail lead on frequency, water damage and freezing come second, and fire and theft are rare by comparison. Source: Triple-I, Facts + Statistics: Homeowners and renters insurance (ISO data), Oct 2026. Chart drawn by this site from the source table, captured 21 Oct 2026.
How Many Insured Homes File Any Claim in a Year?
- 5.3% of insured homes had a claim in 2023, compared with 6.4% in 2020 (Triple-I, Oct 2026).
- Over 2018 to 2022, 5.8% of insured homes had a claim, and 1.6% had a water damage or freezing claim (Triple-I, Oct 2026).
How Does Water Compare With Other Causes?
- Per 100 insured house-years from 2019 to 2023, wind and hail drew 2.80 claims, water damage and freezing 1.50, fire and lightning 0.23 and theft 0.12 (Triple-I, Oct 2026).
- The ISO data excludes Alaska, Texas and Puerto Rico, and it counts mold damage inside the water category when mold is covered (Triple-I, Oct 2026).
Are Water Claims Getting Less Frequent?
- The frequency of non-weather water claims fell 10.3% in 2023 (LexisNexis Risk Solutions, Oct 2024).
- It fell another 9.9% in 2024 (LexisNexis Risk Solutions, Oct 2025).
- It fell 7.8% in 2025 (LexisNexis Risk Solutions, Jul 2026).
- Weather-related water claim frequency fell 25.5% in 2023 and 3.2% in 2024 (LexisNexis Risk Solutions, Oct 2024; LexisNexis Risk Solutions, Oct 2025).
- Verisk logged 1,070,614 claim assignments in July to September 2025, 28.5% fewer than a year earlier and the lowest third quarter in five years (Verisk, Sep 2025).
- Verisk expects 2025 to total 4.3 to 4.5 million claims, the lowest annual volume in five years (Verisk, Sep 2025).
What Share of Homeowners Claims Comes From Water Damage?
Water is the second largest slice of the claims pie in nearly every data set, and in some periods it comes close to a third. The share moves with the weather, because wind, hail and hurricanes swell the other slices.
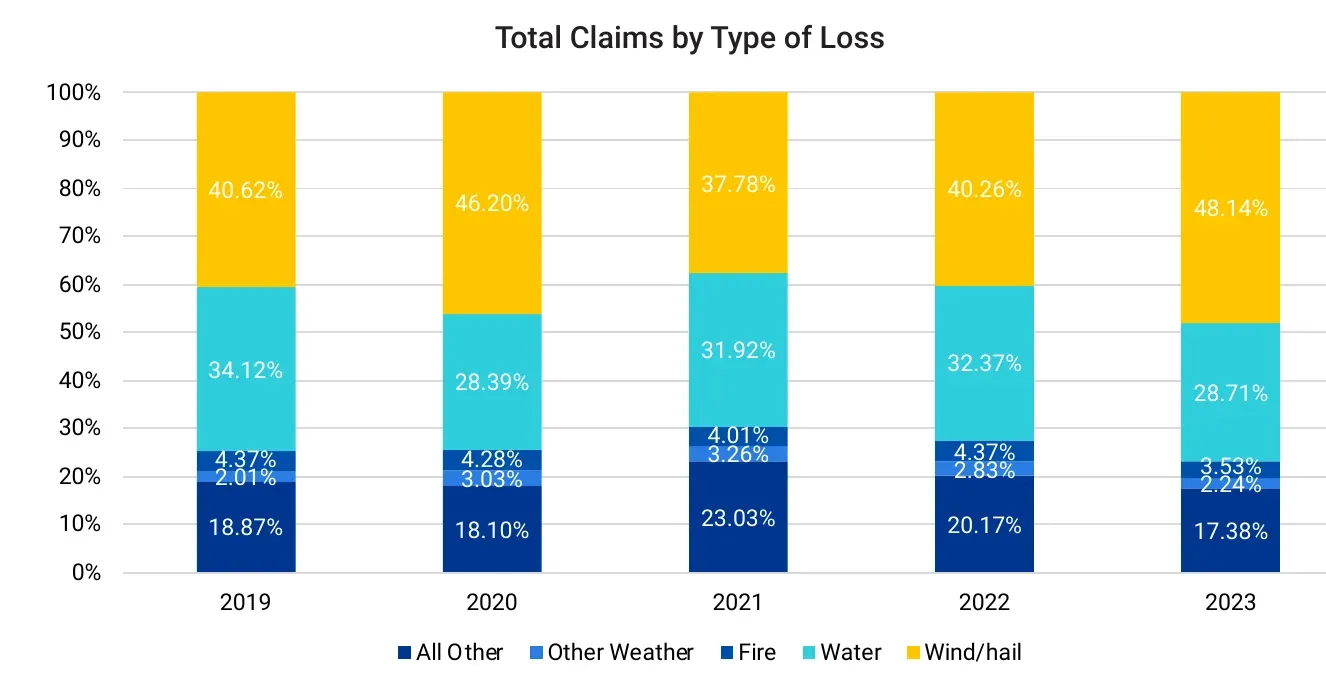 Figure 2: Water took between 28% and 34% of claim assignments every year from 2019 to 2023, behind or near wind and hail. Source: Verisk, Quarterly Property Report Q4 2023, Dec 2023. Chart published by the source, cropped from the report, captured 21 Oct 2026.
What Share of Repair Claims Is Water?
- Verisk counts the claims sent through its XactAnalysis platform. In that data, water was 34.12% of claims in 2019 and 28.71% in 2023 (Verisk, Dec 2023).
- Wind and hail were 48.14% of claims in 2023 (Verisk, Dec 2023).
- Water was 33.64% of assignments from January to March 2024 (Verisk, Mar 2024).
- It was 23.2% from October to December 2024 (Verisk, Dec 2024).
- It was 28.7% from January to March 2025 (Verisk, Mar 2025).
- It was 21.2% from April to June 2025, when wind and hail took 63% of claims (Verisk, Jun 2025).
How Did the Number of Water Claims Change From Year to Year?
- Water claims fell 2% from the fourth quarter of 2023 to the fourth quarter of 2024 (Verisk, Dec 2024).
- They fell 16% from the first quarter of 2024 to the first quarter of 2025 (Verisk, Mar 2025).
- They fell 10% from the second quarter of 2024 to the second quarter of 2025 (Verisk, Jun 2025).
- They fell 11% from the third quarter of 2024 to the third quarter of 2025 (Verisk, Sep 2025).
What Share Do Insurers’ Own Loss Records Show?
- In ISO’s loss data, water damage and freezing was 28.7% of homeowners claims in 2019, 19.8% in 2020, 23.7% in 2021 and 25.8% in 2022 (Triple-I, Oct 2026).
- Wind and hail were 42.5% of claims in 2023 and fire and lightning 21.6% (Triple-I, Oct 2026).
How Big a Share Is Sewer and Drain Backup?
- Drain and sewage claims were 1.8% of Verisk’s July to September 2025 volume, up 46% on a year earlier (Verisk, Sep 2025).
- They were 1.0% from April to June 2025 (Verisk, Jun 2025) and 0.9% from January to March 2025 (Verisk, Mar 2025).
- Sewer backup was 0.72% of assignments from January to March 2024 (Verisk, Mar 2024).
How Much Does the Average Water Damage Insurance Claim Pay?
A water claim is a mid-sized loss. It costs about what a wind or hail claim does, a fraction of a fire claim, and more each year.
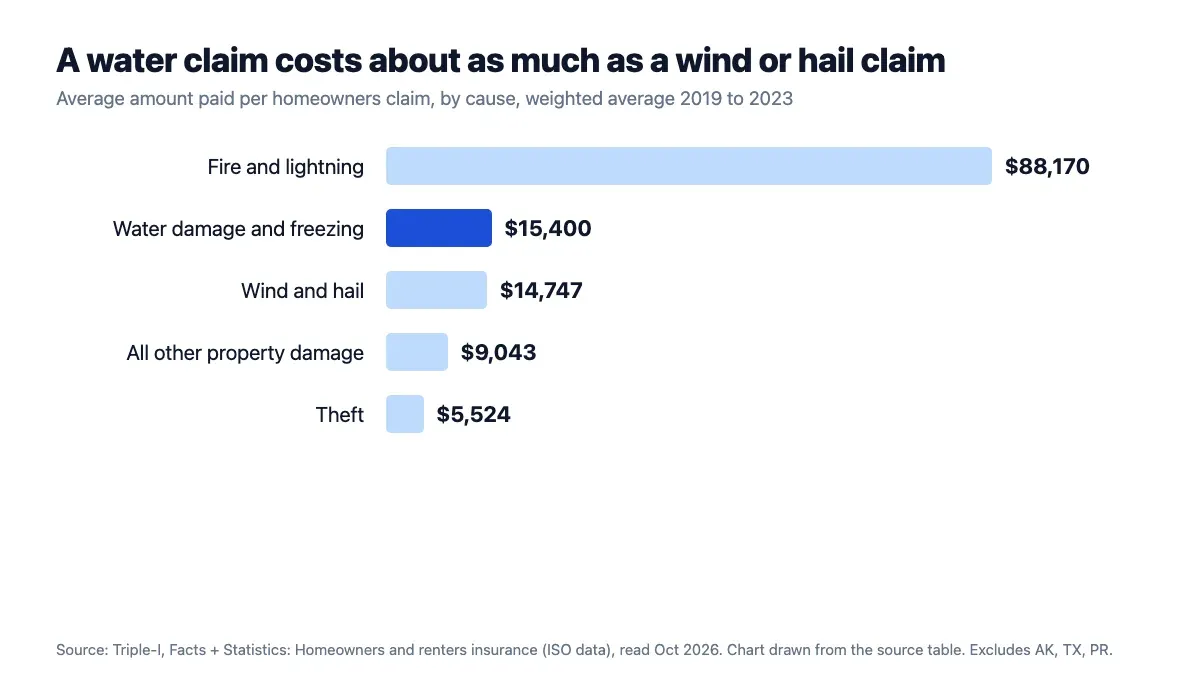 Figure 3: A fire claim paid more than five times a water claim, while water and wind or hail claims paid within a few hundred dollars of each other. Source: Triple-I, Facts + Statistics: Homeowners and renters insurance (ISO data), Oct 2026. Chart drawn by this site from the source table, captured 21 Oct 2026.
How Does a Water Payout Compare With Other Causes?
- From 2019 to 2023, fire and lightning claims averaged $88,170, wind and hail $14,747, all other property damage $9,043 and theft $5,524 (Triple-I, Oct 2026).
- Across all causes, a homeowners claim averaged $17,059 over those five years (Triple-I, Oct 2026).
- ISO severity is the indemnity paid per accident-year claim, before loss adjustment expenses (Triple-I, Oct 2026).
What Do Repair Estimates Average Across All Causes?
- Verisk put the average replacement cost value of July to September 2025 claims at $16,755, 3.3% below the $17,328 final average for the same quarter of 2024 (Verisk, Sep 2025).
- Verisk expects that figure to settle between $17,258 and $18,431 as large claims finish (Verisk, Sep 2025).
- The April to June 2025 average was first reported at $16,944 and later matured to $18,384, a rise of 8.5% (Verisk, Sep 2025).
What Do Water Claims Pay in a State That Reports the Data?
- Florida insurers paid an average $14,035 in indemnity on accidental discharge or overflow claims that were not litigated (Florida OIR, Jan 2024).
- They paid an average $10,961 on other water claims that were not litigated (Florida OIR, Jan 2024).
How Fast Are Water Claim Costs Rising?
The trend is fewer claims and bigger ones. Counts have eased in every recent data set while the cost of each claim keeps climbing.
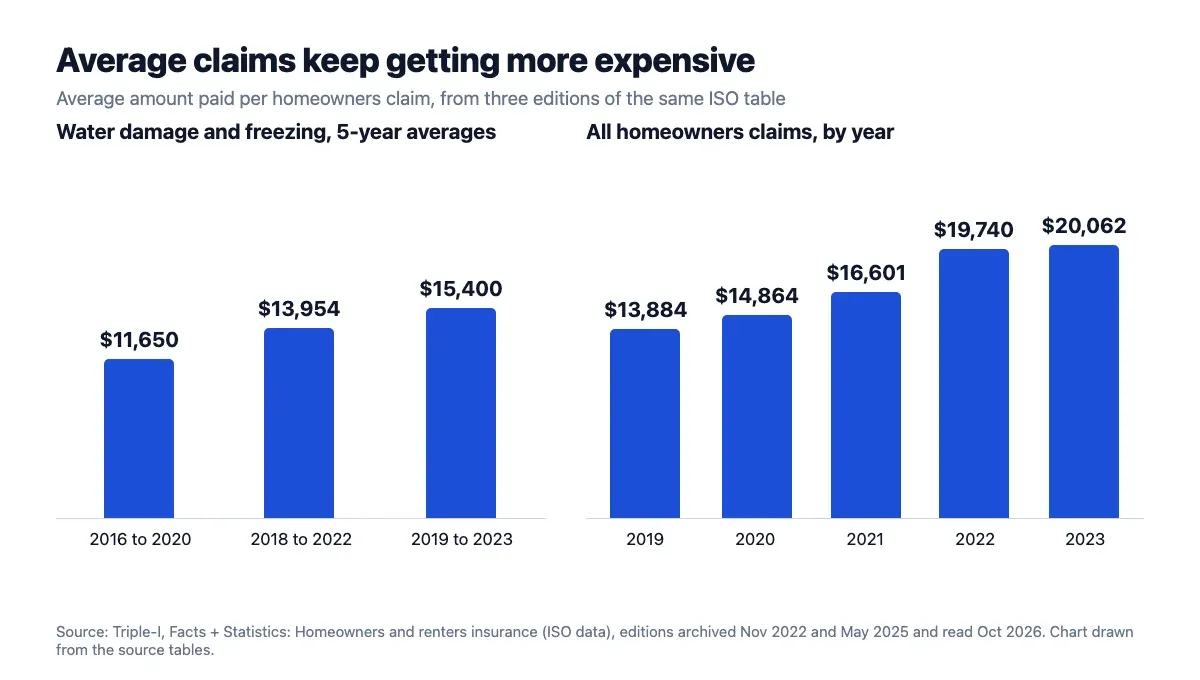 Figure 4: The average water damage and freezing claim rose with each new edition of the same ISO table, and the all-cause average climbed every year from 2019 to 2023. Source: Triple-I, Facts + Statistics: Homeowners and renters insurance (ISO data), Oct 2026. Chart drawn by this site from the current table and two archived editions, captured 21 Oct 2026.
How Much Have Average Payouts Risen?
- The 2016 to 2020 edition of the ISO table put the average water damage and freezing claim at $11,650 (Triple-I, archived edition, Nov 2022).
- The 2018 to 2022 edition put it at $13,954 (Triple-I, archived edition, May 2025).
- Water claim frequency was 1.61 per 100 house-years in the 2016 to 2020 table (Triple-I, archived edition, Nov 2022) and again in the 2018 to 2022 table (Triple-I, archived edition, May 2025).
- The average claim of any cause rose from $13,884 in 2019 to $20,062 in 2023 (Triple-I, Oct 2026).
- LexisNexis reports all-peril severity up 25.9% in 2025 and 93.2% above 2019 (LexisNexis Risk Solutions, Jul 2026).
How Did Non-Weather Water Claims Move Year by Year?
- In 2021, loss cost rose 8%, frequency 2% and severity 6% (LexisNexis Risk Solutions, Oct 2022).
- In 2023, loss cost fell 11.2% and severity fell 1.1% (LexisNexis Risk Solutions, Oct 2024).
- In 2024, loss cost fell 4.3% while severity rose 6.2% (LexisNexis Risk Solutions, Oct 2025).
- In 2025, loss cost fell 6.4% while severity rose 2.5% (LexisNexis Risk Solutions, Jul 2026).
How Did Storm-Driven Water Claims Move?
- Weather-related water claim frequency soared 329% in 2021, and catastrophic ones rose 222%, driven in part by the February storm in Texas that left many homes with broken pipes (LexisNexis Risk Solutions, Oct 2022).
- In 2023, weather-related water loss cost fell 51.4% and severity fell 34.8% (LexisNexis Risk Solutions, Oct 2024).
- In 2024, its loss cost rose 25.4% and severity rose 29.6% (LexisNexis Risk Solutions, Oct 2025).
- Weather-related water losses paid rose 66% between 2017 and 2023, and all home losses paid rose more than 45% (LexisNexis Risk Solutions, Nov 2024).
Why Do Costs Keep Rising?
- LexisNexis ties the long climb in non-weather water severity to inflation and rising material and labor costs for remediating water damage (LexisNexis Risk Solutions, Jul 2026).
- US hourly billable labor in Verisk’s pricing data rose 4.49% from October 2024 to October 2025 (Verisk, Sep 2025).
- Combined US labor and materials costs rose 3.8% over the same twelve months (Verisk, Sep 2025).
- US reconstruction costs rose 3.75% year over year in the third quarter of 2025 (Verisk, Sep 2025).
- Billable plumber labor rose 1.06% between January and April 2025 in Verisk’s US data (Verisk, Apr 2025).
Where Have Water Claims Grown Fastest?
Florida is the best-documented case, and it shows how fast water losses can move. Counts and costs both rose, and not evenly across the state.
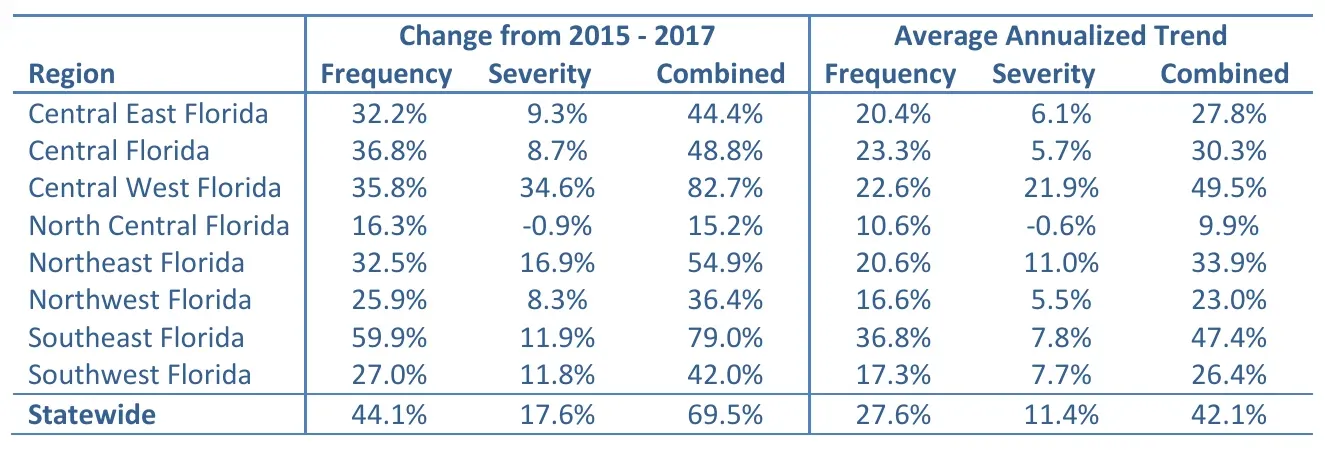 Figure 5: Southeast Florida had the largest rise in claim frequency and Central West Florida the largest rise in severity, while North Central Florida barely moved. Source: Florida Office of Insurance Regulation, Report of the 2017 Assignment of Benefits Data Call, Jan 2018. Table published by the source, cropped from the report, captured 21 Oct 2026.
How Fast Did Florida Water Losses Rise?
- From January 2015 to June 2017, water claim frequency rose 44.1%, severity rose 17.6% and the combined effect was 69.5% (Florida OIR, Jan 2018).
- From January 2010 to September 2015, frequency had risen 46.3%, severity 28.5% and the combined effect 88.0% (Florida OIR, Feb 2016).
- That earlier period averaged 14.2% a year in combined growth (Florida OIR, Feb 2016).
- The 2017 data call covered 144,983 water claims from insurers holding about 85.5% of HO-3 and dwelling fire policies in force (Florida OIR, Jan 2018).
Which Florida Regions Saw the Biggest Jumps?
- Southeast Florida frequency rose 59.9% between 2015 and 2017 (Florida OIR, Jan 2018).
- Central West Florida severity rose 34.6%, for a combined rise of 82.7% (Florida OIR, Jan 2018).
- North Central Florida severity slipped 0.9% (Florida OIR, Jan 2018).
What Do Other States Show?
- Texas had the most claims in July to September 2025, at 136,870, and non-catastrophe water claims were 27.5% of its volume (Verisk, Sep 2025).
- In California, non-catastrophe water claims were 29% of January to March 2025 claims, mostly from two winter weather events (Verisk, Mar 2025).
- California had the highest non-weather water loss cost in 2021, 10% above Arizona (LexisNexis Risk Solutions, Oct 2022).
- Oregon had the highest weather-related water loss cost in 2024, after a winter storm broke water pipes (LexisNexis Risk Solutions, Oct 2025).
What Does Home Water Damage Coverage Include and Exclude?
Coverage turns on one word: sudden. A burst pipe is usually covered, a slow leak usually is not, and the policy text decides the rest.
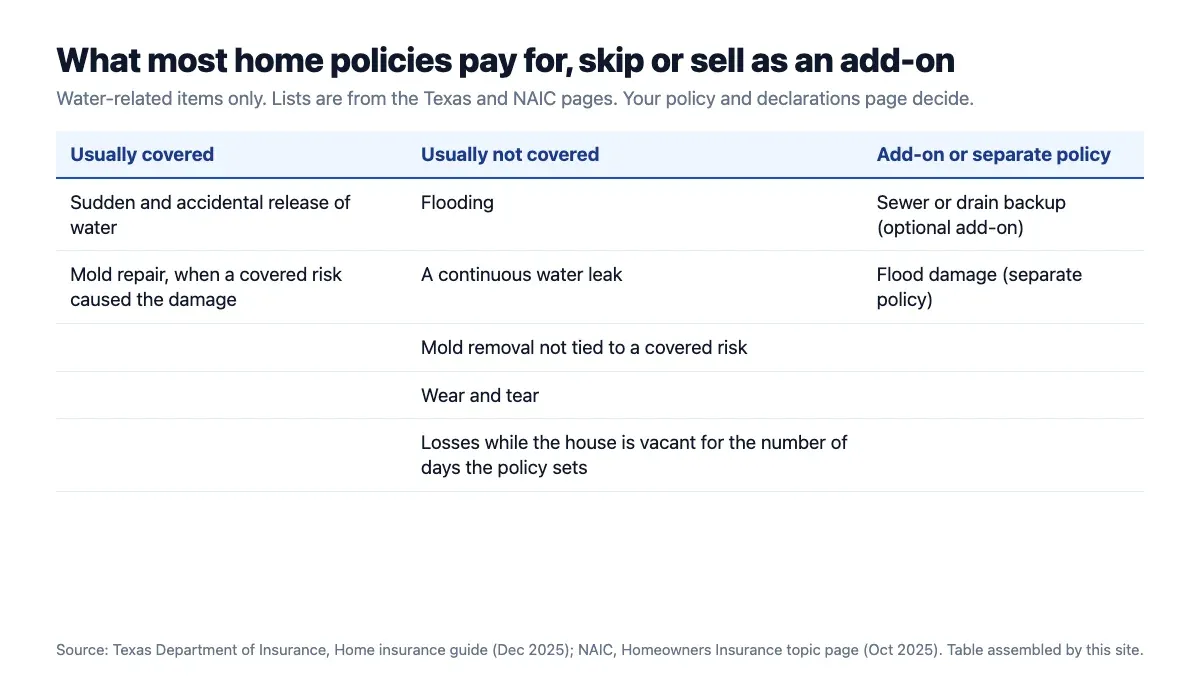 Figure 6: Sudden releases of water are usually covered, while flooding, continuous leaks and wear and tear are not, and sewer backup is an add-on. Source: Texas Department of Insurance, Home insurance guide, Dec 2025, and NAIC, Homeowners Insurance, Oct 2025. Table assembled by this site from both pages, captured 21 Oct 2026.
What Water Damage Is Usually Covered?
- Most Texas policies cover the sudden and accidental release of water or smoke (Texas Department of Insurance, Dec 2025).
- Travelers says a burst pipe is often covered when it is sudden and accidental, but a known leak left alone may not be (Travelers, Oct 2026).
- A policy usually pays for the floor a leaking washing machine ruined, but not for the machine (Nationwide, Oct 2026).
- Belongings are generally covered at 50 to 70% of the amount on the structure, and detached buildings at about 10% (Triple-I, Oct 2026).
What Is Usually Excluded?
- Most Texas policies do not cover flooding, a continuous water leak, mold removal unrelated to a covered risk, wear and tear, or losses while the house sits vacant past the policy limit (Texas Department of Insurance, Dec 2025).
- A standard policy will not pay for flood, earthquake or routine wear and tear (Triple-I, Oct 2026).
- Water from repeated seepage over weeks, months or years may be denied (Nationwide, Oct 2026).
- Most policies will not cover a water line break unless the line suffered sudden, significant damage (Travelers, Oct 2026).
What Can a Homeowner Add or Raise?
- The NAIC lists sewer backup among the common optional add-ons and says flood needs a separate policy (NAIC, Oct 2025).
- Additional living expense cover in Texas might be limited to 10 to 20% of the dwelling coverage (Texas Department of Insurance, Dec 2025).
- Paying a deductible above the $500 or $1,000 minimum can lower the premium (Triple-I, Oct 2026).
How Often Are Water Claims Disputed, Denied or Reopened?
No national denial rate for water claims turned up in the sources used for this page. The closest hard numbers come from Florida, where insurers must report every closed claim, and they show water claims ending in dispute more often than hurricane claims.
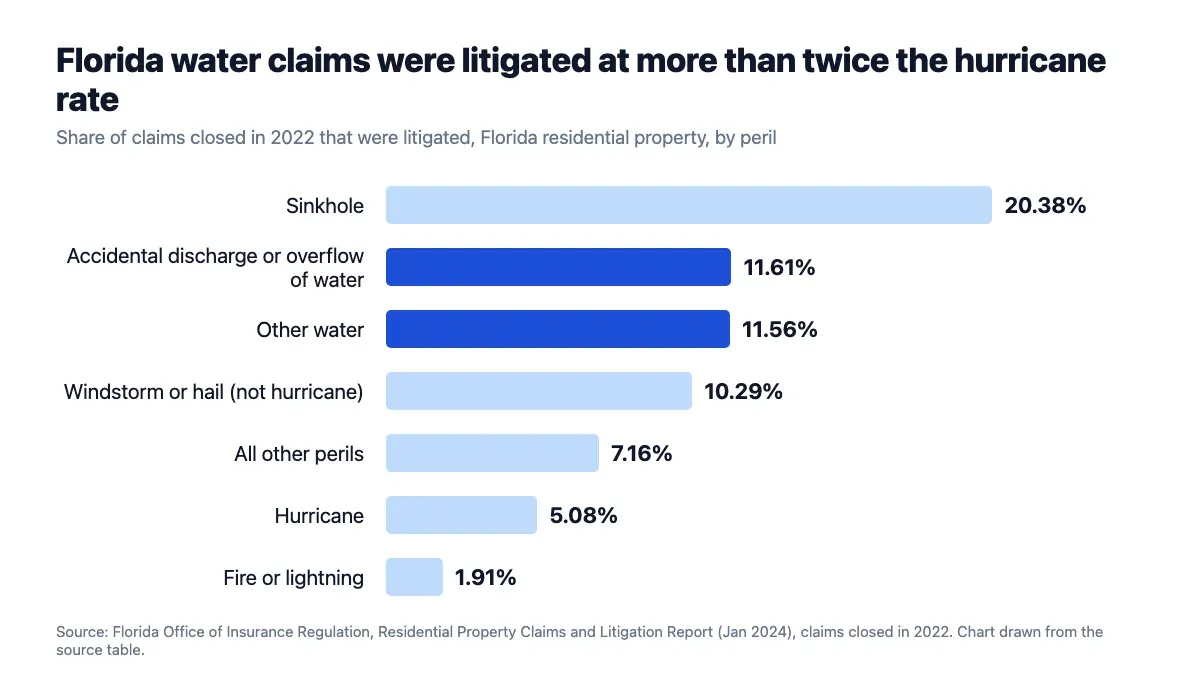 Figure 7: Florida water claims were litigated at more than twice the rate of hurricane claims, and sinkhole claims were litigated most often. Source: Florida Office of Insurance Regulation, Residential Property Claims and Litigation Report, Jan 2024. Chart drawn by this site from the source table, captured 21 Oct 2026.
How Often Do Florida Water Claims Reach Court?
- Other water claims were litigated 11.56% of the time, windstorm and hail claims 10.29%, hurricane claims 5.08% and fire claims 1.91% (Florida OIR, Jan 2024).
- Across all perils, 58,395 of the 732,390 claims closed in 2022 were litigated (Florida OIR, Jan 2024).
- In Palm Beach, Broward and Miami-Dade counties, 27.5% of closed claims were litigated (Florida OIR, Jan 2024).
- Florida had 14.9% of US claims but 70.9% of US litigation in 2022, according to NAIC data cited by the regulator (Florida OIR, Jan 2024).
How Much More Does a Litigated Claim Cost?
- Litigated accidental discharge claims averaged $31,862 in indemnity, and litigated other water claims $24,851 (Florida OIR, Jan 2024).
- Insurers spent an average $10,957 in loss adjustment expense on a litigated accidental discharge claim, against $1,576 when it was not litigated (Florida OIR, Jan 2024).
How Often Are Claims Reopened?
- Other water claims were reopened 48.5% of the time, windstorm and hail claims 51.0%, fire claims 33.6% and hurricane claims 33.0% (Florida OIR, Jan 2024).
What Must an Insurer Say When It Denies a Claim?
- Pennsylvania insurers may not deny a claim on a specific policy provision, condition or exclusion unless the written denial names it (Pennsylvania Code, Oct 2026).
- Washington has the same rule, and the denial must be in the claim file (Washington Administrative Code, Oct 2026).
- Virginia requires a reasonable written explanation with a specific reference to the policy provision, condition or exclusion (Virginia Administrative Code, Oct 2026).
- A Texas rejection notice must state the reasons for the rejection (Texas Legislature, Oct 2026).
- New York requires the insurer to explain its specific reasons for disclaiming coverage (New York Codes, Rules and Regulations, Oct 2026).
- California requires a written statement of all bases for a denial, and notice that the claimant may ask the Department of Insurance to review it (California Code of Regulations, Oct 2026).
- Florida requires a reasonable written explanation of the basis for a payment, denial or partial denial (Florida Legislature, Oct 2026).
How Can a Homeowner Dispute an Amount?
- In Texas, appraisal settles disputes about the amount of a claim, not whether the policy covers the loss (Texas Department of Insurance, Dec 2025).
- Claims under $10,000 can go to Justice Court, and a disaster claim needs 61 days of written notice before a lawsuit (Texas Department of Insurance, Dec 2025).
How Long Does It Take to Settle a Water Claim?
Most Florida water claims close within about two months, and the slowest ones cost the most. Time on the clock and money paid rise together.
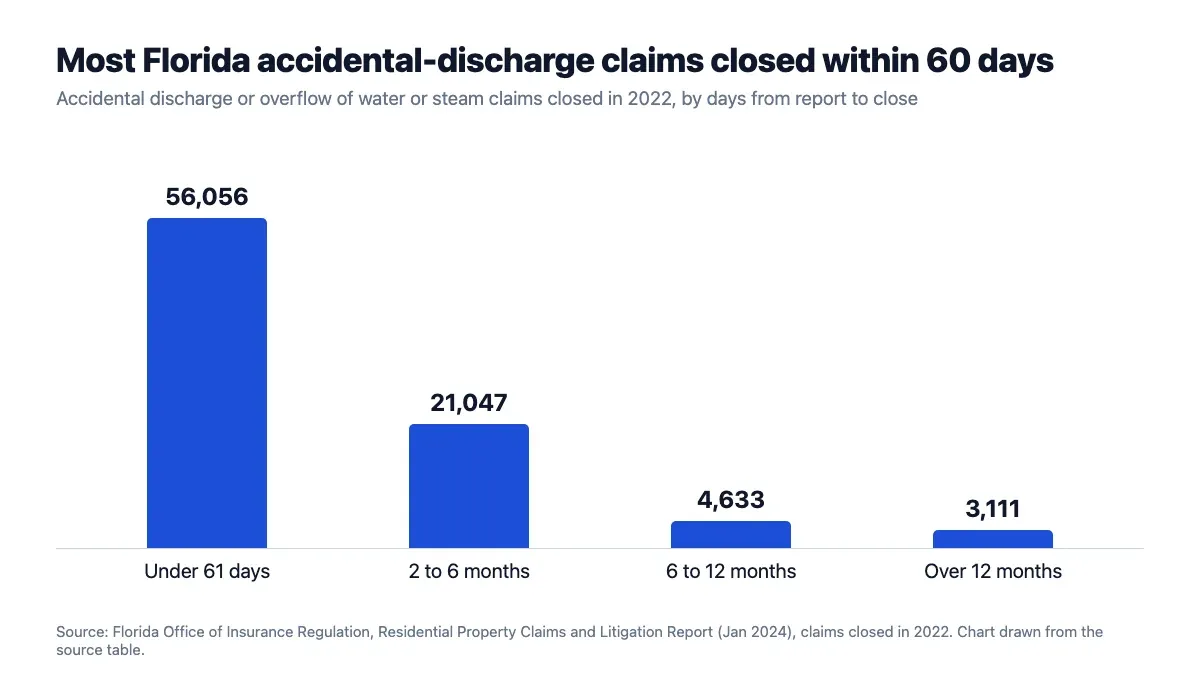 Figure 8: Most Florida accidental discharge claims closed in under 61 days, and a small tail stayed open past a year. Source: Florida Office of Insurance Regulation, Residential Property Claims and Litigation Report, Jan 2024. Chart drawn by this site from the source table, captured 21 Oct 2026.
How Long Do Florida Water Claims Take to Close?
- Of the accidental discharge claims closed in 2022, 56,056 closed in under 61 days, 21,047 in 2 to 6 months, 4,633 in 6 to 12 months and 3,111 after more than 12 months (Florida OIR, Jan 2024).
- For other water claims, 58,002 closed in under 61 days and 2,314 took more than 12 months (Florida OIR, Jan 2024).
- Across all perils, a claim took an average 50 days to be reported and 60 days to close (Florida OIR, Jan 2024).
- Of the accidental discharge claims, 78,506 took under 61 days to report and 1,022 took more than 12 months (Florida OIR, Jan 2024).
Does a Longer Claim Pay More?
- Non-litigated accidental discharge claims paid an average $9,038 when closed in under 61 days and $57,479 when closed after more than 365 days (Florida OIR, Jan 2024).
- Non-litigated other water claims rose from $7,595 to $55,562 across the same span (Florida OIR, Jan 2024).
What Slows a Claim Down?
- Verisk says larger, more complex claims take 2 to 3 months after receipt to be completed and returned to its platform (Verisk, Sep 2025).
- With replacement cost cover, most Texas insurers pay twice: first for repairs minus depreciation and the deductible, then the held-back depreciation once repairs are billed (Texas Department of Insurance, Dec 2025).
- When a mortgage is involved, the lender must contact the homeowner within 10 days of getting the payment (Texas Department of Insurance, Apr 2025).
- Before December 16, 2022, Florida gave insurers 90 days to pay or deny (Florida OIR, Jan 2024).
An adjuster pays against an estimate and an invoice, so the plumber’s paperwork sits inside the insurer’s clock.
What Deadlines Do Insurers Have to Answer a Claim?
The clock is set by state law, and it starts at different points. Some states count from the claim notice, others from the proof of loss the homeowner sends. Washington changes its rule on October 18, 2026.
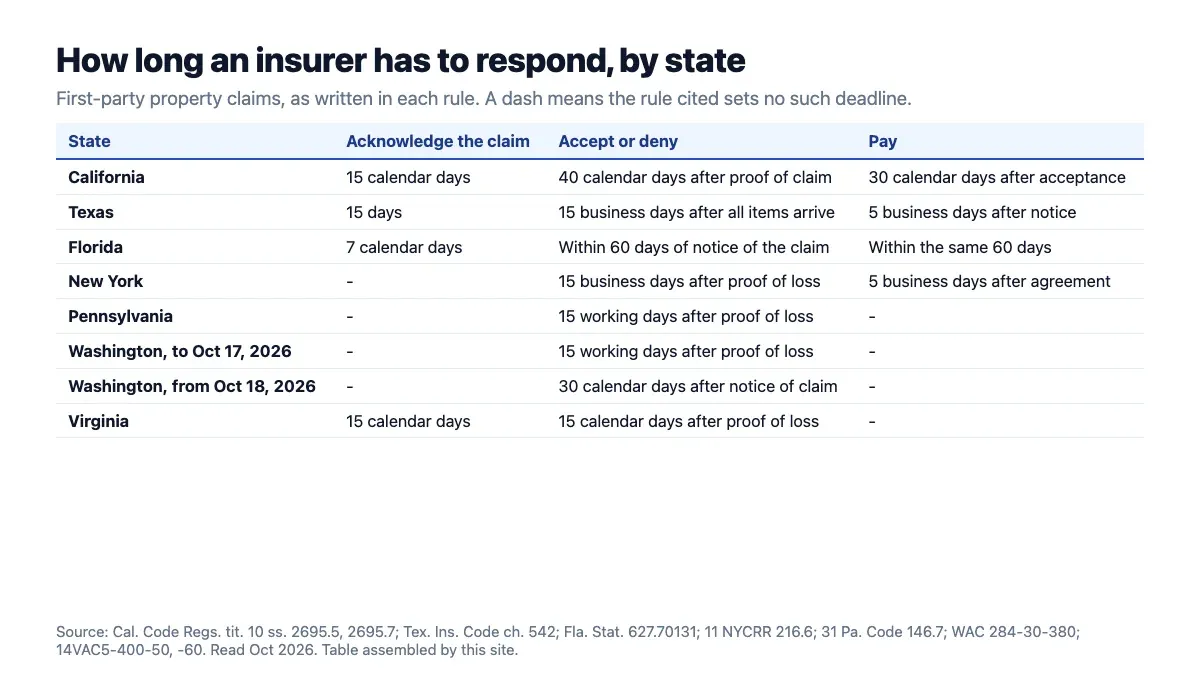 Figure 9: The clocks differ widely by state, and so does the event that starts them. Source: state claims rules including Cal. Code Regs. tit. 10, s. 2695.7, Tex. Ins. Code ch. 542, Fla. Stat. 627.70131, 11 NYCRR 216.6, 31 Pa. Code 146.7, WAC 284-30-380 and 14VAC5-400-60, read Oct 2026. Table assembled by this site, captured 21 Oct 2026.
What Are the Texas Deadlines?
- A Texas insurer must acknowledge a claim, start its investigation and request what it needs by the 15th day after notice (Texas Legislature, Oct 2026).
- If it needs more time to decide, it has until the 45th day after it explains why (Texas Legislature, Oct 2026).
- Once it accepts a claim, it must pay by the fifth business day (Texas Legislature, Oct 2026).
- A delay beyond 60 days after receiving the items makes the insurer liable for damages (Texas Legislature, Oct 2026).
- A late insurer owes interest at 18% a year plus attorney’s fees, and claims under Chapter 542A carry a different interest rate (Texas Legislature, Oct 2026).
- TDI can extend these deadlines by 15 more days after a weather-related catastrophe (Texas Department of Insurance, Apr 2025).
What Are the California Deadlines?
- A California insurer has 15 calendar days after notice of claim to acknowledge it, send forms and begin investigating (California Code of Regulations, Oct 2026).
- It has 40 calendar days after proof of claim to accept or deny (California Code of Regulations, Oct 2026).
- It has 30 calendar days after acceptance to pay (California Code of Regulations, Oct 2026).
What Are the Florida Deadlines?
- A Florida insurer must acknowledge a claim communication within 7 calendar days (Florida Legislature, Oct 2026).
- It must begin its investigation within 7 days of proof of loss and inspect within 30 days (Florida Legislature, Oct 2026).
What Do New York, Pennsylvania, Washington and Virginia Require?
- New York requires an accept or reject notice within 15 business days of proof of loss, and payment within five business days of an agreement (New York Codes, Rules and Regulations, Oct 2026).
- Pennsylvania requires the decision within 15 working days of proof of loss, then a status letter 30 days later and every 45 days after (Pennsylvania Code, Oct 2026).
- Until October 17, 2026, Washington requires a decision within 15 working days of a completed proof of loss (Washington Administrative Code, Oct 2026).
- Washington insurers must also finish an investigation within 30 days unless it cannot reasonably be done (Washington Administrative Code, Oct 2026).
- Virginia requires an acknowledgment within 15 calendar days of notice of a claim (Virginia Administrative Code, Oct 2026).
- Virginia requires an accept or deny notice within 15 calendar days of proof of loss, with status notices every 45 calendar days while an investigation runs on (Virginia Administrative Code, Oct 2026).
Do Water Claims Raise Premiums or Put Coverage at Risk?
A paid water claim goes on a record that other insurers read for years, and some states limit what an insurer may do with it. Texas spells the limits out.
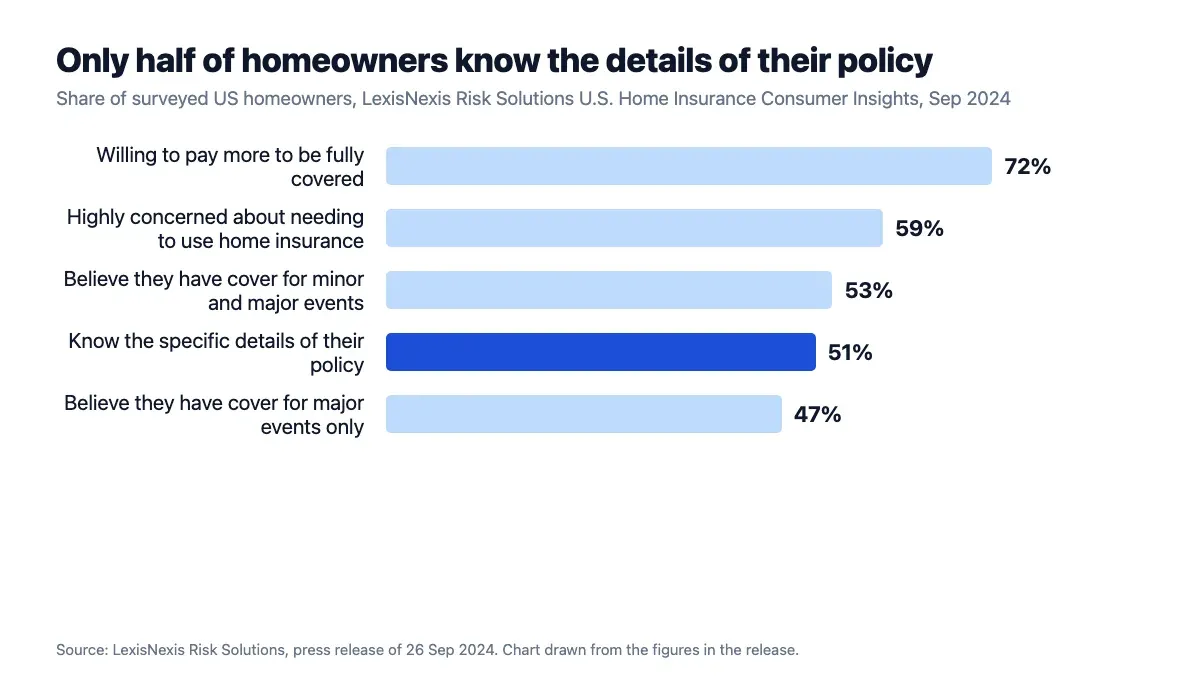 Figure 10: Most homeowners would pay more to be fully covered, yet only about half know the details of the policy they hold. Source: LexisNexis Risk Solutions, U.S. Home Insurance Consumer Insights, Sep 2024. Chart drawn by this site from the figures in the release, captured 21 Oct 2026.
How Long Does a Claim Stay on Record?
- A CLUE report shows the claims filed on a home or car for the past seven years, including claims made before the current owner bought the home (Texas Department of Insurance, Oct 2024).
- Insurers report the date of loss, the loss type and the amount paid (Texas Department of Insurance, Oct 2024).
- Triple-I describes the C.L.U.E. history as going back five years, with one free report allowed each year (Triple-I, Oct 2026).
What Can a Texas Insurer Do After a Water Claim?
- An insurer may decline to renew after three or more non-weather claims in three years, and it must warn the homeowner after two (Texas Department of Insurance, Dec 2025).
- The first two appliance-related water damage claims do not count if the damage was fixed and passed inspection (Texas Department of Insurance, Dec 2025).
- Insurers cannot charge more for appliance-related water damage claims with certified repairs, unless the homeowner has three or more claims in three years (Texas Department of Insurance, Feb 2026).
- A nonrenewal needs 60 days of notice for policies bought or renewed in 2024 (Texas Department of Insurance, Dec 2025).
- Companies cannot charge more for a call to ask about the policy or the claims process (Texas Department of Insurance, Feb 2026).
How Do Homeowners Feel About Using Their Cover?
- 72% of homeowners are willing to pay higher premiums to be fully covered, and 59% are highly concerned about having to use their insurance (LexisNexis Risk Solutions, Sep 2024).
- 53% believe they have cover for minor and major events, while 47% believe they have cover for major events only (LexisNexis Risk Solutions, Sep 2024).
- 70% of homeowners rely on a carrier or agent to make sure they have the right type and amount of coverage (LexisNexis Risk Solutions, Sep 2024).
What Paperwork Do Water Claims Need, and Where Does the Plumber Fit?
A water claim is won or lost on the file: photos, receipts, an itemized estimate and proof the deductible was paid. The contractor’s paperwork is part of that file, and some of the rules about it are changing.
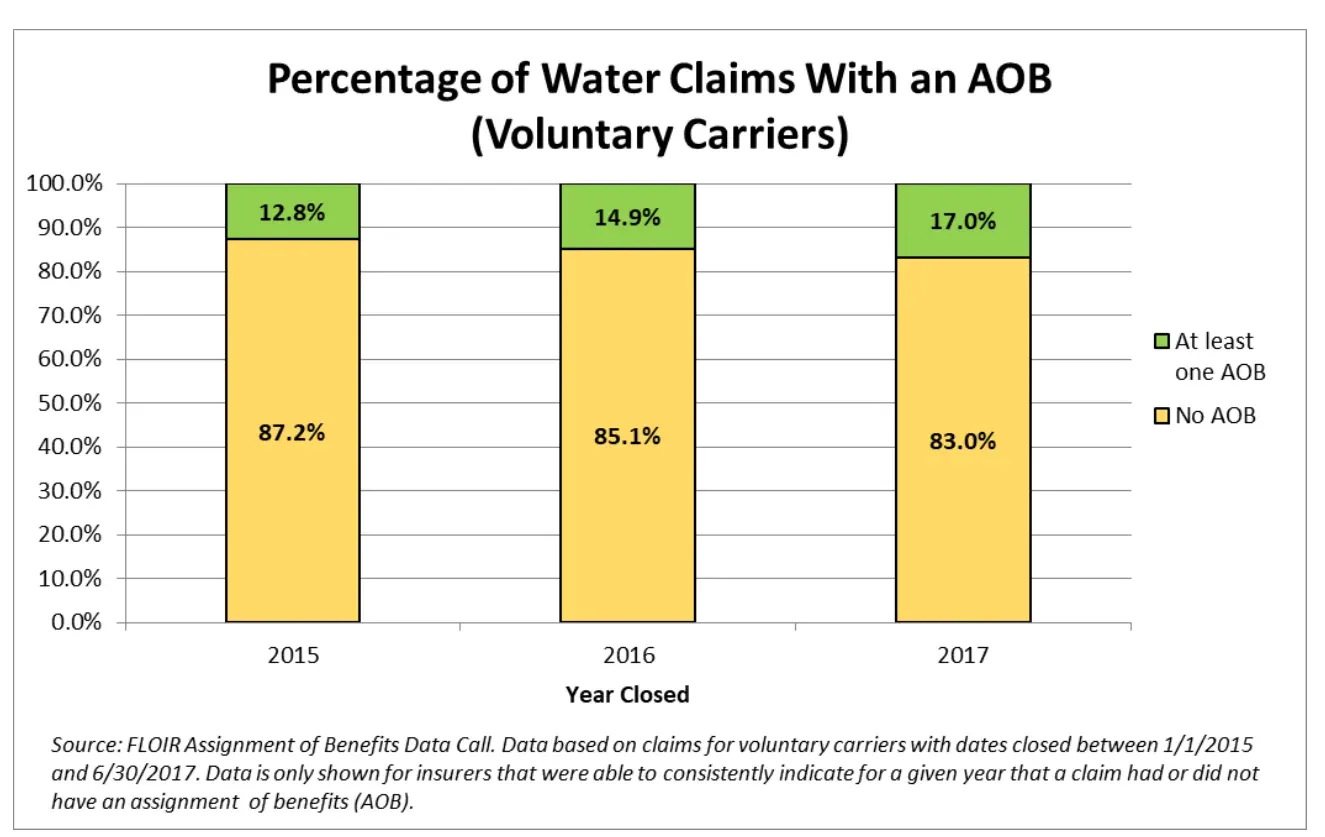 Figure 11: The share of Florida water claims that carried an assignment of benefits grew each year from 2015 to 2017. Source: Florida Office of Insurance Regulation, Report of the 2017 Assignment of Benefits Data Call, Jan 2018. Chart published by the source, cropped from the report, captured 21 Oct 2026.
What Do Regulators Tell Homeowners to Collect?
- Texas tells homeowners to take photos or videos of damage before repairs and to make only temporary repairs (Texas Department of Insurance, Dec 2025).
- It also says to keep receipts and to have the contractor present when the adjuster visits (Texas Department of Insurance, Dec 2025).
- If the damage is worse than the adjuster first thought, the homeowner or contractor can ask the adjuster to raise the estimate (Texas Department of Insurance, Dec 2025).
- California says the insurer reimburses reasonable costs to protect the property when the homeowner saves the receipts (California Department of Insurance, Feb 2025).
- Nationwide says to photograph and film all damage and to keep receipts for food and temporary housing (Nationwide, Oct 2026).
What Must Contractors Avoid?
- It is illegal in Texas for a contractor to waive a deductible or help the homeowner avoid paying it (Texas Department of Insurance, Dec 2025).
- An insurer can ask for proof the deductible was paid, such as a canceled check, a money order receipt, a card statement or the payment plan (Texas Department of Insurance, Dec 2025).
How Common Are Assignments of Benefits?
- In Florida, 12.8% of water claims carried an assignment of benefits in 2015 and 17.0% in 2017 (Florida OIR, Jan 2018).
- The regulator based that analysis on 110,255 claims (Florida OIR, Jan 2018).
- Florida describes an assignment as a document that lets a third party, such as a water extraction company, roofer or plumber, seek payment directly from the insurer (Florida OIR, Oct 2026).
- The regulator says a homeowner is not required to sign one to get repairs done (Florida OIR, Oct 2026).
What Estimate Sits Behind the Payment?
- A Florida insurer must send the policyholder any detailed estimate within 7 days after its adjuster generates it (Florida Legislature, Oct 2026).
- From October 18, 2026, a Washington insurer that prices with a database, survey or estimating software must tell a claimant, on request, when the data was collected, where it came from and which businesses supplied the cost data (Washington Administrative Code, Aug 2026).
A shop that prices from a written price book can show where each price came from, which is what the new Washington rule asks of insurers.
Glossary
- AOB: assignment of benefits, a policyholder signing over insurance claim rights to a third party such as a contractor.
- CAT: catastrophe, a claim from an event the industry marks as a catastrophe.
- CLUE: Comprehensive Loss Underwriting Exchange, the claims history database run by LexisNexis.
- Frequency: claims per 100 insured house-years, where one house-year is one home insured for 12 months.
- HO-3: the most common homeowners policy form, covering the dwelling against all causes not excluded.
- ISO: the Verisk business that collects insurer loss data, source of the Triple-I tables.
- LAE: loss adjustment expense, what an insurer spends to investigate and settle a claim.
- OIR: the Florida Office of Insurance Regulation.
- PCLR: the Florida Residential Property Claims and Litigation Report.
- RCV: replacement cost value, the estimated cost to repair or replace at current prices.
- Severity: the average amount paid per claim.
- TDI: the Texas Department of Insurance.
- Triple-I: the Insurance Information Institute, an industry research group.
Methodology and Sources
Every figure comes from the insurer, data firm, regulator or statute that published it, and every link opens the report, rule or page that holds the number. Verisk, LexisNexis and ISO describe the claims their members and customers report, so they describe insured homes and not every home. Verisk reports are dated by the last month of the period they cover. Pages with no date carry the month they were read, October 2026. Florida figures are for claims closed in 2022 and for 2015 to 2017, and the text says so each time. State rules were read as published in October 2026 and can change. Texas Department of Insurance pages were read from Internet Archive copies made in 2026, and the links point to the original pages. The two earlier Triple-I editions are linked as Internet Archive copies because the live page now shows only the newest edition. Verisk’s report page lists its quarterly reports only through July to September 2025, so that is the latest Verisk data here. The page is refreshed monthly.
Sources
- Triple-I, Facts + Statistics: Homeowners and renters insurance
- Triple-I, Facts + Statistics, 2016 to 2020 edition (Internet Archive copy)
- Triple-I, Facts + Statistics, 2018 to 2022 edition (Internet Archive copy)
- Triple-I, What is covered by standard homeowners insurance
- Triple-I, How to save money on your homeowners insurance
- Triple-I, What is a loss history report
- Verisk, Quarterly Property Report, Q4 2023
- Verisk, Quarterly Property Report, January to March 2024
- Verisk, Quarterly Property Report, October to December 2024
- Verisk, Quarterly Property Report, January to March 2025
- Verisk, Quarterly Property Report, April to June 2025
- Verisk, Quarterly Property Report, July to September 2025
- LexisNexis Risk Solutions, 2026 U.S. Home Trends Report release
- LexisNexis Risk Solutions, 2025 U.S. Home Trends Report release
- LexisNexis Risk Solutions, 2024 U.S. Home Trends Report release
- LexisNexis Risk Solutions, 2022 Home Insurance Trends Report release
- LexisNexis Risk Solutions, Home Insurance Loss Rising
- LexisNexis Risk Solutions, U.S. Home Insurance Consumer Insights release
- Florida OIR, Residential Property Claims and Litigation Report
- Florida OIR, Report of the 2017 Assignment of Benefits Data Call
- Florida OIR, Review of the 2015 Assignment of Benefits Data Call
- Florida OIR, Assignment of Benefits Resources
- Texas Department of Insurance, Home insurance guide
- Texas Department of Insurance, Will my premium go up if I file a claim
- Texas Department of Insurance, Steps to getting your claim paid
- Texas Department of Insurance, Is it OK for a contractor to waive my deductible
- Texas Department of Insurance, How to get a CLUE about your claims history
- Texas Legislature, Insurance Code chapter 542
- Florida Legislature, Statute 627.70131
- California Code of Regulations, 10 CCR 2695.5
- California Code of Regulations, 10 CCR 2695.7
- California Department of Insurance, Residential Property Claims Guide
- New York Codes, Rules and Regulations, 11 NYCRR 216.6
- Pennsylvania Code, 31 Pa. Code 146.7
- Washington Administrative Code, WAC 284-30-370
- Washington Administrative Code, WAC 284-30-380
- Virginia Administrative Code, 14VAC5-400-50
- Virginia Administrative Code, 14VAC5-400-60
- Virginia Administrative Code, 14VAC5-400-70
- NAIC, Homeowners Insurance
- Nationwide, Does homeowners insurance cover water damage
- Nationwide, Does home insurance cover plumbing
- Travelers, Answers to 5 common insurance questions about home water damage
- Travelers, Does homeowners insurance cover burst pipes